
Summary:
- Significant Upside Potential: Both models project strong growth for Medtronic, with the first indicating a remarkable 130.3% increase and the more conservative second model predicting a compelling 26.7% annual return.
- Diverse Analytical Approaches: The analysis encompasses various methodologies, including analysts’ estimates, market-based segmentation, and a conservative revenue prediction model, enhancing the overall depth and reliability of the assessment.
- Resilient Financial Performance: Medtronic’s proactive cost-cutting strategy, aiming for $1 billion in savings by 2025, reflects financial resilience and positions the company for future growth amid healthcare challenges.

JHVEPhoto
Thesis
Since my initial article on Medtronic plc (NYSE:MDT) the stock has experienced a decline, propelled by concerns surrounding Medtronic’s diabetes business—primarily focused on insulin pumps and monitors. The apprehension stems from the recent approvals of weight loss drugs by Novo Nordisk A/S (NVO) and Eli Lilly and Company (LLY), which have cast doubt on the future prospects of the aforementioned diabetes segment.
This article aims to elucidate why Medtronic remains resilient and why weight-loss drugs pose no significant threat to the overall strength of the company.
In my previous analysis, I established a fair stock price of $128.79, indicating a potential upside of 58% at that time. However, in this updated assessment, I am upgrading it to a Strong Buy. Consequently, I am revising its fair price upward to $137.6.
Overview
Q2 Earnings Report
In the second quarter of 2024, Medtronic surpassed EPS estimates by $0.07 and exceeded revenue expectations by $80 million. Following this positive performance, Medtronic has revised its non-GAAP EPS guidance, increasing it from $5.08-$5.16 to $5.13-$5.19—a difference of $0.04, corresponding to $45.2 million.
Why the stock was declining after my first article?
Since the publication of my initial article on Medtronic, the stock initially experienced a decline of 14.62%, despite my projection of Medtronic’s fair value at $128.79, representing a 58% increase over the prevailing stock price of $82.19 at that time.
The primary catalyst for this 14.62% downturn was the approval of obesity drugs by companies such as Novo Nordisk and Eli Lilly. These drugs aim to expedite weight loss in obese individuals undergoing a strict diet and exercise regimen. The concern arose from the potential impact on Medtronic’s diabetes segment, given that individuals at the highest risk of diabetes are often obese. If a treatment facilitates weight loss in this demographic, the risk of diabetes is expected to decrease.
However, the stock has since rebounded, and the initial 14.6% decline has now narrowed to a mere 2.63%. In my opinion, a key factor contributing to this recovery is the realization that current obesity pills may induce serious side effects, including a heightened risk of bowel obstruction and gastrointestinal issues. As of now, weight-loss pills are not deemed efficient enough to jeopardize the market for diabetic devices and treatments.
It is crucial to note that Medtronic’s diabetes segment specializes in selling insulin pumps, such as the MiniMed 630G, and glucose monitors. Therefore, a reduction in the diabetic population would likely lead to a substantial decline in demand for these products.
Stock Performance after my first article on Medtronic was released (Seeking Alpha)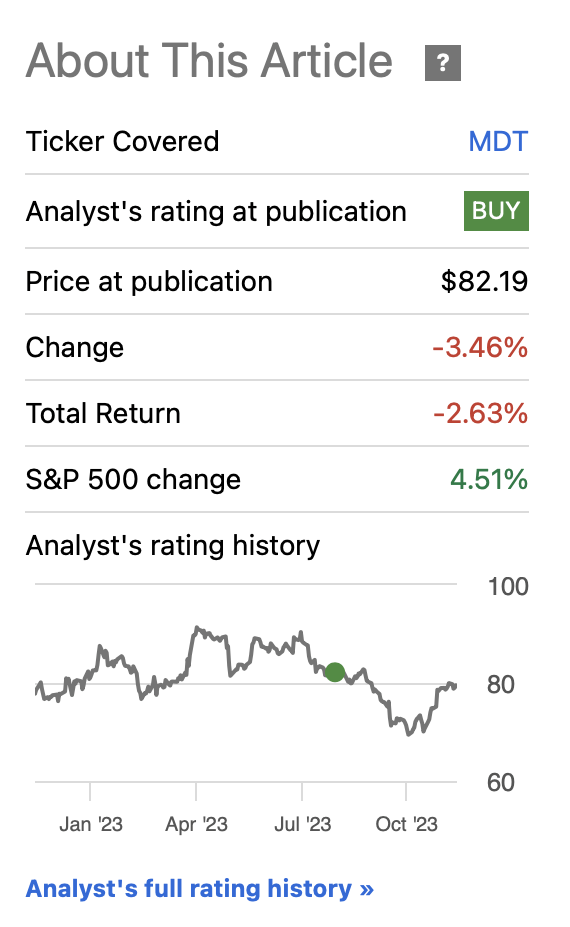
Which players have released weight-loss treatments?
The most known is Novo Nordisk’s Wegovy which was launched in the U.S. in June 2021, but due to an initial production outage, all doses became available in December 2022. The other drug created by Novo Nordisk is Ozempic, which is a weekly injection designed to lower blood sugar by stimulating the pancreas to produce more insulin. This last one is prescribed for weight loss despite not being approved for that purpose.
Eli Lilly offers Zepbound in the form of an injection, which is FDA-approved if combined with a reduced-calorie diet and increased physical activity for chronic weight management.
Finally there is Pfizer’s danuglipron, which demonstrated significant weight loss in a clinical trial as participants experienced an average weight loss ranging from 8% to 13% after 32 weeks. This product is not still approved for prescription.
Why won’t Medtronic suffer if weight-loss medications gain traction?
It’s important to note that the current drawback of weight loss treatments lies in the fact that patients typically begin regaining weight as soon as they cease the treatment.
Additionally, it’s crucial to recognize that Medtronic’s diabetes business contributes only approximately 7.64% to its overall revenues. The primary revenue driver for Medtronic is its cardiovascular devices segment, which accounts for a significant 36.6% of the total revenue. As mentioned earlier, the weight loss treatments under discussion have side effects related to heart diseases, and paradoxically, this could be advantageous for Medtronic given its substantial presence in the cardiovascular devices market.
In line with its strategic vision, Medtronic is actively pursuing a cost-cutting strategy, with a particular emphasis on divesting certain assets. As articulated by the CEO, this approach is anticipated to generate savings totaling $1 billion by the year 2025.
Market (In millions of USD unless states otherwise)
Medtronic’s primary revenue driver, the cardiovascular devices market, is projected to maintain a robust growth trajectory with a compound annual growth rate [CAGR] of 7.9% until the year 2032. This notable projection underscores the promising growth prospects within Medtronic’s pivotal sector.
Precedence Research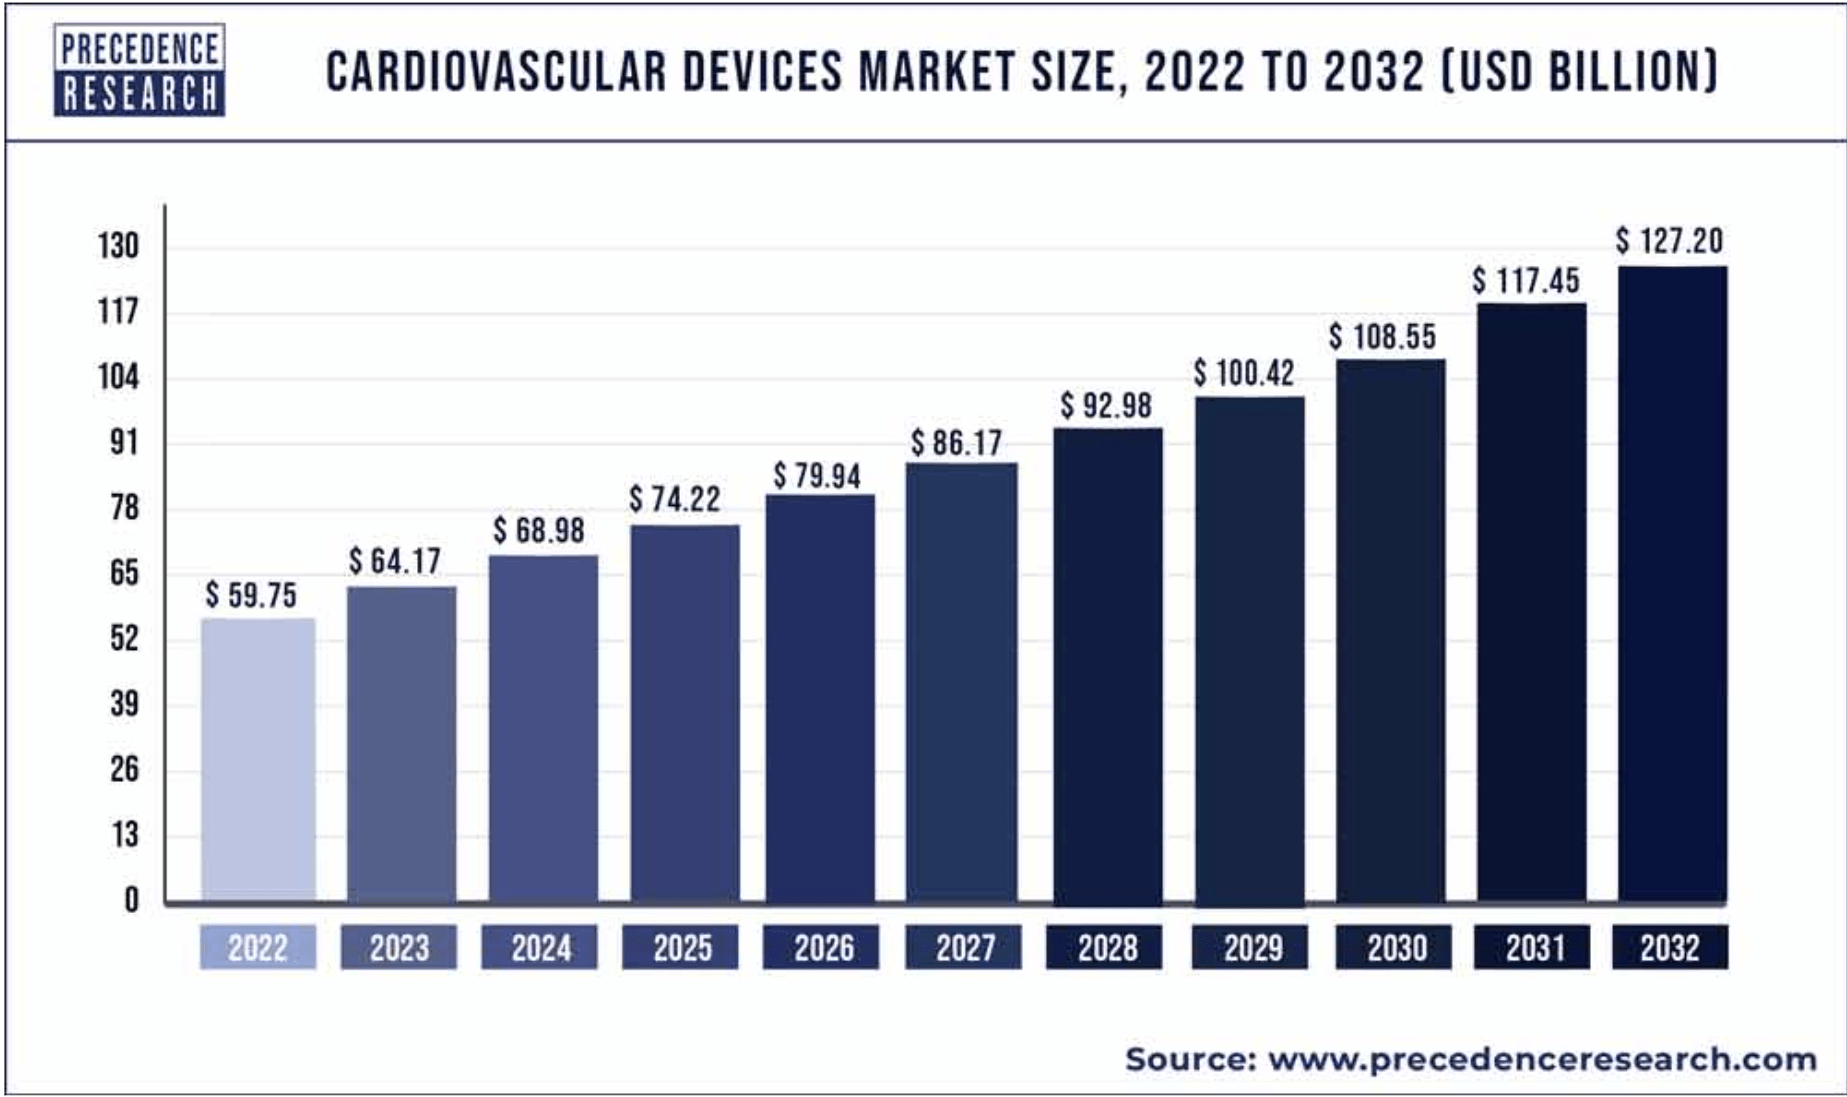
Globally, the medical surgical devices market is anticipated to expand substantially, demonstrating a CAGR of 9.4%. This growth trajectory is expected to elevate the market from $16.8 billion in 2023 to a substantial $31.58 billion by 2030.
Author’s Calculations with base on Grand View Research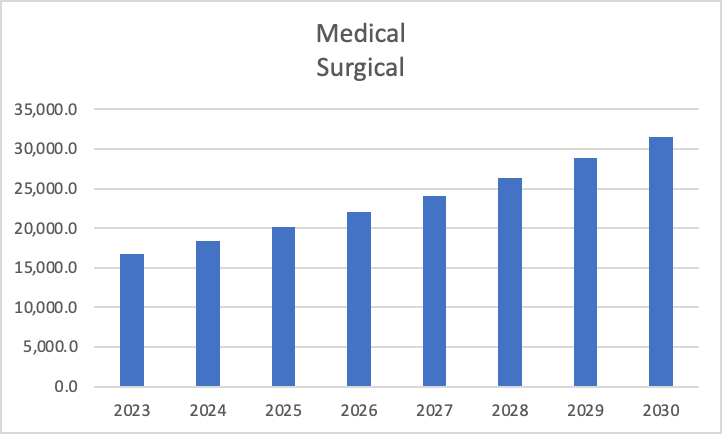
Within the realm of neuroscience, an upward trajectory is foreseen, transitioning from $31.38 billion in 2022 to an estimated $41.86 billion in 2027. This growth is underpinned by a calculated CAGR of 5.95%.
Author’s Calculations with base on The Business Research Company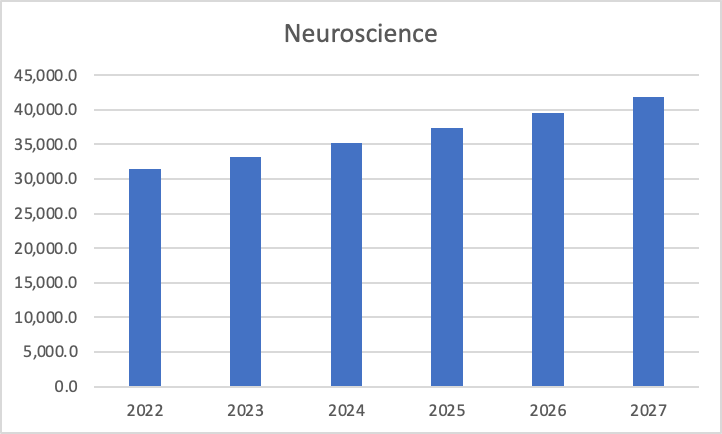
Conversely, the diabetes medical devices segment is poised for remarkable advancement. Projected to surge at a CAGR of 9.8%, this segment is anticipated to burgeon from $41.2 billion in 2022 to an impressive $107.1 billion by 2032. This trajectory is fueled by escalating diabetes prevalence and escalating investments from both public and private entities in this domain.
Author’s Calculations with base on Global Market Insights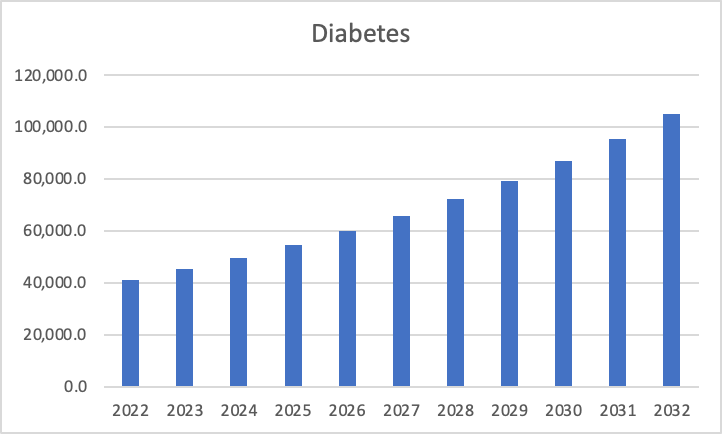
As you may have guessed, the main driver of growth here, is the aging population that will increase the demand for medical procedures. Evidently, all segments, except for neuroscience, are poised for high single-digit growth. This trend is promising, indicating that Medtronic possesses the potential to outpace the 4 – 4.5% growth it has maintained over the past five years – a rate that aligns with its recent Q4 2023 earnings report. Should Medtronic align its growth with the pace of their respective market segments, an optimal growth rate of 8.25% could feasibly be anticipated.
Financials (In millions of USD unless states otherwise)
Since the release of my first article on Medtronic in Q1 2024, the 2024 TTM revenue has shown a modest increase, rising from $31.5 billion to $31.95 billion, reflecting a 1.42% growth. Over a more extended period, since FY 2018, Medtronic’s revenue has demonstrated consistent annual growth, averaging 6.67%.
Operating incomes have similarly experienced a marginal uptick, registering an increase of 1.29%. Notably, the most substantial growth has been observed in net income, surging by approximately 13.3% from the Q1 2024 TTM figure to the Q2 2024 TTM metric.
Author’s Calculations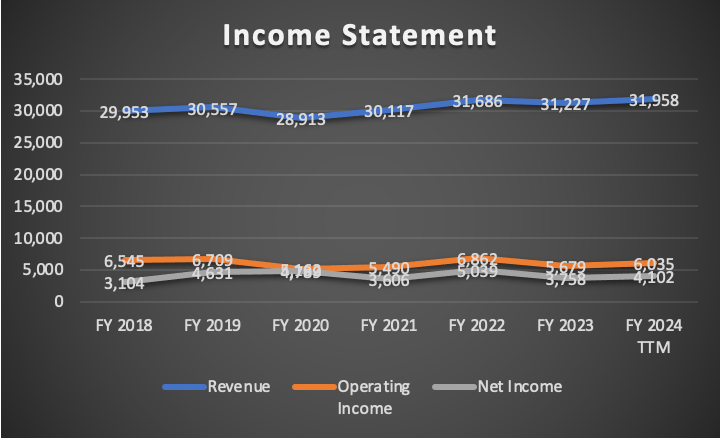
Margin indicators have also seen positive movements. In Q1 2024, both operating and net income margins on a TTM basis were 18.9% and 11.5%, respectively. As of the latest data, these margins have slightly improved, now standing at 18.88% and 12.84%, respectively.
While operating margin experienced a slight decline from its Q1 2024 TTM level of 18.9%, the net income margin has witnessed growth, progressing from 11.5% to 12.84% after the Q2 2024 release.
Author’s Calculations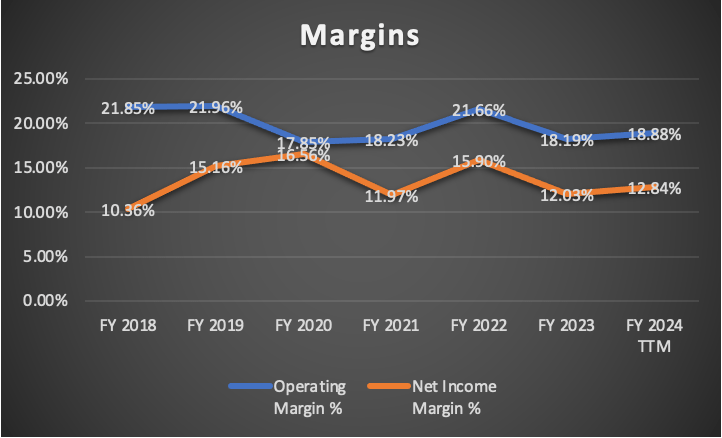
Examining the same period, it’s noteworthy that before Q2, long-term debt was recorded at $24.4 billion and has since reduced to $23.6 billion, indicating a 3.38% reduction. This achievement in debt reduction has had a minimal impact on cash reserves, as cash, which previously totaled $7.87 billion, now stands at $7.73 billion, reflecting a 1.81% reduction.
Author’s Calculations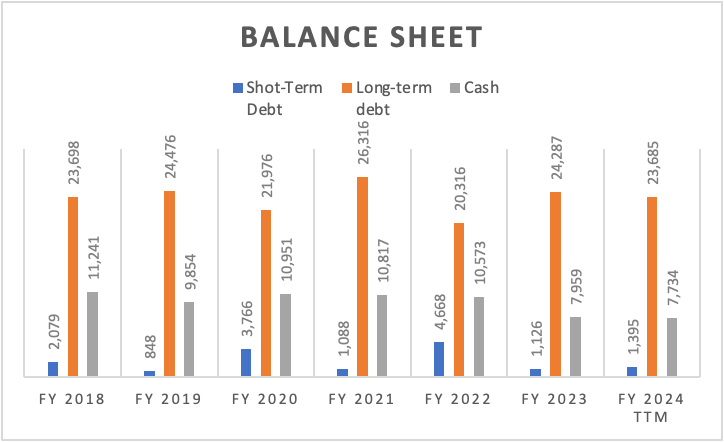
However, free cash flow has not yet recovered to its 2019 peak when the cash flow margin reached 27.2%. A closer look at the “Free Cash Flow Components” table reveals that this is primarily attributed to a reduction in cash from operations.
Returning to the performance of free cash flow before and after Q2, there has been a positive trend with a 6.94% increase, rising from $3.19 billion to $3.41 billion.
Author’s Calculations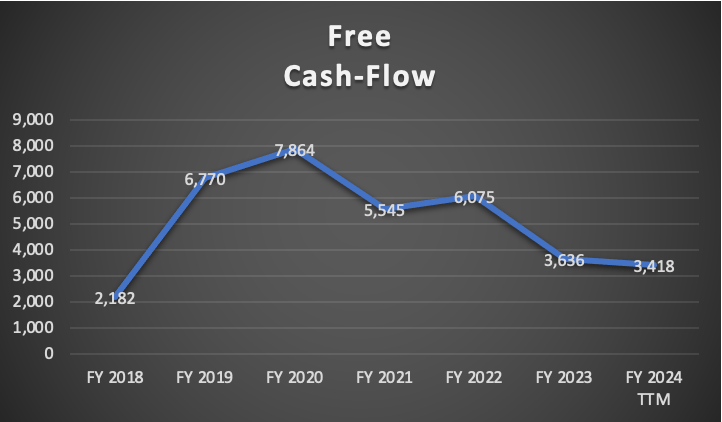
Author’s Calculations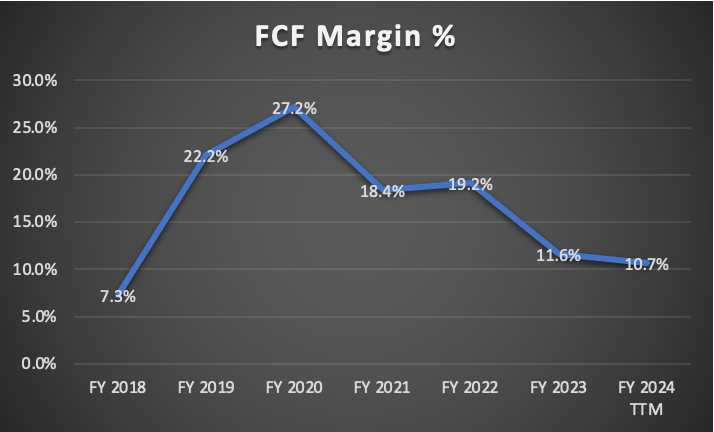
Author’s Calculations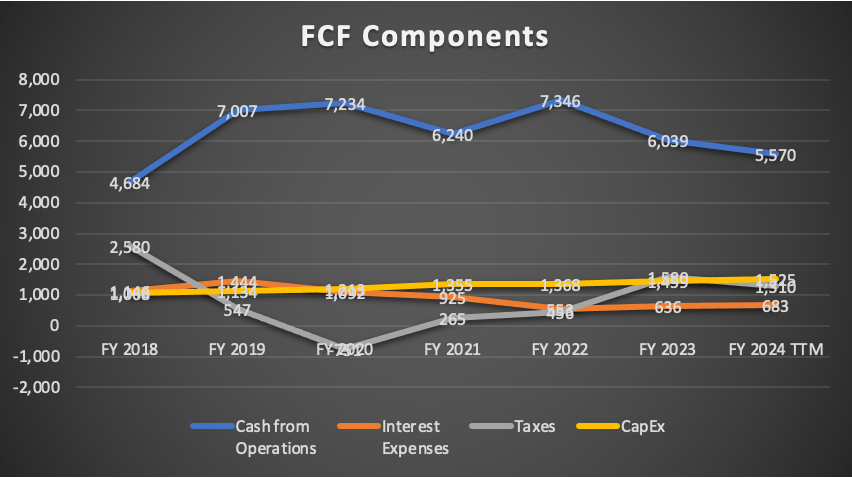
Valuation
In this valuation, I will conduct two DCF models to assess Medtronic’s intrinsic value. The first model incorporates Analysts’ estimates for revenue and EPS in FY2024 and FY2025, along with forward revenue growth and the 3 to 5-year long-term EPS growth rate.
The second DCF model is grounded in the anticipated market revenue projections for each of Medtronic’s operating segments.
The table provided contains all the current data relevant to Medtronic. Utilizing this data, I will compute the WACC by considering Equity value, Debt value, and Cost of debt. Furthermore, Depreciation and Amortization (D&A), Interest, and CapEx will be derived using margins tied to revenue growth. This approach ensures that as Medtronic’s revenue expands, these expenses will also increase, offering a more realistic and logical projection.
| TABLE OF ASSUMPTIONS | |
| (Current data) | |
| Assumptions Part 1 | |
| Equity Value | 51,460.00 |
| Debt Value | 25,080.00 |
| Cost of Debt | 2.72% |
| Tax Rate | 24.21% |
| 10y Treasury | 4.17% |
| Beta | 0.83 |
| Market Return | 10.50% |
| Cost of Equity | 9.42% |
| Assumptions Part 2 | |
| CapEx | 1,525.00 |
| Capex Margin | 4.77% |
| Net Income | 4,102.00 |
| Interest | 683.00 |
| Tax | 1,310.00 |
| D&A | 2,680.00 |
| Ebitda | 8,775.00 |
| D&A Margin | 8.39% |
| Interest Expense Margin | 2.14% |
| Revenue | 31,958.0 |
Analysts’ Estimates
In this initial valuation model, I am assessing Medtronic based on current analysts’ estimates for revenue, EPS, forward revenue growth, and the 3-5 year long-term EPS growth rate.
Starting with revenue, analysts anticipate Medtronic to achieve $32.09 billion for FY2024 and $33.51 billion for FY2025, translating to an annual revenue increase of 4.42%.
Seeking Alpha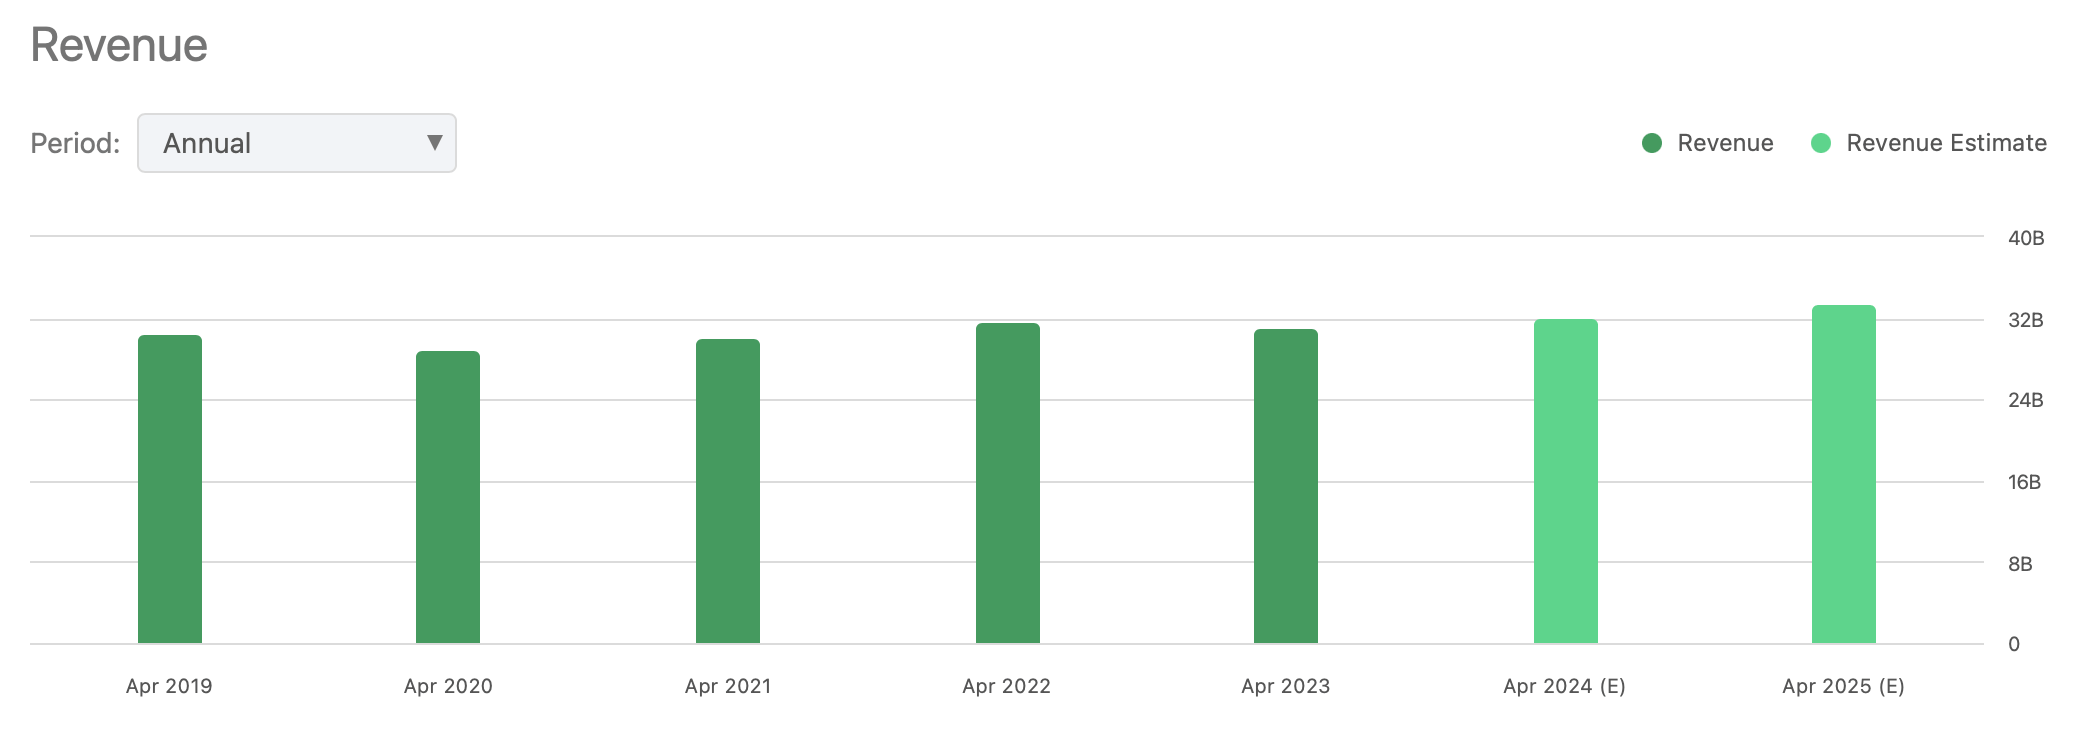
Moving on to EPS, analysts project an annual EPS of $5.16 for FY2024 and $5.45 for FY2025, equivalent to earnings of $6.86 billion and $7.24 billion, respectively.
Seeking Alpha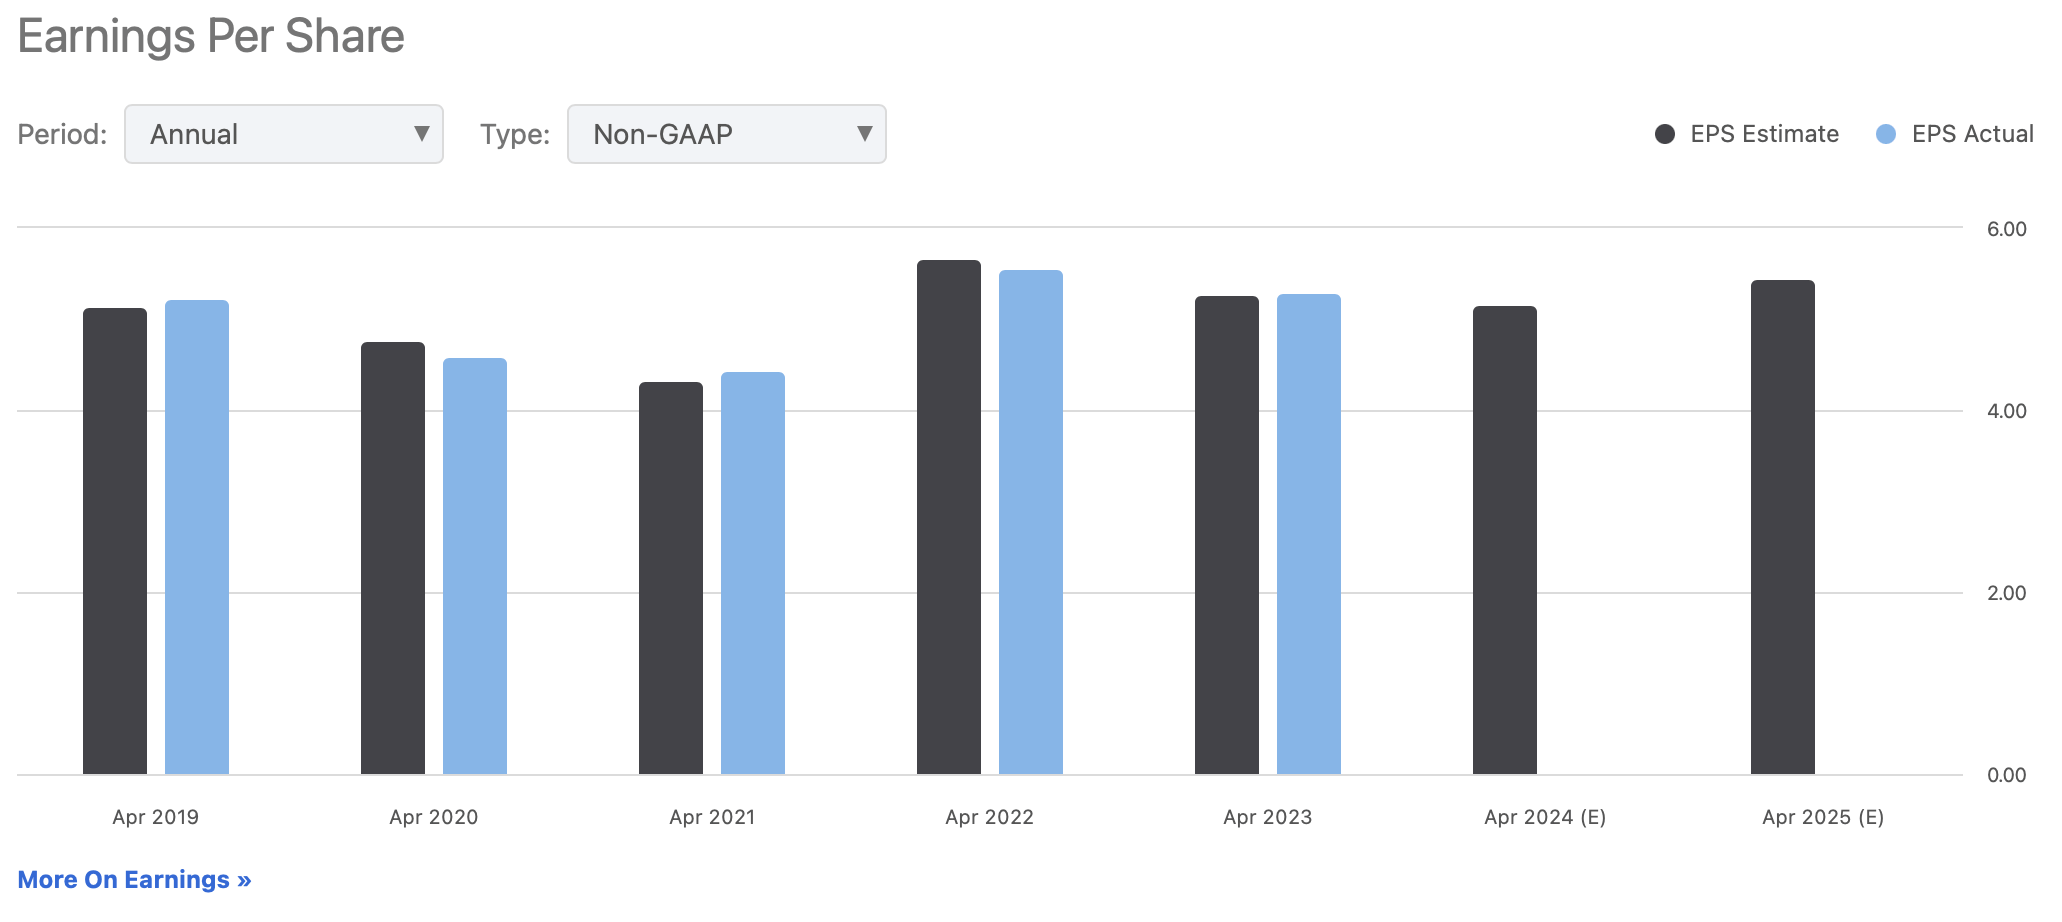
By referencing the “Growth” tab on Seeking Alpha for Medtronic’s stock ticker, analysts foresee a forward revenue growth of 1.88%. This estimate is applied to predict revenues from FY2026 to FY2029. Additionally, analysts project a 3-5 year long-term EPS growth rate of 4.43%, which is utilized to forecast net incomes for the mentioned years.
Seeking Alpha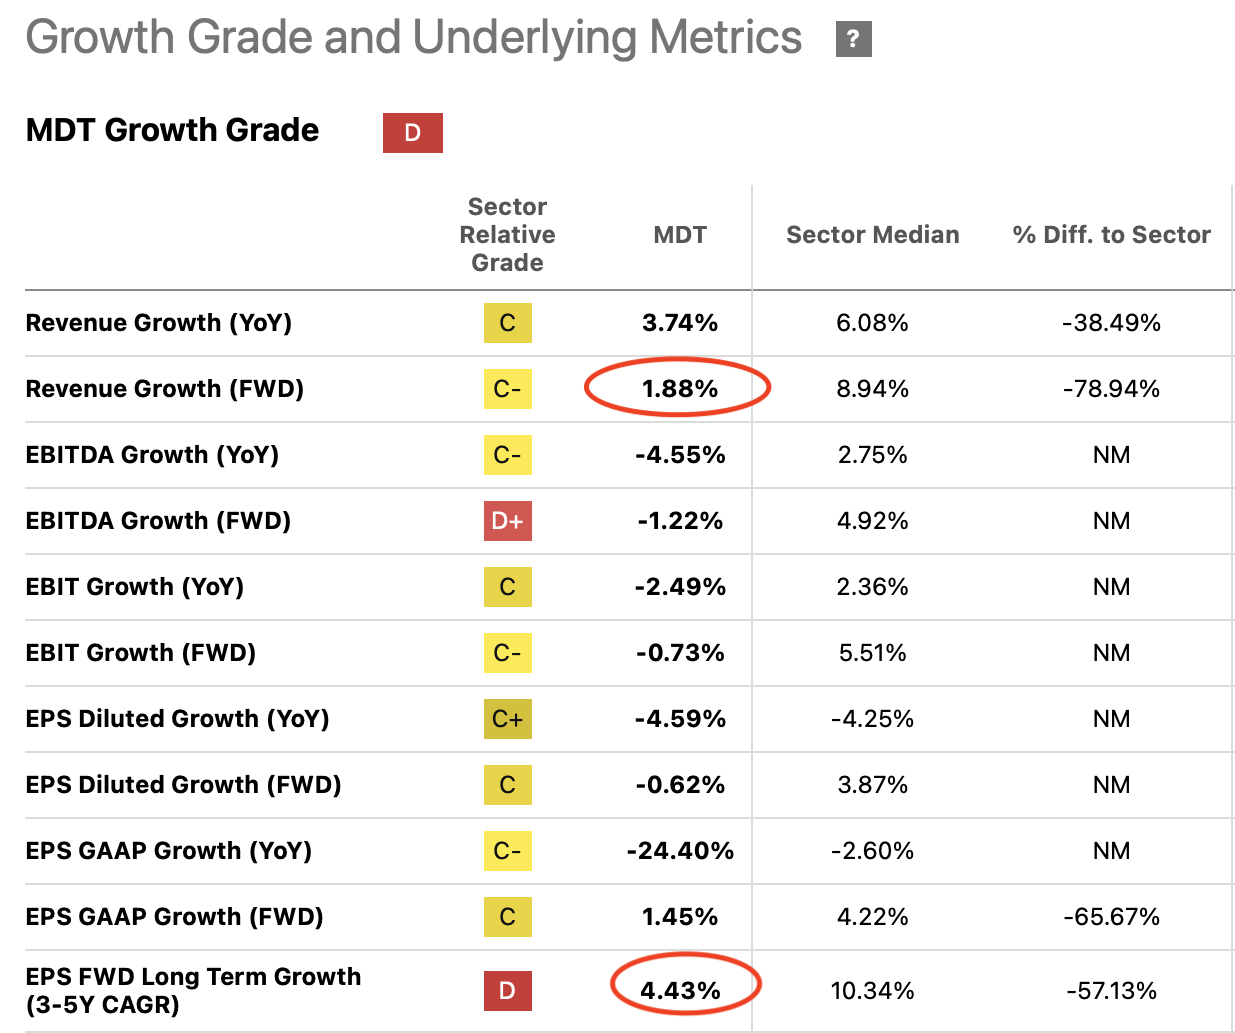
| (Analysts’ Estimates) | Revenue | Net Income | Plus Taxes | Plus D&A | Plus Interest |
| 2023 | $32,090.0 | $6,863.83 | $8,525.25 | $11,216.32 | $11,902.15 |
| 2024 | $33,510.0 | $7,249.59 | $9,004.39 | $11,695.46 | $12,381.28 |
| 2025 | $34,140.0 | $7,570.75 | $9,403.28 | $12,266.26 | $12,995.90 |
| 2026 | $34,781.8 | $7,906.13 | $9,819.85 | $12,736.65 | $13,480.00 |
| 2027 | $35,435.7 | $8,256.37 | $10,254.87 | $13,226.51 | $13,983.83 |
| 2028 | $36,101.9 | $8,622.13 | $10,709.16 | $13,736.67 | $14,508.23 |
| ^Final EBITA^ |
Author’s Calculations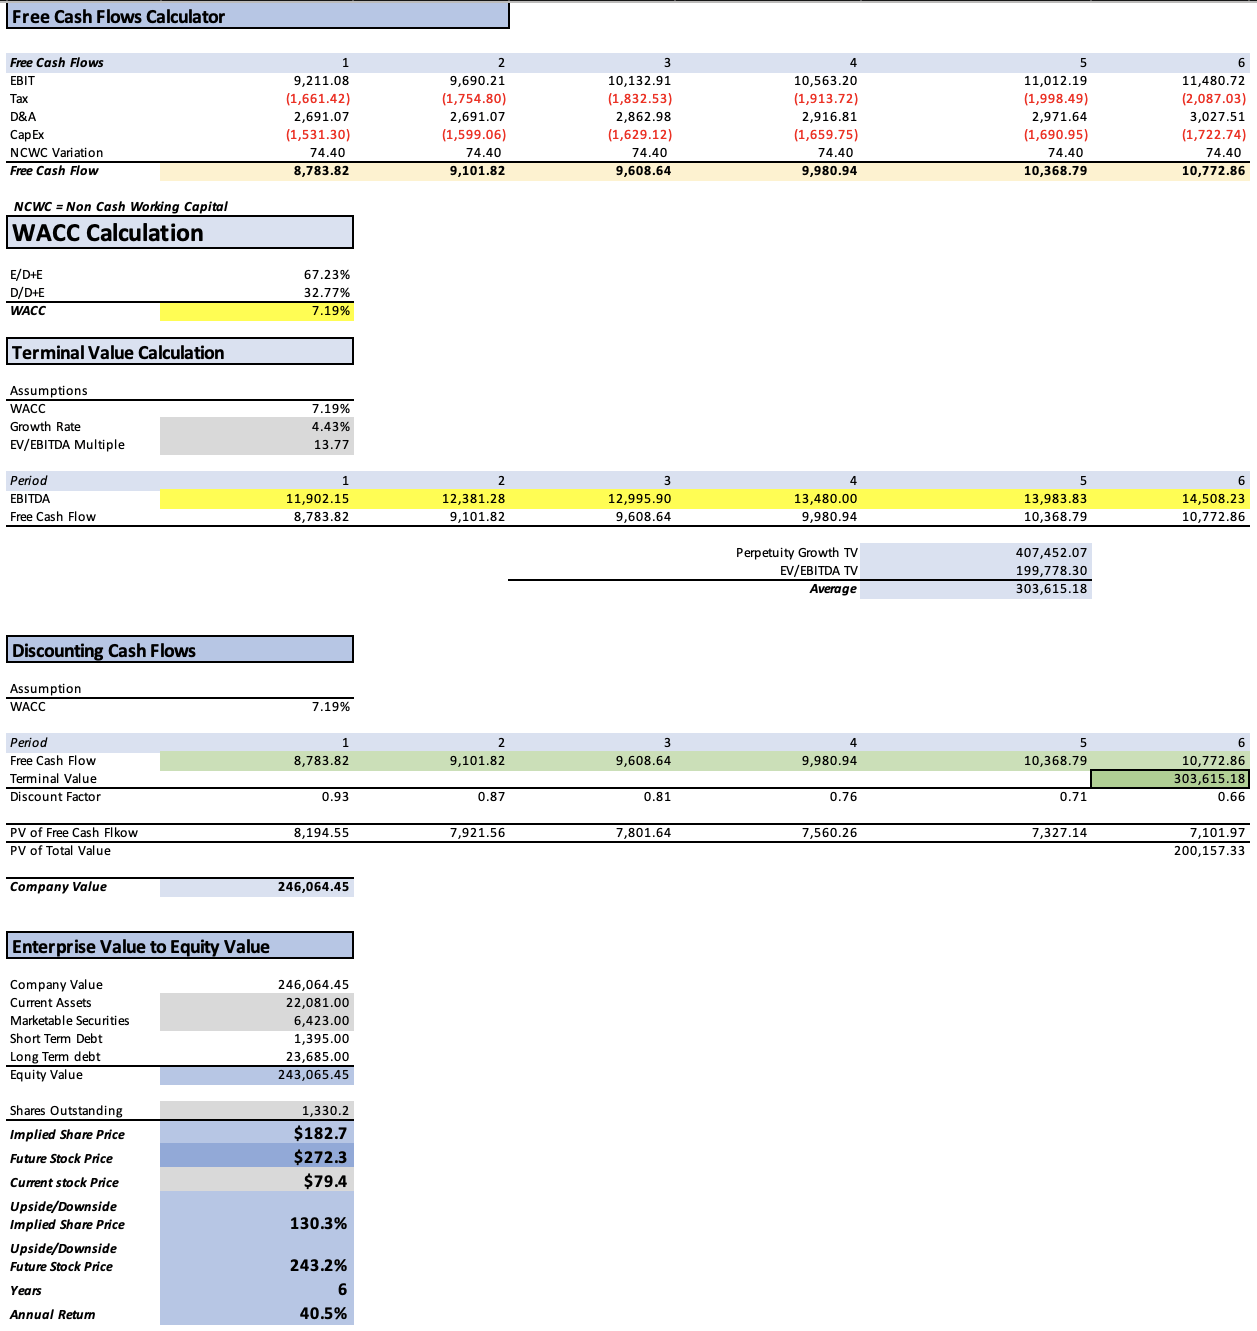
Upon completing the model, the result indicates a valuation of $182.70, reflecting a significant 130.3% upside from the current stock price of $79.40. Furthermore, the DCF analysis suggests that by 2028 (FY2029), the stock is expected to reach a price of $272.3, indicating an impressive upside of 243.2%. In other words, this implies an annual return of 40.5% over a six-year period.
My Estimates
In this second model, my objective is to predict revenues for each segment by leveraging the growth rates of the respective markets in which those segments operate.
Starting with the segmentation breakdown, Cardiovascular emerges as the most substantial segment, constituting 36.6% of total revenues. Following closely is Medical Surgical, contributing 28.65%, succeeded by Neuroscience at 26.82%, and Diabetes, which, among the major segments, provides the least at 7.64%. The “other” segment, being comparatively small, is omitted from consideration.
Segments (Medtronic FQ2 2024)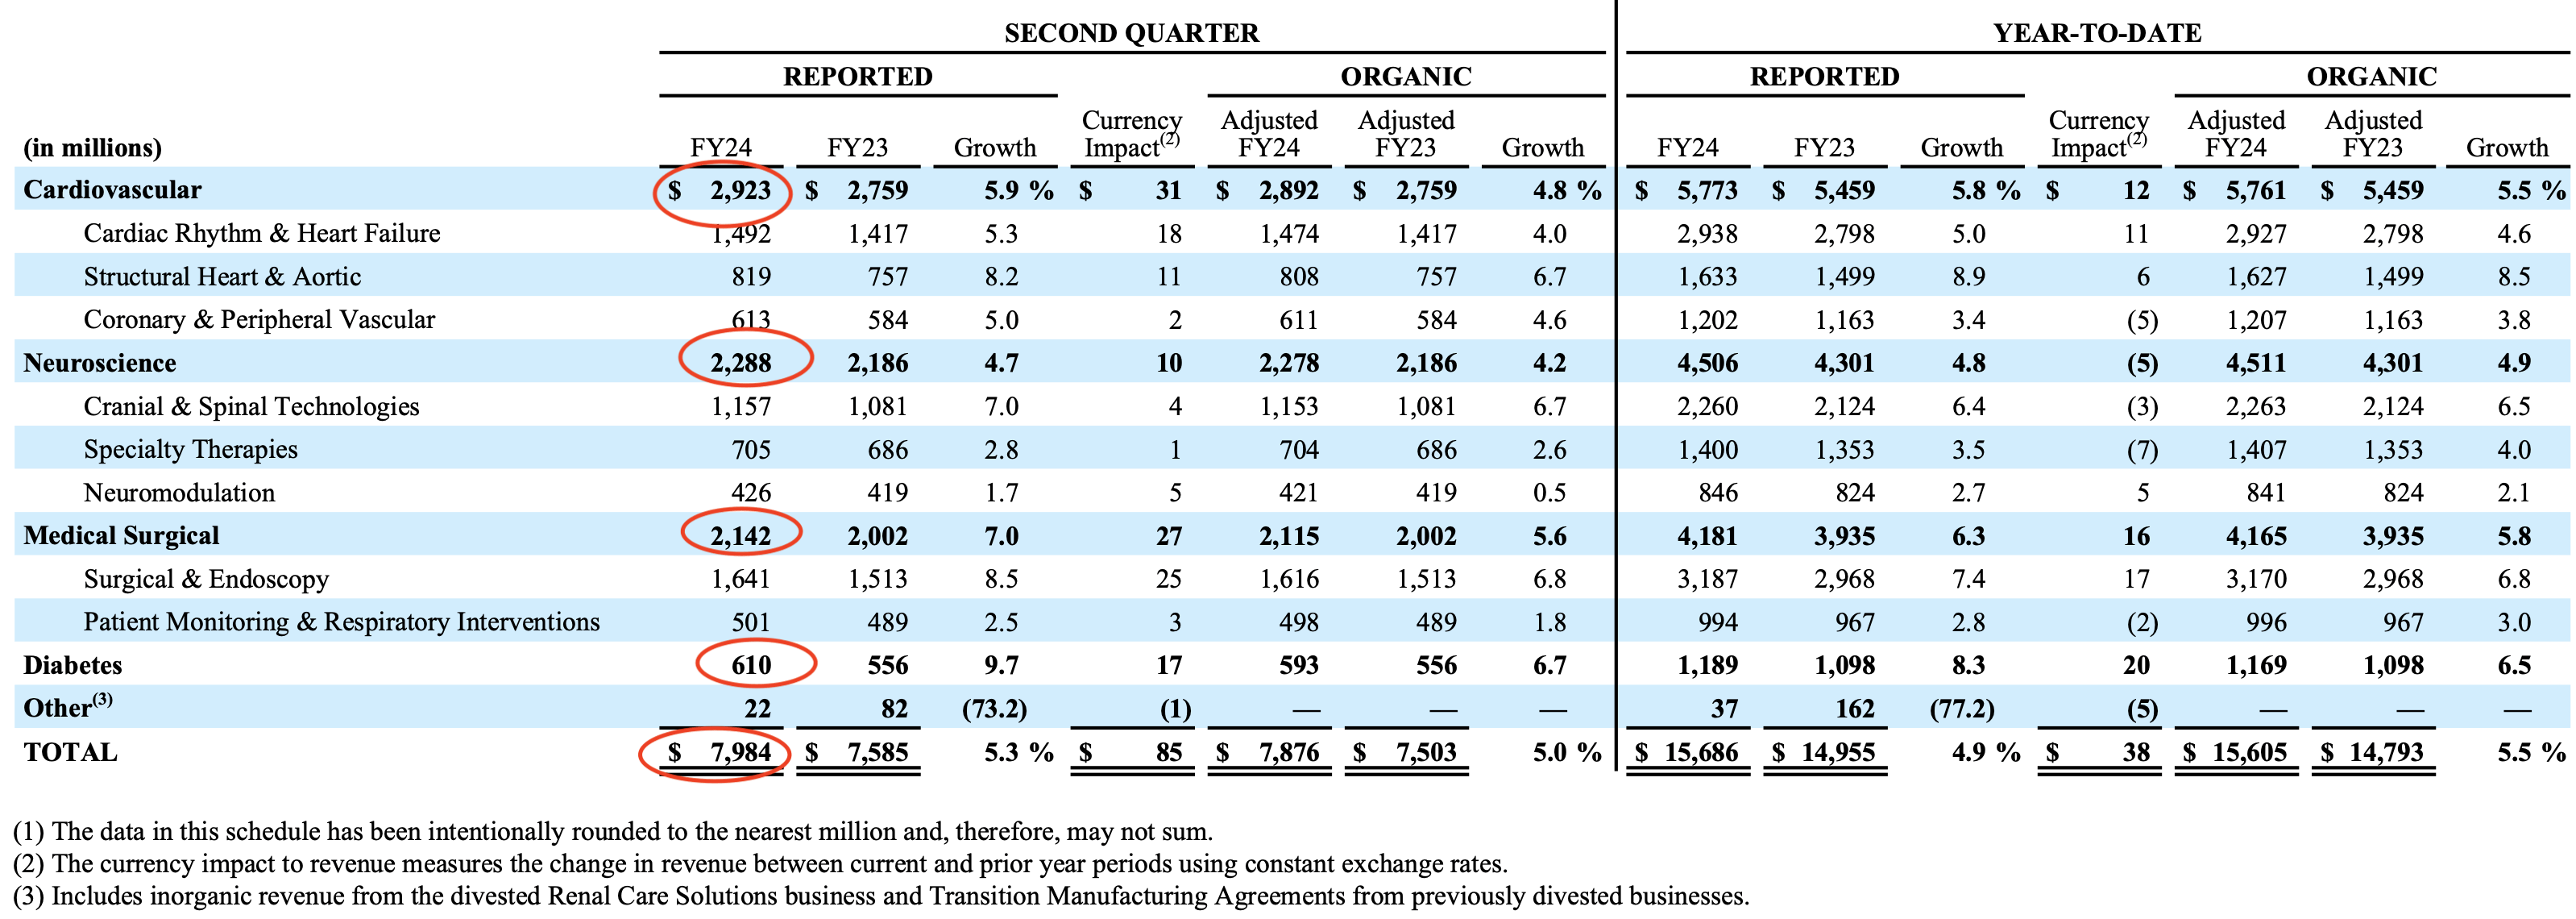
Referring to the growth rates specified in the “Market” subsection of the “Overview” section, the cardiovascular devices market is anticipated to grow at a rate of 7.9%, Medical Surgical at 9.4%, Neuroscience at 5.9%, and Diabetes Devices at a rate of 9.8%, all projected through 2028.
| Cardiovascular | Medical Surgical | Neuroscience | Diabetes | |
| FY 2018 | 11,696.6 | 9,156.0 | 8,571.1 | 2,441.6 |
| FY 2019 | 12,620.7 | 10,016.6 | 8,061.2 | 2,680.9 |
| FY 2020 | 13,617.7 | 10,958.2 | 7,581.5 | 2,943.6 |
| FY 2021 | 14,693.5 | 11,988.3 | 7,130.4 | 3,232.1 |
| FY 2022 | 15,854.3 | 13,115.2 | 6,706.2 | 3,548.8 |
| FY 2023 | 17,106.8 | 14,348.0 | 6,307.1 | 3,896.6 |
| FY 2024 TTM | 36.60% | 28.65% | 26.82% | 7.64% |
To finalize the model, a net income margin for the projection is established, utilizing the average net income margin recorded from FY2018 to FY2024, which stands at 13.55%.
Upon examination of the table, it’s evident that this approach is more conservative than analysts’ expectations. For easier comparison, the previous table is included below.
| (My Estimates) | Revenue | Net Income | Plus Taxes | Plus D&A | Plus Interest |
| FY 2024 | $31,865.3 | $4,317.75 | $5,362.88 | $8,035.11 | $8,716.13 |
| FY 2025 | $33,379.3 | $4,522.90 | $5,617.68 | $8,289.91 | $8,970.93 |
| FY 2026 | $35,101.0 | $4,756.18 | $5,907.44 | $8,851.01 | $9,601.18 |
| FY 2027 | $37,044.2 | $5,019.49 | $6,234.49 | $9,341.02 | $10,132.72 |
| FY 2028 | $39,224.4 | $5,314.91 | $6,601.40 | $9,890.76 | $10,729.06 |
| FY 2029 | $41,658.5 | $5,644.72 | $7,011.06 | $10,504.54 | $11,394.85 |
| ^Final EBITA^ |
| (Analysts’ Estimates) | Revenue | Net Income | Plus Taxes | Plus D&A | Plus Interest |
| 2023 | $32,090.0 | $6,863.83 | $8,525.25 | $11,216.32 | $11,902.15 |
| 2024 | $33,510.0 | $7,249.59 | $9,004.39 | $11,695.46 | $12,381.28 |
| 2025 | $34,140.0 | $7,570.75 | $9,403.28 | $12,266.26 | $12,995.90 |
| 2026 | $34,781.8 | $7,906.13 | $9,819.85 | $12,736.65 | $13,480.00 |
| 2027 | $35,435.7 | $8,256.37 | $10,254.87 | $13,226.51 | $13,983.83 |
| 2028 | $36,101.9 | $8,622.13 | $10,709.16 | $13,736.67 | $14,508.23 |
| ^Final EBITA^ |
Author’s Calculations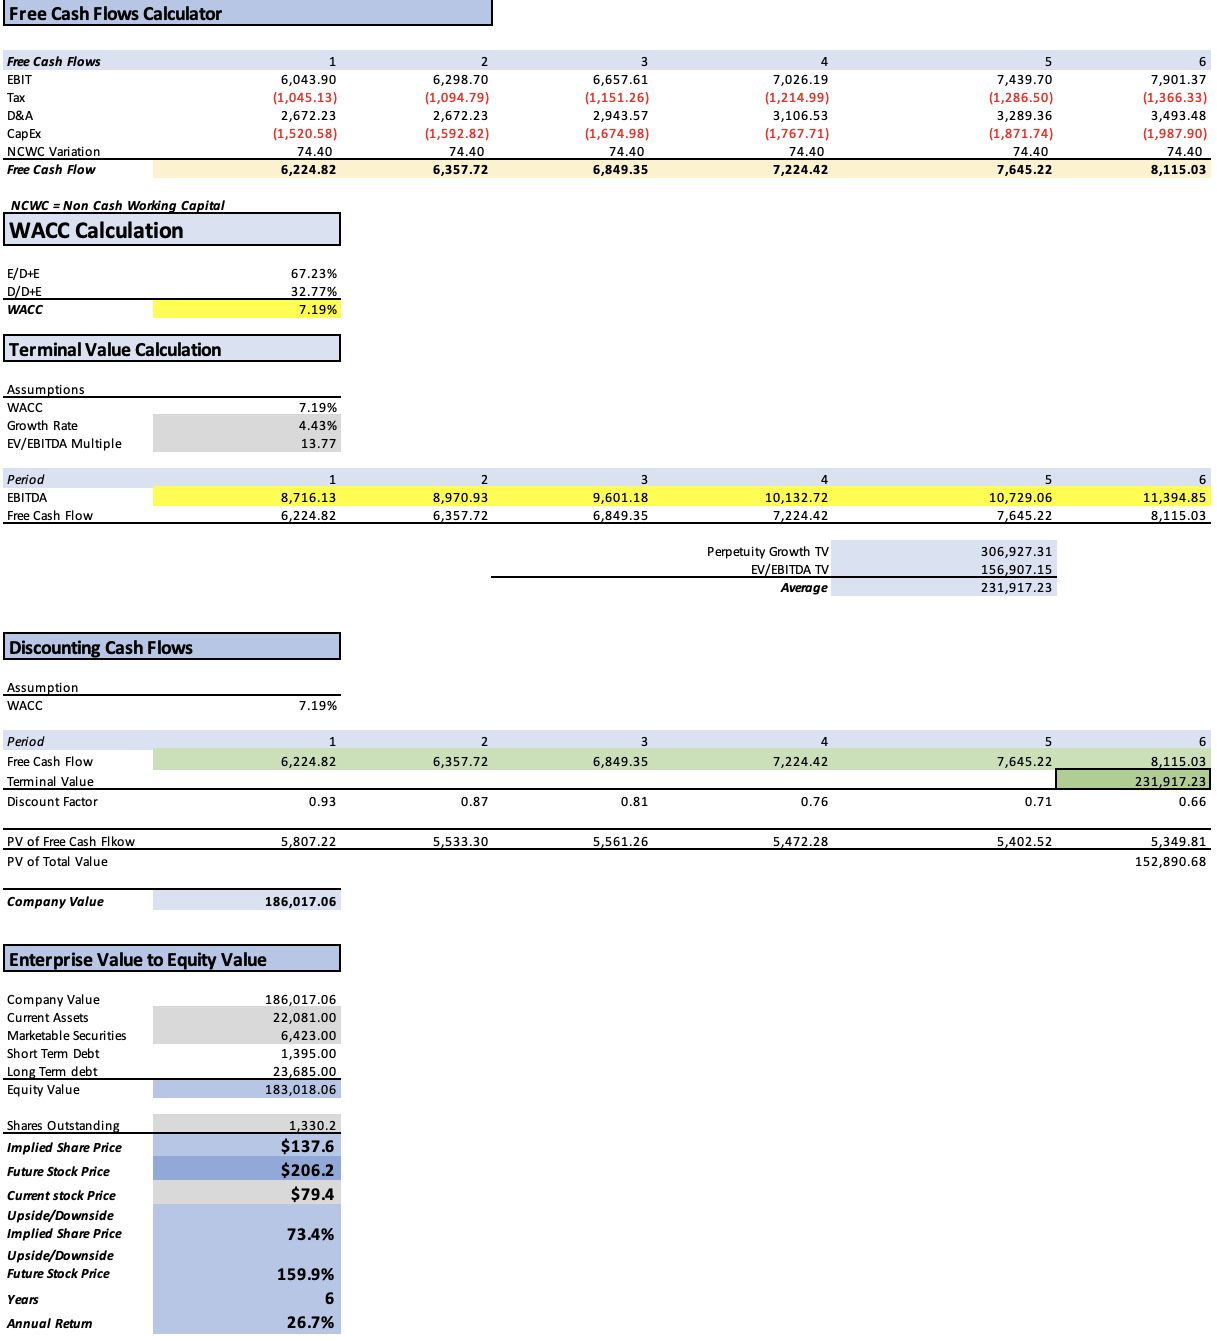
Ultimately, this conservative scenario translates into a stock price target of $137.6, accompanied by a future value projection of $206.2, indicating a compelling annual return of 26.7%.
Riks to Thesis
The primary risk to my optimistic (but still more conservative than analysts’) outlook lies in the inherent nature of medical device companies, including Medtronic, which heavily depend on innovation and the approval of new products. This approval process can vary from as little as a week to as long as eight months. Falling behind competitors and failing to catch up in this dynamic environment could potentially seal Medtronic’s fate.
Moreover, a broader challenge within the healthcare system, spanning from drugs to devices, introduces an additional layer of risk. President Biden’s recent announcement expressing a willingness to exercise executive power to seize drug patents, with the aim of reducing medication costs, raises concerns. A similar scenario could unfold for medical devices, initiating an inevitable price war. However, the downside of this approach might include hindering the innovation of new drugs and devices. In such a hypothetical situation, only large corporations might survive, potentially catalyzing mega-mergers within the healthcare sector, reminiscent of historical events in other regulated industries, such as railway companies facing heavy taxes and regulations.
Lastly, Medtronic’s active pursuit of a cost-cutting strategy, with a specific emphasis on divesting certain assets, introduces another dimension of risk. As articulated by the CEO, this approach is projected to yield savings amounting to $1 billion by the year 2025. The significance of achieving this goal is underscored by the fact that, given Medtronic’s unlikely prospect of offering 20%+ revenue growth in the near future, creating value through improved free cash flow becomes vital.
Conclusion
In conclusion, my comprehensive analysis of Medtronic, taking into account various financial models and potential risks, underscores a robust investment case. Utilizing analysts’ estimates and a market-based segmentation approach, the first model predicts a substantial 130.3% upside from the current stock price of $79.40, with a future value projection reaching $272.3 by 2028, implying an exceptional annual return of 40.5% over six years. The second model (which are my estimates and therefore the final stock target price), adopting a conservative stance and predicting segment revenues based on market growth rates, yields a more moderate stock price target of $137.6, accompanied by a future value projection of $206.2, translating to a compelling annual return of 26.7%. Both scenarios, despite their differences, converge on a “Strong Buy” recommendation for Medtronic, aligning with the company’s proactive cost-cutting strategy and resilient financial performance.
Analyst’s Disclosure: I/we have no stock, option or similar derivative position in any of the companies mentioned, but may initiate a beneficial Long position through a purchase of the stock, or the purchase of call options or similar derivatives in MDT over the next 72 hours. I wrote this article myself, and it expresses my own opinions. I am not receiving compensation for it (other than from Seeking Alpha). I have no business relationship with any company whose stock is mentioned in this article.
Seeking Alpha’s Disclosure: Past performance is no guarantee of future results. No recommendation or advice is being given as to whether any investment is suitable for a particular investor. Any views or opinions expressed above may not reflect those of Seeking Alpha as a whole. Seeking Alpha is not a licensed securities dealer, broker or US investment adviser or investment bank. Our analysts are third party authors that include both professional investors and individual investors who may not be licensed or certified by any institute or regulatory body.