Summary:
- MDT, a member of the S&P Dividend Aristocrats index, recently provided weak guidance which dampens its low-dividend cover even more.
- We still appreciate some of the other dividend sub-plots.
- We shed some insight into the technical and valuation developments.
kynny
An Admirable Dividend History, But Is This At Risk Of Turning Sour?
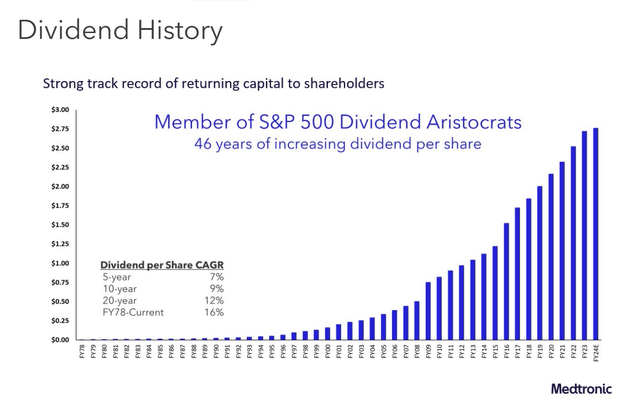
The medical-tech firm- Medtronic, boasts of some pretty impressive credentials when it comes to the dividend facet. The firm is currently part of the S&P Dividend Aristocrats ETF (NOBL) which seeks out businesses that have paid and grown their dividends for at least 25 years; Medtronic (NYSE:MDT) comfortably trounces this requirement, as it has been paying and growing its dividends for 46 years, at an impressive enough CAGR of 16%!
The image below gives you a sense of the difference these dividends make in bumping up the total return by 1.67x relative to the price returns since its listing date.
YCharts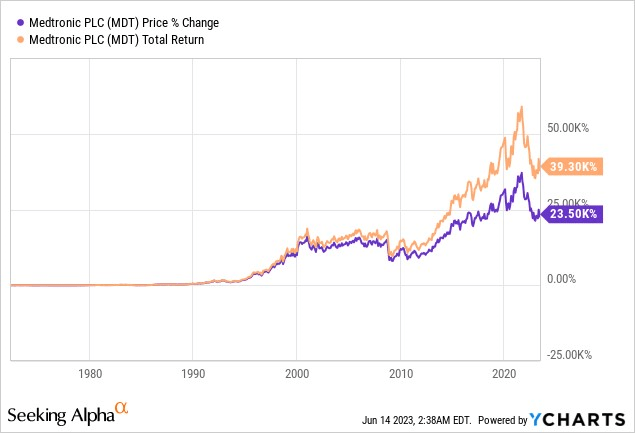
Towards the end of last month, Medtronic came out with FY results (it follows an April year-ending calendar); whilst the company managed to beat street estimates on the topline and the bottom line, the market was not best pleased with the guidance provided where inflation and FX were likely to leave an adverse mark on forward bottom line numbers; in effect, the sell-side cohort had to trim their FY24 non-GAAP EPS estimates from $5.2, down to levels of $5.06 (this is slightly higher than the mid-point of management’s guidance of $5-$5.1). All in all, if things go to plan, we would see YoY earnings declines for the second successive year (implied de-growth of -4.5% for FY24).
Prima facie, a decline in the earnings trajectory won’t reflect well on MDT’s already low dividend cover. Note that relative to some of the other biggest dividend-paying medical equipment stocks, the likes of Thermo Fisher (TMO), Becton, Dickinson (BDX), Stryker Corp (SYK), and Abbott Labs (ABT), MDT’s dividend cover is already the weakest, at a little over 1x!
YCharts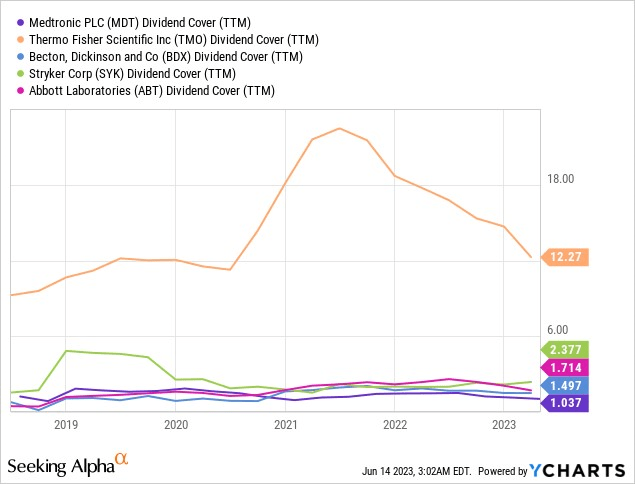
In light of these developments, a fair few may have some doubts over the sustainability of MDT’s dividend.
The Dividend Is Still In A Good Place
If you’re worried about the dividend sustainability, we’ll seek to assuage those fears because we think the foundation of those dividends are still in good shape. Also, more than the dividend cover, we believe investors should pay attention to the cash dividend payout ratio.; this is so because, the dividend cover tends to be skewed by a lot of non-cash items and won’t necessarily give you an accurate picture of the financial health.
What investors also need to know is that quite unlike a lot of other firms that have arbitrary and lopsided dividend policies, MDT’s dividend policy is quite emphatic. In fact management has listed this down in their 10-K, highlighting a commitment to return a minimum of 50% of FCF via distributions, with precedence given to dividends over buybacks.
YCharts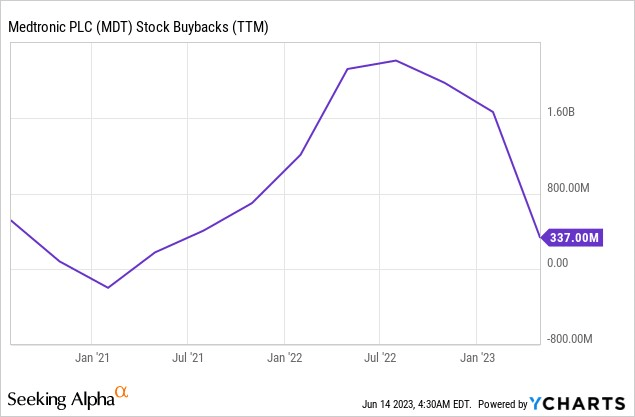
In recent periods we’ve already seen MDT management tone down the level of buybacks, and this is something they can always curtail if they believe FCF generation could be hamstrung. Speaking of FCF generation, it looks anything but hamstrung off late. Note that in the recent quarter, MDT did very well in curtailing its cash conversion cycle (the number of days cash is tied up in working capital initiatives), and this resulted in the FCF hitting its highest point in 3 years.
Meanwhile, the image below gives you a sense of MDT’s cash dividend payout ratio (measured as dividend payments as a function of FCF) over time. Post pandemic, MDT’s ratio has hovered around the 60% mark and in recent periods it has inched closer to 80% highlighting solid coverage. Amongst the large med-tech peers, only BDX offers a higher cash dividend payout ratio.
YCharts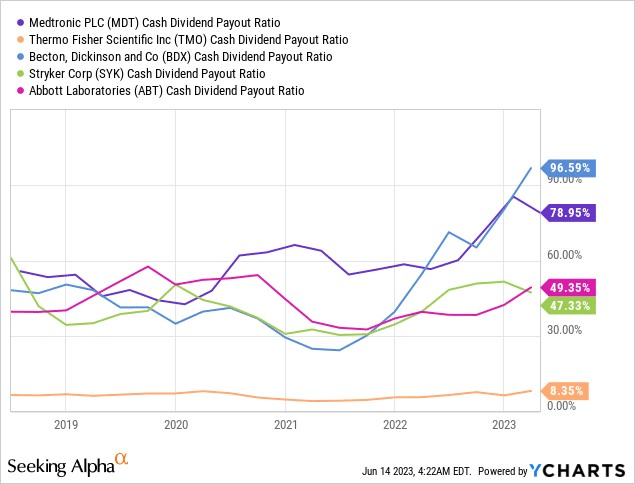
Looking ahead, it appears that MDT wants to dial down on its organic R&D initiatives (R&D to grow above revenue), and there’s the risk of this sucking up a greater chunk of operating cash flow, but investors should note that the company is also doing a great job with excess cash savings, which could make a more pronounced contribution to the R&D objectives. Even though management has not quantified the level of cost savings they have stated that headwinds related to inflation, FX, interest and tax would normally have resulted in a double-digit decline in the FY24 eps but because of the threshold of cost savings, the expected decline will likely only be in mid-single digits.
We also recognize that some investors may not have been too happy with MDT’s recent hike in its dividends, which only came in at a miserly rate of ~2%. This is understandable given that the 5-year and 10-year CAGR in dividend growth has been a lot higher at 7% and 9% respectively. However, I believe management may have decided to be a tad conservative with the near-term dividend growth, since the NewCo sale is yet to come to fruition, and funds will also be required to close the acquisition of EOFlow.
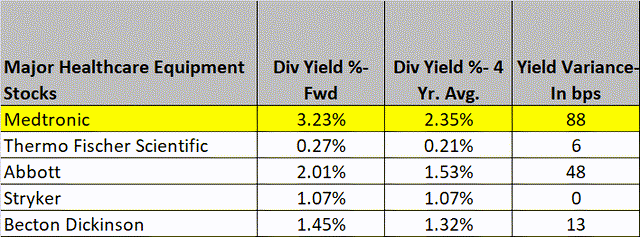
But even if you aren’t happy with the recent dividend growth, it’s worth noting that MDT still offers the highest yield amongst the large med tech peers; besides that, the variance in the yield relative to the 4-year average is also the widest at 88bps.
Closing Thoughts – Valuation And Technical Narratives
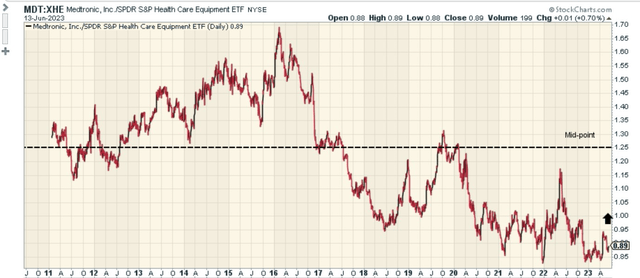
With regards to some of the other facets of MDT, it’s worth noting that MDT currently appears to be a promising candidate for a mean-reversion trade; compared to the equally weighted medical equipment ETF; the image below highlights how MDT’s relative strength ratio is currently around ~30% off the mid-point of its long-term range.
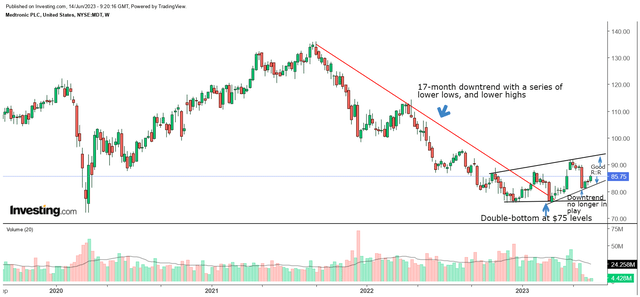
Meanwhile on MDT’s own weekly chart, we can see that the long-standing downtrend which kicked off in Sep 2021, is no longer in play. After a series of lower-lows, and lower-highs, MDT appears to have built some support at the $75 levels. It’s encouraging to note that the stock did not make a third attempt to retest the $75 levels but has rather showed signs of commencing a period of higher-highs and higher lows. For now, the price action appears to be moving in the shape of a wedge pattern, and if one were to step in at this juncture, and trade the two lines of the wedge, the risk-reward is in your favor.
Finally, the valuation picture of MDT too looks quite supportive.
For context, there have been 26 downward revisions to the FY24 EPS number, and this would normally make the forward valuation multiple seem pricey. However, at 17x forward P/E (based on the FY24 EPS of $5.06), the stock still comes in at an 8% discount relative to its long-term average. MDT stock is a Buy.
YCharts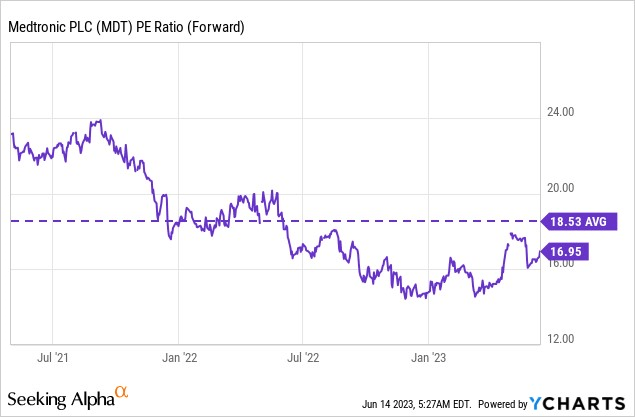
Analyst’s Disclosure: I/we have no stock, option or similar derivative position in any of the companies mentioned, and no plans to initiate any such positions within the next 72 hours. I wrote this article myself, and it expresses my own opinions. I am not receiving compensation for it (other than from Seeking Alpha). I have no business relationship with any company whose stock is mentioned in this article.
Seeking Alpha’s Disclosure: Past performance is no guarantee of future results. No recommendation or advice is being given as to whether any investment is suitable for a particular investor. Any views or opinions expressed above may not reflect those of Seeking Alpha as a whole. Seeking Alpha is not a licensed securities dealer, broker or US investment adviser or investment bank. Our analysts are third party authors that include both professional investors and individual investors who may not be licensed or certified by any institute or regulatory body.

