
Summary:
- Medtronic’s fair price estimate is $142.20, indicating a 73.3% upside from $82.07, with potential annual returns of 28.8% through 2029.
- FQ4 2024 earnings exceeded expectations with an EPS of $1.46 and revenue of $8.59 billion.
- Medtronic focuses on innovation through AI, data analytics, and new partnerships, enhancing competitiveness and product offerings.
- Leading the medical devices market with a 15.59% share, Medtronic is set for growth in cardiovascular, medical-surgical, neuroscience, and diabetes segments.
- Despite geopolitical risks, Medtronic’s 3.24% dividend yield, and its huge safety margin support a “strong-buy” rating.
JHVEPhoto
Thesis
In my previous article about Medtronic plc (NYSE:MDT), I rated the stock as a Strong buy, since my estimates (which were lower than the average consensus) already estimated an upside of 46.9% and annual returns of 21.2% throughout 2029. My fair price estimate was $126.09 and my future price for 2029 was $194.88.
Medtronic released Q4 2024 earnings on May 23. The company reported a non-GAAP EPS of $1.46 which beat EPS estimates by 0.68%, and a revenue of $8.59B which beat the consensus by 1.77%.
After evaluating the stock, I arrived at a present fair price estimate of $142.20, which represents a 73.3% from the current stock price of $82.07, and a future price for the year 2029 of $223.94, which translates into 28.8% annual returns throughout 2029.
Overview
Growth Plan
Medtronic’s strategy is to keep innovating and leveraging its product range. To do this, Medtronic listens to patients, creates new partnerships, and simplifies customer experience (according to them).
Medtronic has also implemented AI and data analytics to deliver real-time therapy customization and remote care. This is evidenced in Medtronic’s GI Genius Intelligent endoscopy module, which uses AI to identify colorectal polyps. This helps to identify colorectal cancer faster, therefore, increasing the odds of surviving.
Additionally, they are also focused on cost-cutting. An example of this is that in 2021 they simplified their organizational structure to improve decision-making and execution. Which overall increased their competitiveness.
How does Medtronic Compare Against Peers?
Medtronic is the largest player by market share in the medical devices market, controlling 15.59% of the market. In second place it’s Johnson & Johnson (JNJ) with 14.64%, and then in third place, it’s Danaher Corporation (DHR) with a 11.43% market share.
Nevertheless, other companies control 33.63% of the market. These small companies are a clear target for M&As by the biggest companies, such as Medtronic or J&J. This demonstrates that Medtronic can outperform its market.
Author’s Calculations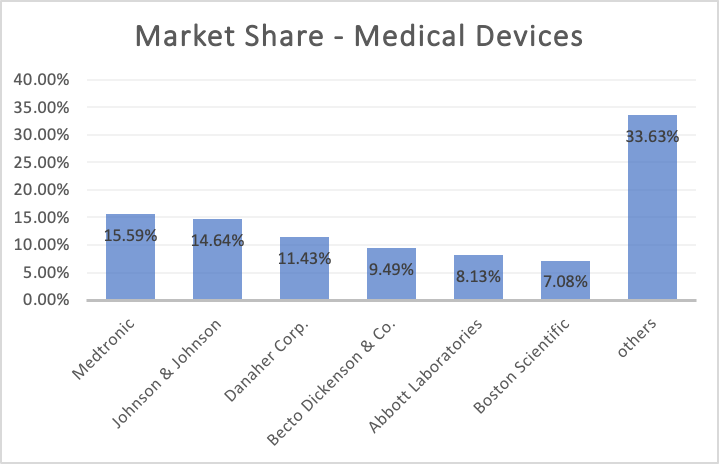
Industry Outlook and Addressable Market
Medtronic is divided into 4 different segments: cardiovascular, medical-surgical, neuroscience, and Diabetes. However, each segment is divided into smaller parts, which brings a subtotal of 12 subsegments.
Starting with cardiovascular, this segment divides into cardiac rhythm & Heart failure, through which Medtronic offers CRT devices. These devices’ main function is to send small electrical shocks to both chambers of the heart to help it beat in a synchronized way. The Cardiac rhythm management Devices market is expected to grow at a 5.00% CAGR throughout 2032. In 2023, the market size was estimated at $17.7B, and it’s expected to be $24.92B by 2030.
Then it’s structural heart & aortic, where Medtronic sells devices aimed at therapies such as coronary artery bypass graftings, heart valve repair & replacements, atrial fibrillation surgeries, and cardiopulmonary support. The worldwide structural heart devices market is valued at $6.91B as of 2023, and it’s expected to grow up to $12.89B, showcasing a CAGR of 9.30%.
The third subsegment of the cardiovascular segment is the Coronary & Peripheral Vascular, through which Medtronic offers products dedicated to the treatment of peripheral arterial and venous diseases. Peripheral artery disease is a condition in which arteries become narrower, usually, it’s more common in the legs. The worldwide Peripheral Vascular Devices Market is expected to surpass $9.75B in 2023 to $14.7B in 2030, displaying an annual growth rate of 6.10%.
Then it’s the medical surgical segment, which is divided into two subsegments, which are Acute Care & Monitoring (which previously was labeled as respiratory, gastrointestinal & renal), and Surgical & Endoscopy. The first one is divided into three smaller segments. The first is respiratory devices, through which Medtronic offers ventilators, portable ventilators, and filters. The worldwide respiratory devices market is expected to reach a size of $26.73B for 2024 and $39.9B for 2029, which translates into a 5.89% annual CAGR.
Then it’s the gastrointestinal devices subsegment. Medtronic’s main offerings include PillCam (for capsule endoscopy), reflux testing systems, radiofrequency ablation systems, and endoscopic ultrasound. The gastrointestinal therapeutics market was valued at $38.73B in 2023, and it’s expected to grow to $48.62B for 2030, showcasing a 3.30% CAGR throughout 2023-2030.
Lastly, it’s the renal devices subsegment, which includes offerings such as dialyzers and cardio-renal dialysis emergency machines. The Worldwide Nephrology and Urology Devices Market was valued at around $5.95B at the end of 2023, and it’s expected to reach $9.48B in 2030, reflecting a 6.9% CAGR throughout that period.
Then, as its name suggests, Surgical & Endoscopy (which was previously labeled as “surgical innovation”) is where Medtronic offers endoscopy devices. The endoscopy devices market was valued at $54.2B at the end of 2023, and it’s expected to grow at a CAGR of 7.5% throughout 2030, a year at which the market size should increase to $90.25B.
The third segment that is divided into smaller ones is neuroscience. The first subsegment is cranial & spinal technologies, whose main offering is the AiBLE surgical suite. A surgical suite is a group of rooms and facilities (such as recovery and operating) used for carrying out surgeries. The market of this subsegment is estimated to grow at a CAGR of 5.40%, which means that the market size will increase from $13.3B in 2023 to $19.21B in 2030.
Then there is the neuromodulation subsegment. The worldwide neuromodulation devices market is expected to grow at a rate of 9.50% until it reaches an estimated size of $7.2B for 2030 from its estimated 2023 size of $3.82B.
Finally, there are the diabetics segments in which Medtronic’s main offerings are insulin pumps (and patches), and glucose level monitoring systems. The Worldwide Diabetes Devices Market is expected to grow at a 9.34% rate until it reaches an estimated size of $50.12B in 2030 from its current size of $30.3B as of 2023.
In the table below, you can see the current and future addressable market for each of the business segments. Subsegments of the same color mean that they appear in the same business segment. Medtronic’s current TAM comes out at $207.64B and the future TAM at $317.42B. This means that throughout 2024-2030, the TAM will grow at a CAGR of 7.55%.
Author’s Calculations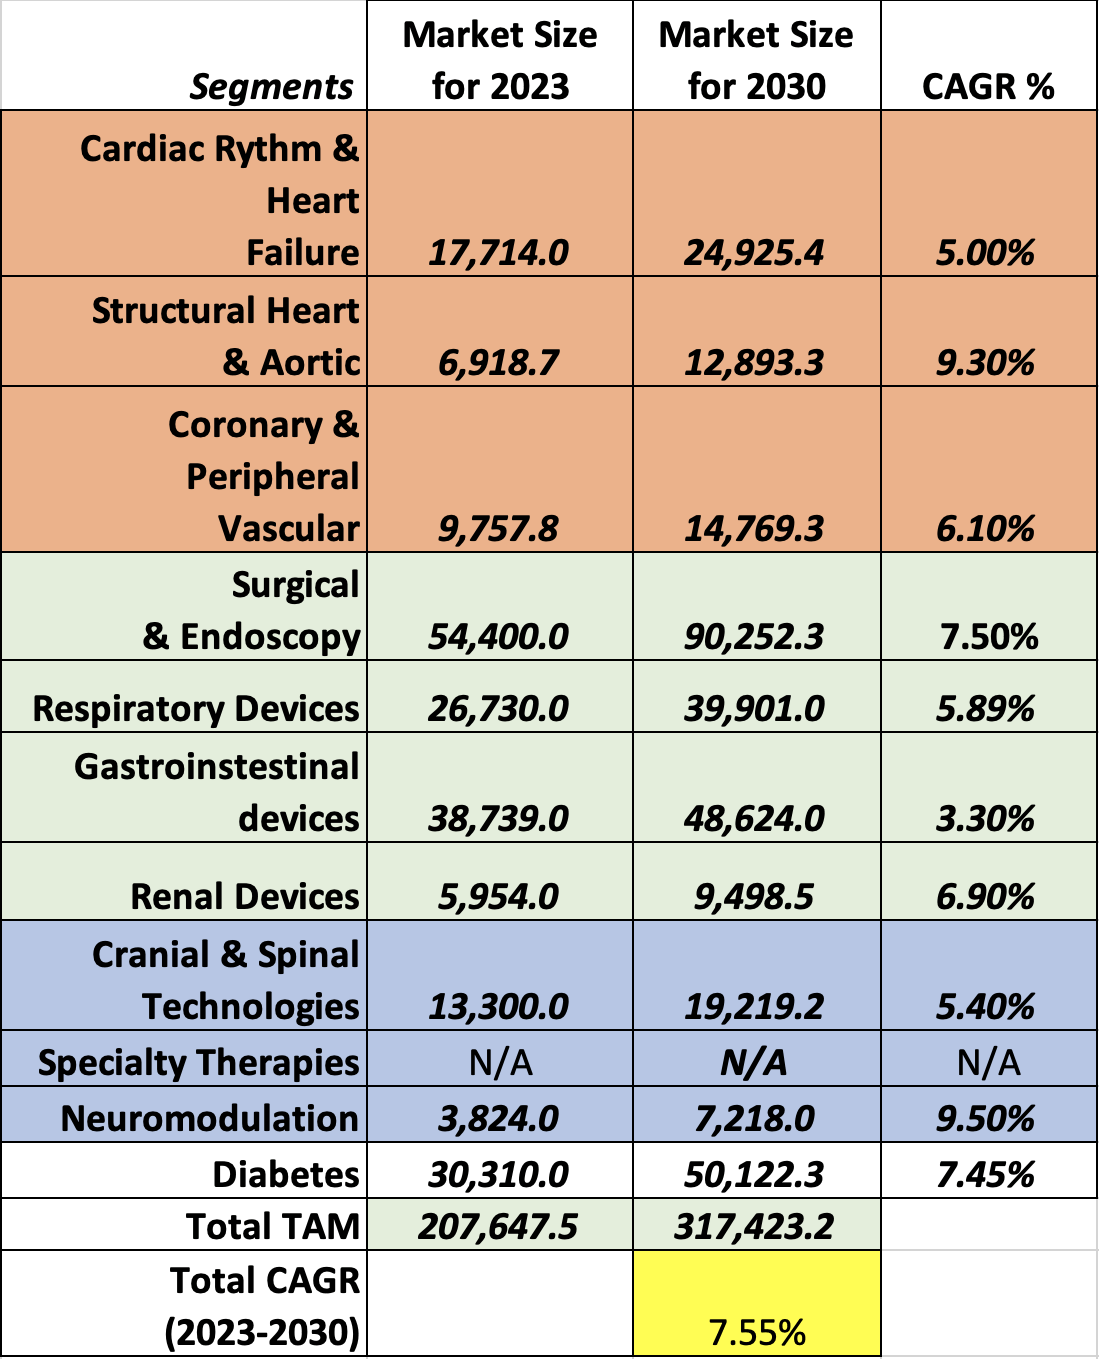
Valuation
I will value Medtronic through a DCF model. Below you can see all the current financial data that will be used for doing so. Meanwhile, the WACC will be calculated with the formula that everyone knows, and you can see the process in the section labeled “WACC Calculation” in the DCF model. The WACC came out at 8.33%, which paired with my estimated free cash flow growth rate of 15.86%, yields a perpetuity growth rate of 2.1%.
Then, D&A will be calculated with a margin tied to revenue, which came out at 8.18%.
| TABLE OF ASSUMPTIONS | |
| (Current data) | |
| Assumptions Part 1 | |
| Equity Market Price | 113,870.00 |
| Debt Value | 25,024.00 |
| Cost of Debt | 3.30% |
| Tax Rate | 23.42% |
| 10y Treasury | 4.422% |
| Beta | 0.83 |
| Market Return | 10.50% |
| Cost of Equity | 9.47% |
| Assumptions Part 2 | |
| CapEx | 1,587.00 |
| Capex Margin | 4.90% |
| Net Income | 3,705.00 |
| Interest | 826.00 |
| Tax | 1,133.00 |
| D&A | 2,647.00 |
| Ebitda | 8,311.00 |
| D&A Margin | 8.18% |
| Revenue | 32,364.0 |
| R&D Expense Margin | 12.93% |
The first step is to calculate revenue. For this, I will assume that all segments of Medtronic will perform in line with their respective markets. In the tables below, you can observe all the subsegments and segments. Acute Care & Monitoring will grow at 5.36% which is the average CAGR of Surgical & Endoscopy and Gastrointestinal, Respiratory, and Renal Devices.
Author’s Calculations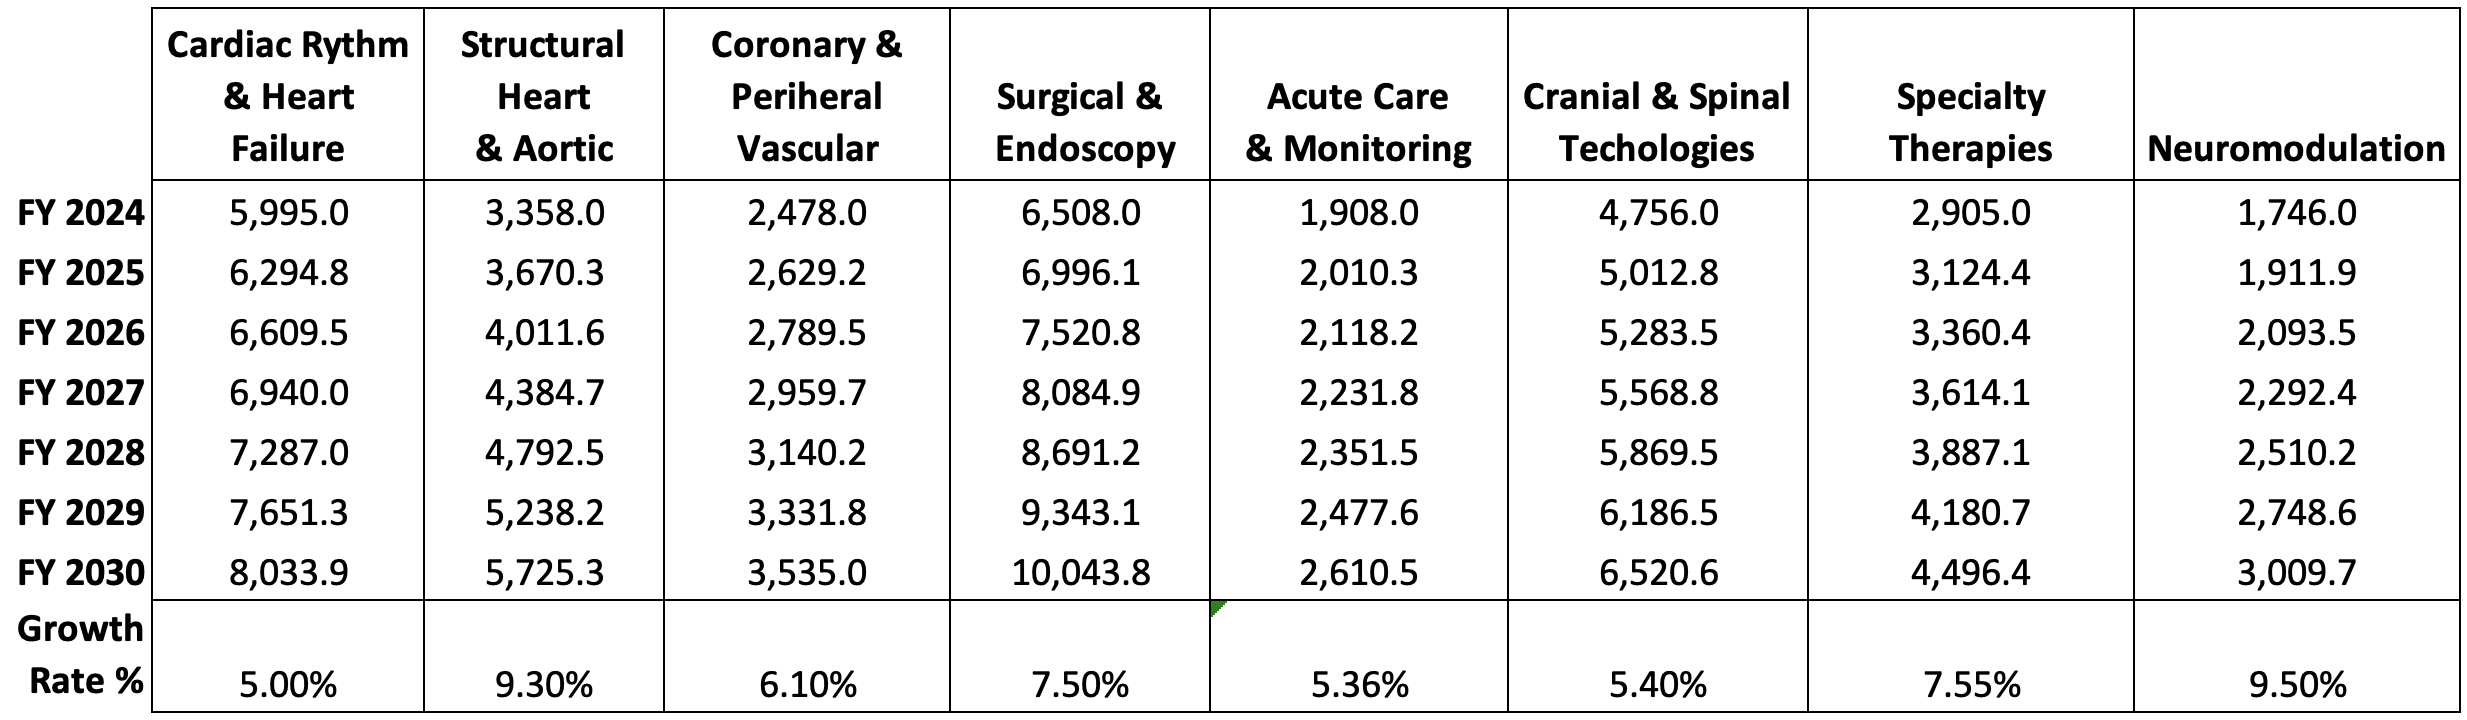
As you can see, the resultant growth rates for each segment are not unachievable. Growth rates for Cardiology, Medical Surgical, and Neuroscience need to grow at around the 6.5%-7% level to achieve my targets.
Author’s Calculations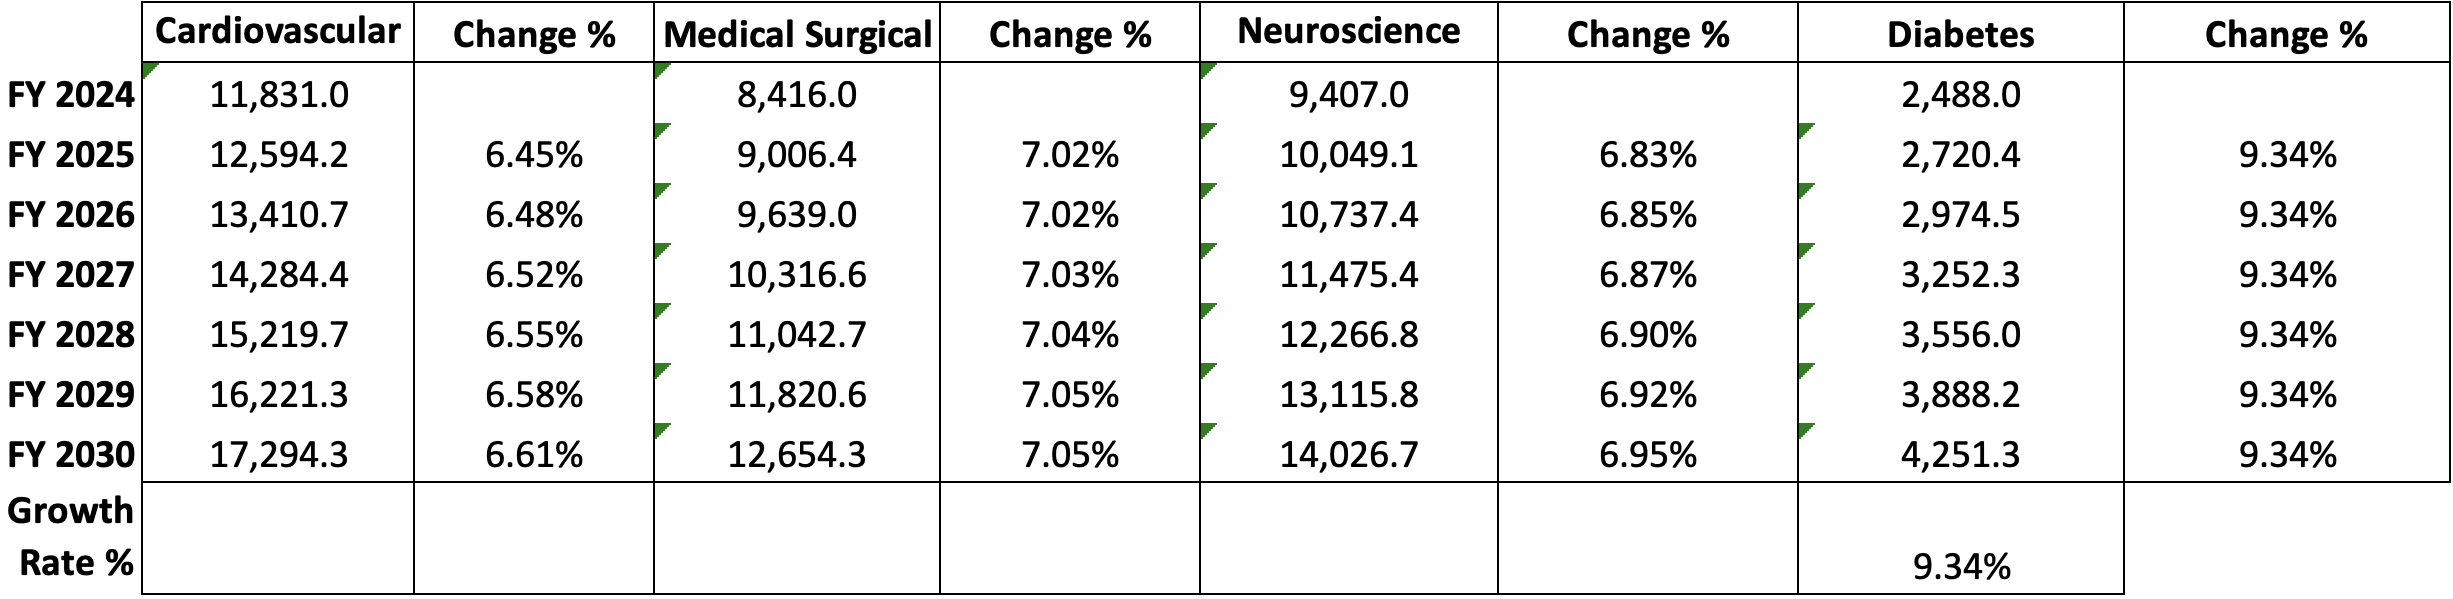
Now it’s time to calculate net income. For this, I will start with general & administrative expenses. For FY2023 I found that Medtronic spent $12B, which was divided by the total amount of employees 95K giving a result of $130K per employee. Then I will assume that Medtronic will hire 3.45K employees per year, as displayed in 2018-2020. I didn’t use posterior to 2021, because that would mean that Medtronic would be cutting its workforce, when we know that they haven’t announced any new cost-cutting strategies yet.
Meanwhile, for gross income, I found that for FY2024 the margin was 65.34%, which is not the highest I found. In 2019, the gross margin was 70.33%, so I will assume that Medtronic will improve its gross margin by 0.865% throughout 2024-2029.
Then, I found that the R&D expense margin for FY2024 was 12.93% of gross income, so I will keep it throughout the projection.
Currency exchange expenses (or gains) will be average, registered during 2018-2023 of $188.83M.
Lastly, income tax will be calculated with the current effective tax rate of 23.42%.
Author’s Calculations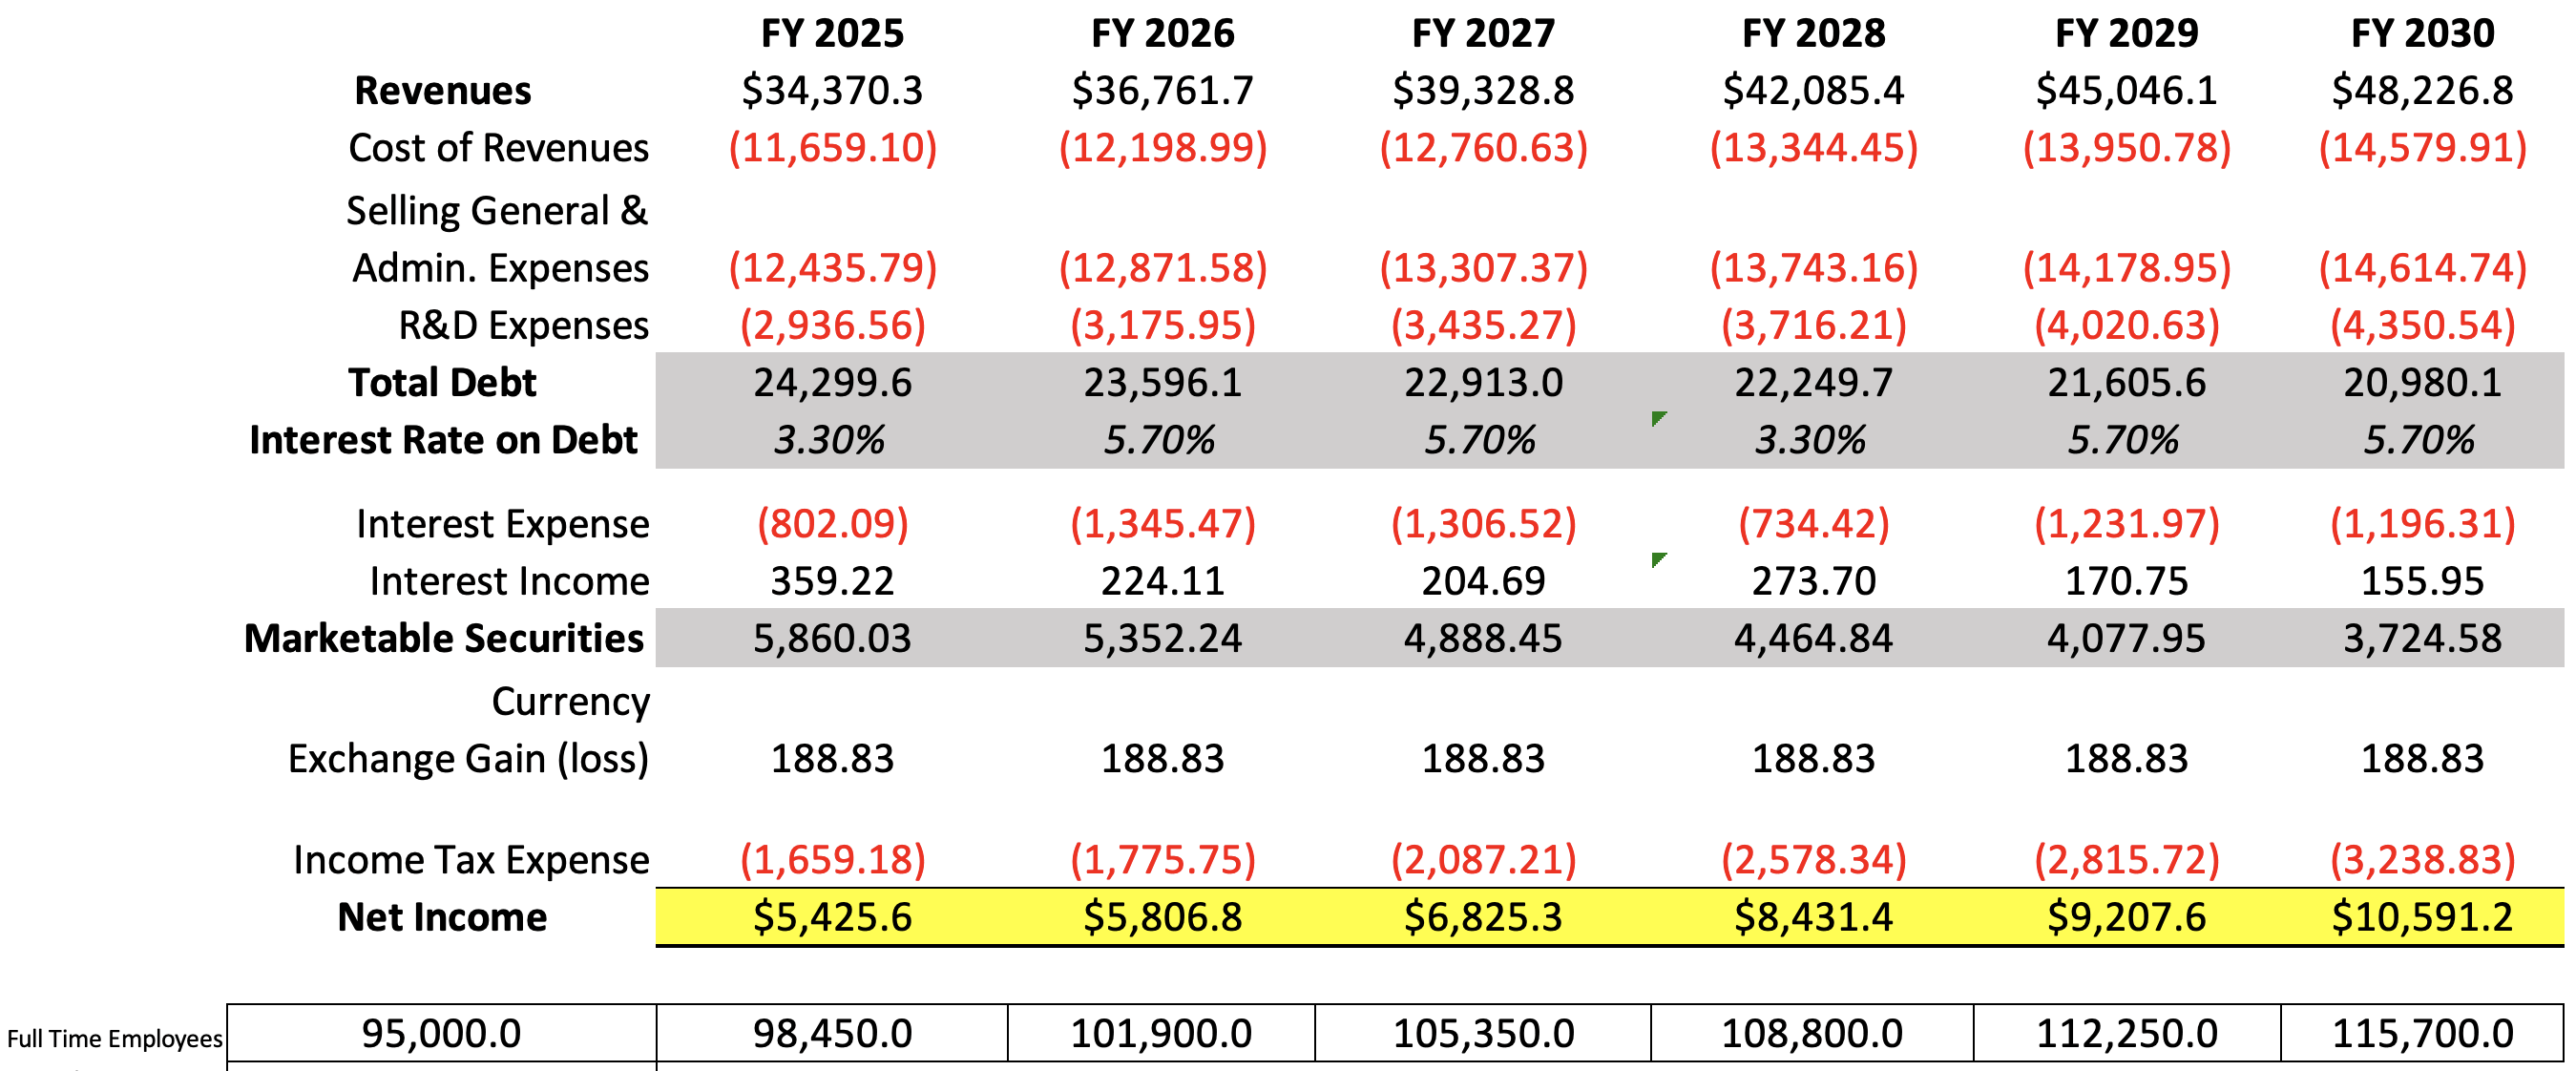
Then, I will also calculate what could be the potential future stock price for 2029. This will be done by using the undiscounted cash flows that are highlighted in green in the DCF model, and then predicting what could be the value of each of the elements that conform equity.
To do this last thing, I will use the annual change rates of the period 2021-20024. This means that long-term debt will decrease at a 3% annual pace, meanwhile, short-term debt will grow at 0.1% per year. Lastly, current assets will decrease at a 0.9% annual rate.
Author’s Calculations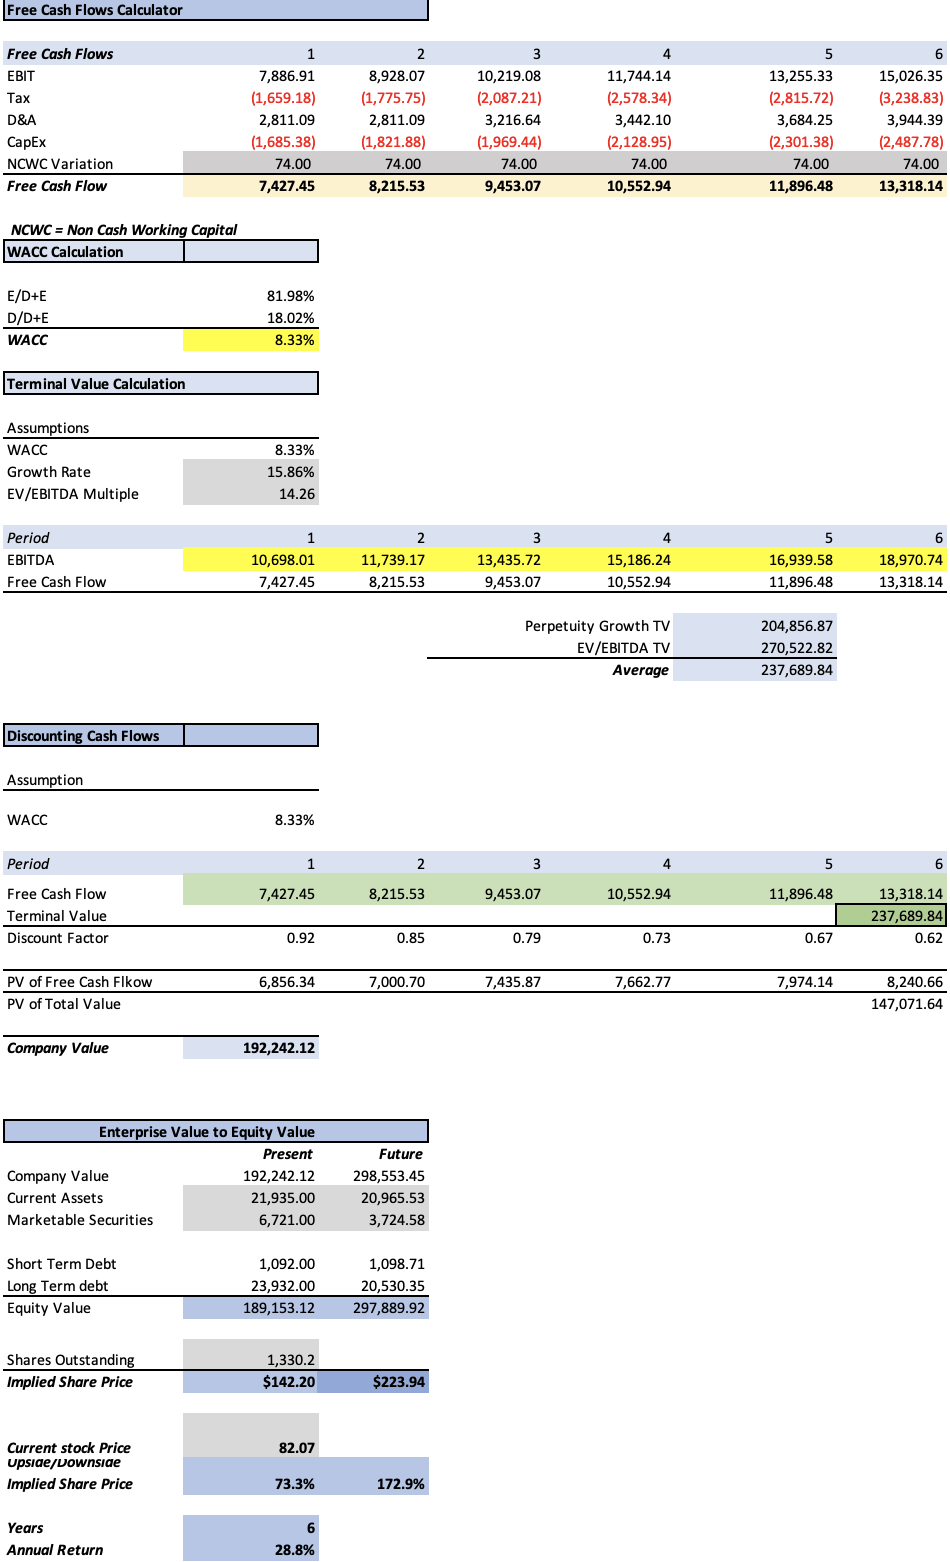
As you can see, my model suggests a fair price of $142.20, which is 74.7% above the current stock price of $82.07, and a future price of $223.94, which translates into 28.8% annual returns throughout 2024-2029.
At what point is Medtronic fairly valued?
I have prepared two additional scenarios to reiterate why I continue to believe that Medtronic’s stock is very safe. The first one is assuming that my net income targets come out $1.69B shorter. The situation would look like this:
| Revenue | Net Income | Plus Taxes | Plus D&A | Plus Interest | |
| FY 2025 | $34,370.3 | $3,735.65 | 5,394.83 | 8,205.92 | 9,008.01 |
| FY 2026 | $36,761.7 | $4,116.85 | 5,892.60 | 8,703.69 | 10,049.17 |
| FY 2027 | $39,328.8 | $5,135.35 | 7,222.56 | 10,439.20 | 11,745.72 |
| FY 2028 | $42,085.4 | $6,741.37 | 9,319.71 | 12,761.81 | 13,496.24 |
| FY 2029 | $45,046.1 | $7,517.64 | 10,333.36 | 14,017.61 | 15,249.58 |
| FY 2030 | $48,226.8 | $8,901.22 | 12,140.05 | 16,084.44 | 17,280.74 |
| ^Final EBITA^ |
Author’s Calculations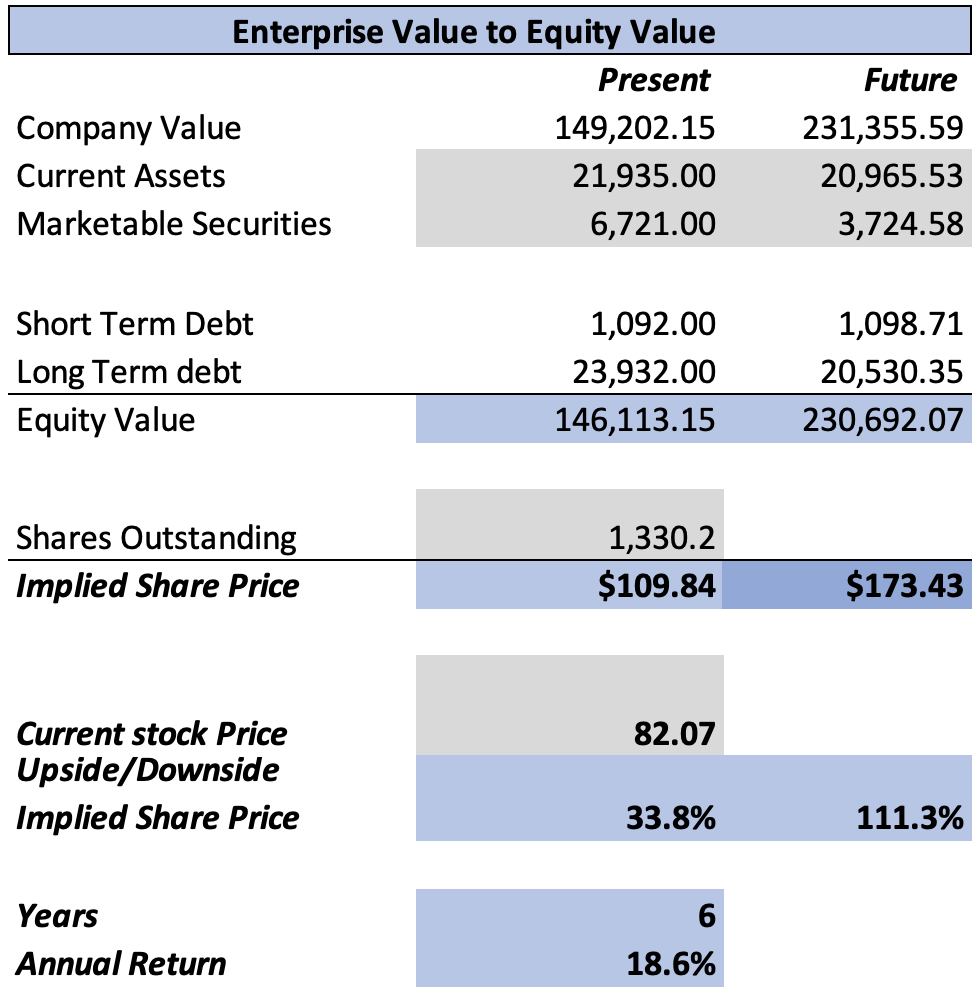
In this case, the fair price per share would stand at $109.84, which is 33.8% above the current stock price of $82.07. The future price would be $173.43 which suggests a potential 18.6% annual return throughout 2029 in this hypothetical scenario.
Then, I saw that if I reduce the net income targets by $3.38B (which is double $1.69B), the fair price per share would be $86.08, which is 4.9% above the current stock price of $82.07 (in other words, the stock would be fairly valued). The future price would be $136.79, which translates into 11.1% annual returns throughout 2029.
| Revenue | Net Income | Plus Taxes | Plus D&A | Plus Interest | |
| FY 2025 | $34,370.3 | $2,045.65 | 3,704.83 | 6,515.92 | 7,318.01 |
| FY 2026 | $36,761.7 | $2,426.85 | 4,202.60 | 7,013.69 | 8,359.17 |
| FY 2027 | $39,328.8 | $3,445.35 | 5,532.56 | 8,749.20 | 10,055.72 |
| FY 2028 | $42,085.4 | $5,051.37 | 7,629.71 | 11,071.81 | 11,806.24 |
| FY 2029 | $45,046.1 | $5,827.64 | 8,643.36 | 12,327.61 | 13,559.58 |
| FY 2030 | $48,226.8 | $7,211.22 | 10,450.05 | 14,394.44 | 15,590.74 |
| ^Final EBITA^ |
Author’s Calculations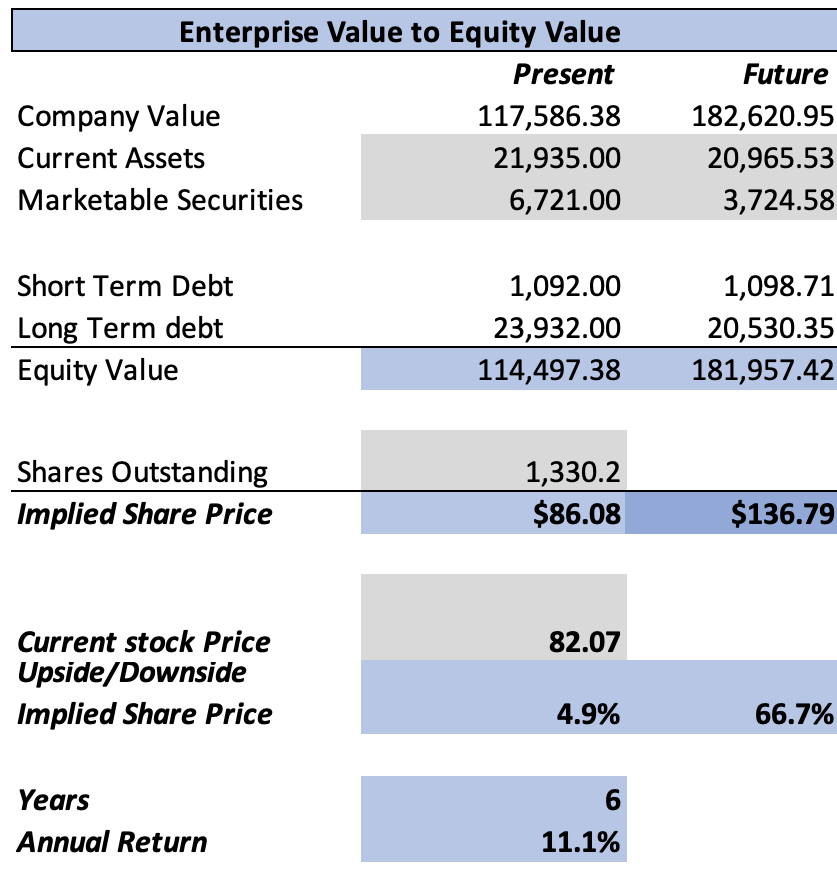
Risks to Thesis
The main risk with Medtronic is that its products require constant innovation to stay competitive, therefore, if Medtronic fails to do so, competitors can quickly eat their market share.
The second risk is geopolitics, since, as it appeared yesterday in the news, Donald Trump’s Republicans drafted a plan of 10 measures that will be prioritized if he rises to power again. Two of them that will surely affect Medtronic are: 1) 10% on all global imports; and 2) Banning American companies from investing in China. This could harm any production line that Medtronic has on US soil.
As a side note, in my opinion, these two measures will hurt the US, since the firms affected will probably relocate to tax havens (because they are mostly neutral countries) and this will make the US lose billions in tax revenue.
Nevertheless, I find that Medtronic is a resilient stock since it mostly caters to hospitals, which have far more stable purchasing power than individuals, and even if there is a recession, health insurance (or the government) will cover most of the treatment costs, and the same applies to the vast majority of countries.
Conclusion
In conclusion, Medtronic still presents, in my opinion, a huge revaluation opportunity. Cardiology and Diabetes (which are the most important segments) can still deliver potential growth rates of 8.94% and 9.34% respectively.
According to my estimates, the estimated fair price stands at $142.20, and the future price for the year 2029 at $223.94. This represents a 74.7% fair price adjustment opportunity and annual returns of 28.8% throughout 2024-2029.
Medtronic is a safe bet since to make it fairly valued, the net income should fall to $2B, which would only happen in a catastrophic scenario. Furthermore, the stock still pays a 3.24% dividend yield, which is higher and more stable than interest on bank accounts.
For these reasons, I reiterate my “strong-buy” rating on Medtronic. For subsequent quarters, it’s still important to monitor revenue growth performance, and among all, Medtronic’s profitability.
Analyst’s Disclosure: I/we have no stock, option or similar derivative position in any of the companies mentioned, and no plans to initiate any such positions within the next 72 hours. I wrote this article myself, and it expresses my own opinions. I am not receiving compensation for it (other than from Seeking Alpha). I have no business relationship with any company whose stock is mentioned in this article.
Seeking Alpha’s Disclosure: Past performance is no guarantee of future results. No recommendation or advice is being given as to whether any investment is suitable for a particular investor. Any views or opinions expressed above may not reflect those of Seeking Alpha as a whole. Seeking Alpha is not a licensed securities dealer, broker or US investment adviser or investment bank. Our analysts are third party authors that include both professional investors and individual investors who may not be licensed or certified by any institute or regulatory body.