Summary:
- Medtronic has a history of dividend increases and is well-positioned for long-term growth in the healthcare industry.
- The company’s financial performance has been solid, with stable margins and consistent free cash flow.
- Medtronic has a strong balance sheet and is focused on implementing operating efficiencies to improve profitability.
- My valuation analysis suggests the stock is around 10% undervalued.
Xinhua News Agency/Xinhua News Agency via Getty Images
Investment thesis
Medtronic (NYSE:MDT) has a vibrant history and is a member of the S&P 500 dividend aristocrats, thanks to its 46 years of dividend increases in a row. The stock had a challenging last five years because of stagnating profitability and intensifying competition in the healthcare industry. Nevertheless, the management exhibits robust adaptability with its efficiency strategies, resulting in notable enhancements in profitability metrics for the current fiscal year. Additionally, from a top-line viewpoint, I observe numerous strengths that Medtronic is well-positioned to leverage over the long term. With a respectable 3.3% dividend yield and a projected 10% upside potential, the stock deserves a “Buy” rating.
Company information
Medtronic is one of the leading global medical technology and solutions companies. Its products specialize in managing heart rhythm, spinal and surgical navigation advancements, remedies for diabetes and neurological ailments, vascular treatments, and cardiac surgical procedures. MDT is a component of S&P500.
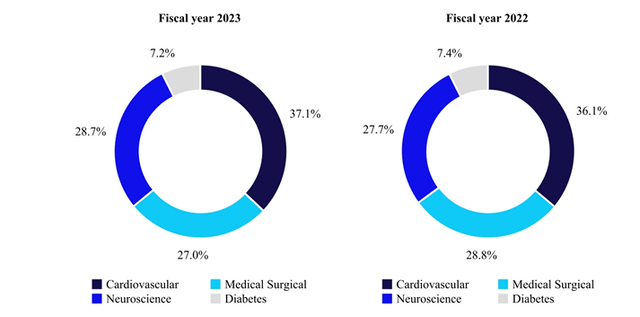
The company’s fiscal year ends on the last Friday of April each year. There are four segments: Cardiovascular, Neuroscience, Medical Surgical, and Diabetes. The cardiovascular segment is the largest in terms of generated revenue.
Financials
The company’s financial performance has been solid from the revenue growth perspective over the last decade, with a 7.1% CAGR. However, profitability metrics shrank notably compared to the beginning of the decade. On the other hand, margins have stabilized in recent years and were within a relatively narrow corridor, which substantially decreases the uncertainty level both for the management and investors. The good point is that MDT consistently delivers double-digit free cash flow [FCF] ex-stock-based compensation [ex-SBC] margin, which provides the company with good opportunities to return money to shareholders.
I like capital allocation because the management balances keep shareholders happy with consistent dividend payouts and generous stock buybacks and sustain a healthy balance sheet. The company had $7.7 billion in outstanding cash as of the latest reporting date and a prudent leverage ratio. Having such a fortress balance sheet provides MDT with massive financial flexibility, which increases the probability of its ability to continue delivering revenue growth. The strong balance sheet is likely to provide more growth opportunities for Medtronic because acquisitions have played an important role in the company’s historical expansion. Over the last decade, MDT invested in cash acquisitions totaling $23 billion, which was around 40% of the cumulative operating profit over the same period. That is why I believe that a strong balance sheet positions MDT well for a sustainable growth.
Seeking Alpha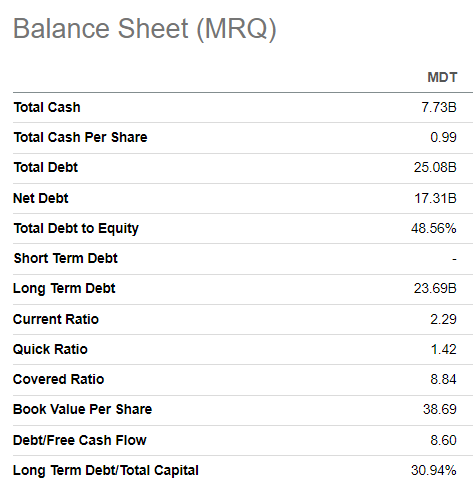
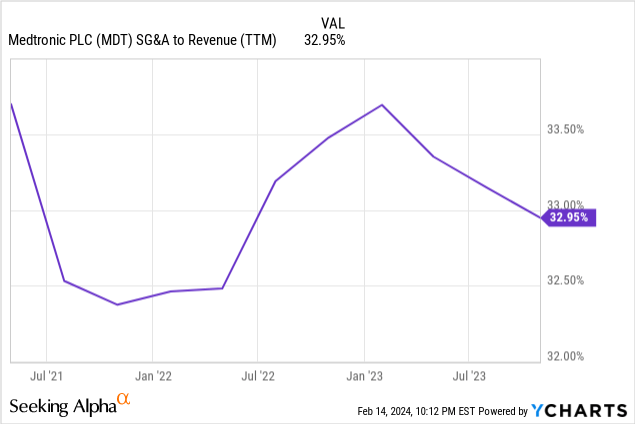
While I have highlighted the notable decline in profitability compared to the beginning of the last decade, I like the fact that the management is working on implementing operating efficiencies, which has already resulted in a solid downward trend in the SG&A to revenue ratio in 2023. The company restructured its facilities, which allowed it to optimize the headcount in 2023. The optimization process is still active, as in January, it was announced that the company plans to close five plants and six distributor centers, but the management did not specify the number of jobs affected. Therefore, I expect the operating profitability to continue improving in the 2024 calendar.
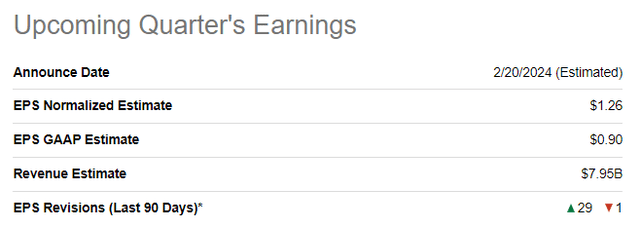
The upcoming quarter’s earnings release is scheduled for February 20, and there is massive optimism from Wall Street analysts as the projected EPS saw 29 upward revisions over the last 90 days. Quarterly revenue of $7.95 is expected to be almost flat sequentially and show a 3% YoY increase. Despite revenue growth, the adjusted EPS is expected to shrink slightly from $1.30 to $1.26. While the YoY dynamic of revenue and EPS might not be very impressive, I am optimistic about the possibility of another guidance improvement. As I have highlighted, there are plans to continue operating efficiency improvement, and I believe there are extra initiatives that can be brought to the table during the upcoming earnings call.
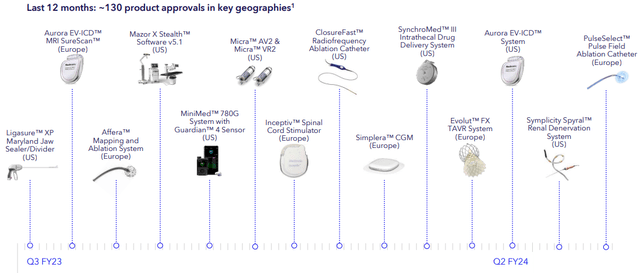
My optimism is also backed by the pace with which MDT gets new product approvals, which means more potential to expand revenue and capitalize on the company’s investments in acquisitions and R&D. According to the latest earnings presentation, the company obtained 130 product approvals over the last 12 months.
Another strategic strength that I see is Medtronic’s diverse presence across several healthcare domains, with a balanced weighting of each of the three largest segments. Global distribution of the company’s products also makes the business mix stronger and helps in diversifying geographic concentration risks.
Valuation
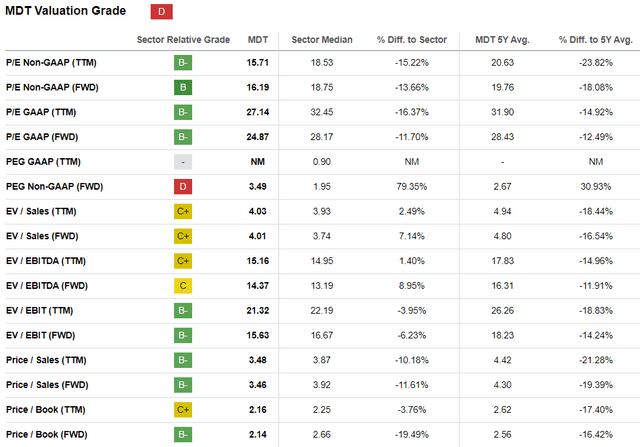
MDT demonstrated a 0.4% share price increase over the last twelve months, and the 52-week range varied between $69 and $92. The stock’s performance has lagged behind the broader U.S. market and the Health Care sector (XLV) over the last 12 months. Seeking Alpha Quant assigns MDT a low “D” valuation grade mainly due to the massive forward PEG ratio, but other ratios look attractive. What is crucial is that most of the valuation ratios are notably lower than MDT’s historical averages.
Since MDT is a mix of a growth and value stock, in my opinion, simulating both the dividend discount model [DDM] and discounted cash flow [DCF] approaches will be sound for my valuation analysis. I will use a 6.6% discount rate for both models, which is a recommendation from Gurufocus.
MDT has an exceptional dividend consistency, which gives me high conviction that consensus dividend estimates are reliable to incorporate into my DDM. That said, I use an FY 2025 $2.91 projection. MDT also has a solid dividend growth record, but to be on the safe side, I use a three-year forward projection of 3.45%.
Author’s calculations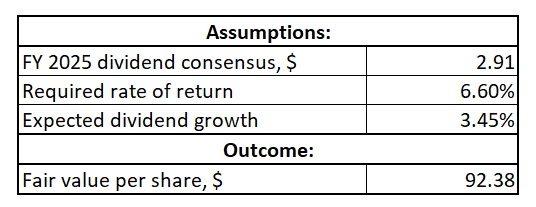
According to my DDM analysis, the stock’s fair price is $92.4. This represents a 10% upside potential, which looks attractive given the stock’s low volatility and a decent 3.3% forward dividend yield.
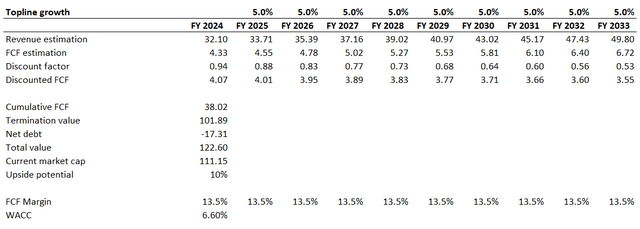
Now I will proceed with the DCF simulation. I use a 5% revenue CAGR for the next decade, which looks like a fair deceleration compared to the last decade’s 7% rate. Moreover, my projected revenue growth rate is approximately in line with the revenue consensus estimates. I use a flat 13.5% FCF ex-SBC margin, which is the last decade’s average. To be conservative, I will also deduct from my fair value calculation the current $17.3 billion net debt position.
According to my DCF simulation, the business’s fair value is around $123 billion. This is 10% higher than the current market cap, meaning that DCF outcomes align with the fair share price derived from the DDM analysis. Summarizing all the above, I believe that MDT is attractively valued.
Risks to consider
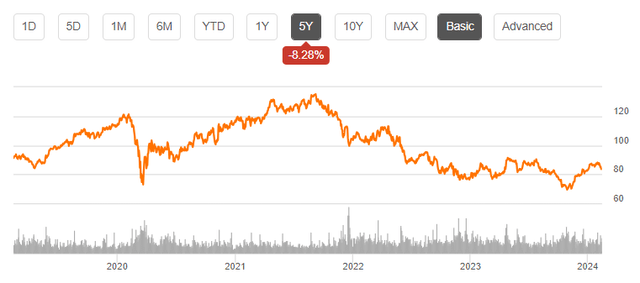
The stock price declined by 8.3% over the last five years, meaning it was not a good choice for investors who were seeking capital gains apart from the solid dividend growth. Potential investors, especially those targeting growth, should be ready for “boring” share price dynamics. On the other hand, considering the length of the timeframe below, we can see that the stock has been trading in a relatively narrow corridor and is currently much closer to the lower edge of the range, which increases the probability of a rebound to higher levels in the short term.
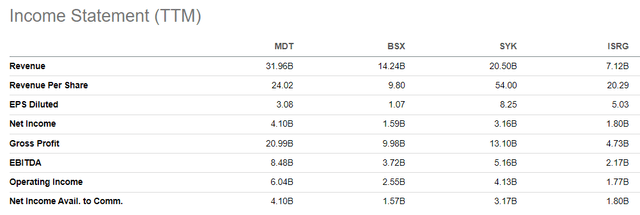
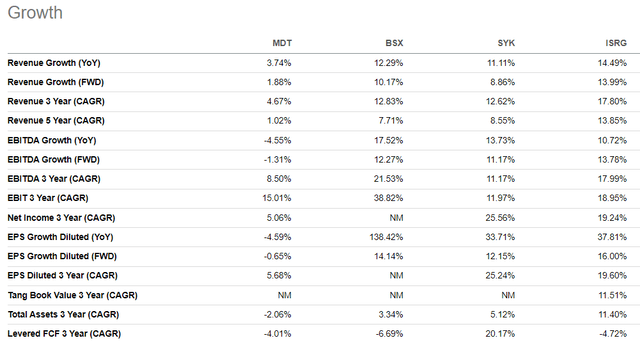
The major business risk that I see is the fierce competition. There are numerous competitors in the Health Care Equipment industry, which are approximately of the same market cap as MDT, which includes Boston Scientific Corporation (BSX), Stryker Corporation (SYK), and Intuitive Surgical (ISRG). I will not dig deep into comparisons of offerings of each company because the environment and technologies are rapidly evolving, and I would better look from the perspective of financial metrics and their dynamics.
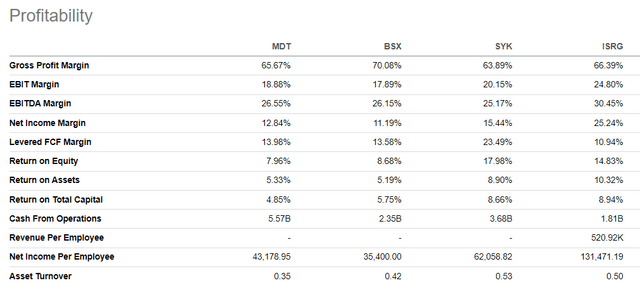
Despite the fact that the market caps of all these companies are not very far from MDT’s, we can see that Medtronic is far larger from the perspective of revenue. Such an inconsistency between the differences in market cap and revenue highly likely means that investors perceive MDT as weaker than peers. Indeed, from the perspective of profitability ratios, MDT is a rare leader in any of them, suggesting that competitors are likely utilizing their resources in a more efficient manner.
Moreover, MDT demonstrates a much more modest revenue growth than its peers. While investors apparently highly value growth dynamics and prospects, I do not think it is a big red flag for MDT. First, the company is still by far the largest from the perspective of revenues and operating cash flows generated, meaning that MDT generates more resources to reinvest into business in absolute terms. Second, the management’s efficiencies initiatives are working, which we have seen in the financial analysis, which means that MDT will close the gap in terms of profitability metrics compared to the competition.
Bottom line
To conclude, Medtronic stock is a “Buy.” The company shows promising potential for maintaining strong revenue growth. Not only does it have a bright future in terms of top-line performance, but its management’s focus on improving profitability is also essential for building lasting shareholder value. With a 3.3% dividend yield, consistent growth, and a projected 10% upside potential, Medtronic stock is a solid choice for investors looking for stability and dividend growth.
Analyst’s Disclosure: I/we have no stock, option or similar derivative position in any of the companies mentioned, and no plans to initiate any such positions within the next 72 hours. I wrote this article myself, and it expresses my own opinions. I am not receiving compensation for it (other than from Seeking Alpha). I have no business relationship with any company whose stock is mentioned in this article.
Seeking Alpha’s Disclosure: Past performance is no guarantee of future results. No recommendation or advice is being given as to whether any investment is suitable for a particular investor. Any views or opinions expressed above may not reflect those of Seeking Alpha as a whole. Seeking Alpha is not a licensed securities dealer, broker or US investment adviser or investment bank. Our analysts are third party authors that include both professional investors and individual investors who may not be licensed or certified by any institute or regulatory body.

