
Summary:
- Different growth rates are projected across sectors: Cardiovascular (7.9%), Medical Surgical (9.4%), Neuroscience (5.95%), and Diabetes (9.8%).
- The company plans to embrace digital technologies and pursue cost-cutting strategies, aiming for $1 billion savings by 2025.
- Two growth scenarios are considered: 8.25% and 4.5% revenue growth rates until 2028.
- Despite challenges, Medtronic’s stock presents an opportunity, having declined by 39% from its peak, with positive market prospects and a solid dividend yield.
Sundry Photography
Thesis
Medtronic PLC (NYSE:MDT) has revised its revenue growth forecast for 2024 to 4.5%. This marks a significant departure from years of revenue stagnation the company has endured, a stagnation driven by factors such as delayed product launches, competitive pressures, and supply chain disruptions (the latter particularly evident during 2022 due to China’s lockdowns). Among the primary catalysts for this newfound growth is the introduction of the MiniMed 780G into the US market-a revolutionary glucose monitoring device paired with an insulin pump.
I have evaluated two scenarios using a discounted cash flow [DCF] analysis. The DCF analysis suggests a stock price target of $128.79, a 58% upside, with a projected future value of $160.30, an upside of 97%. This implies an annual return of 16%. Achieving this target hinges on Medtronic’s ability to maintain a 4.5% revenue growth trajectory until 2028. This task might prove feasible, given the aging global population and the increasing significance of diabetes, which are propelling the markets in which Medtronic operates to a combined compound annual growth rate [CAGR] of 8.25%.
Overview
Company
As is well-established, Medtronic is a prominent company dedicated to the advancement of medical devices across various domains including cardiovascular, Medical Surgical, Neuroscience, and diabetes. Among these, the cardiovascular sector stands out as the most crucial for Medtronic. In the fiscal year 2023, this sector contributed significantly, generating a substantial $11.5 billion in revenue. This impressive figure constitutes 37% of Medtronic’s total revenue, which reached $31.22 billion during the same period.
Weight of the different segments in Medtronic’s revenue (2023 Annual Report)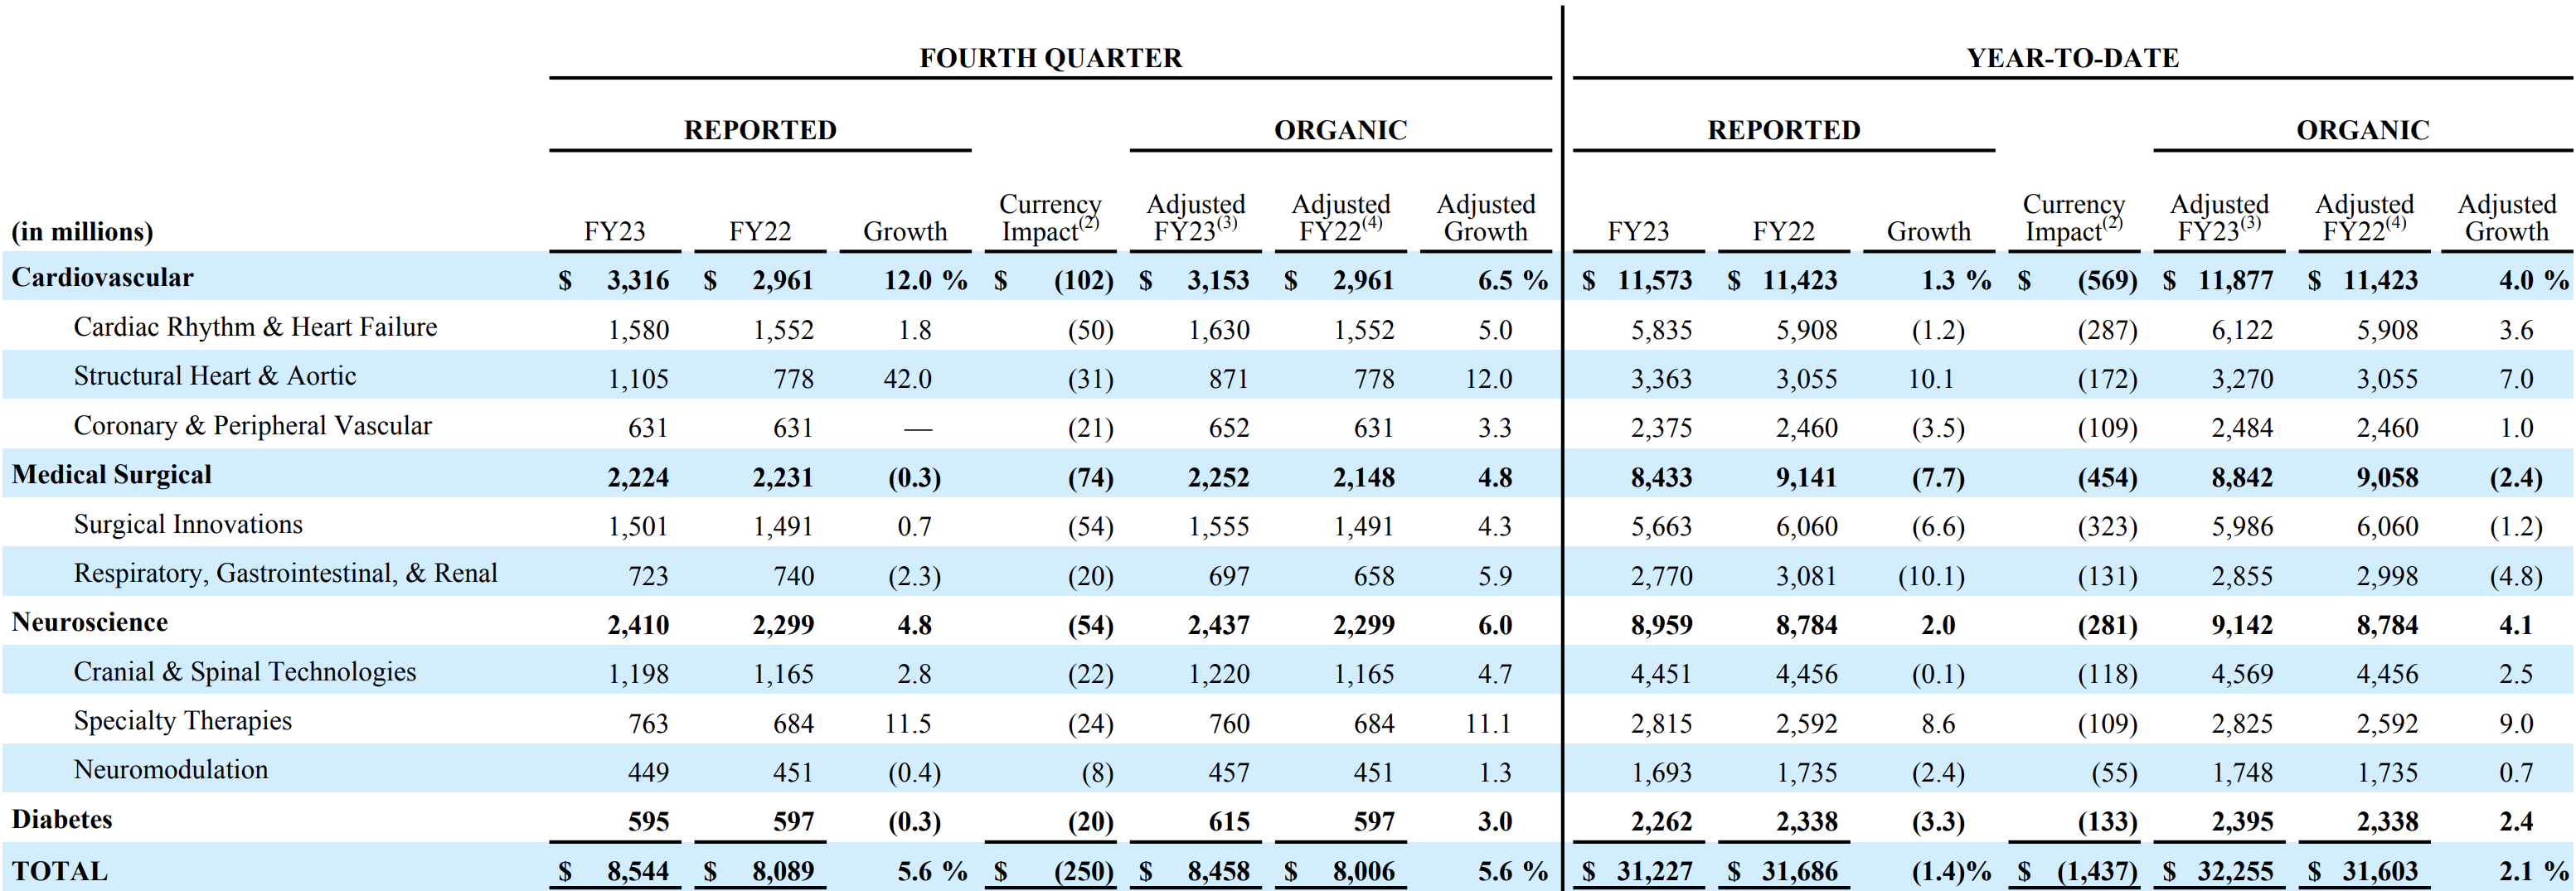
In the fourth quarter of 2023, Medtronic posted robust high single-digit growth across Developed Nations (excluding the US, where growth stood at 2.3%). The growth rate reached an impressive 8.3% in these developed markets. Simultaneously, in emerging markets, Medtronic achieved a remarkable revenue growth of 10.6%.
Regional Growth (Investors’ presentation)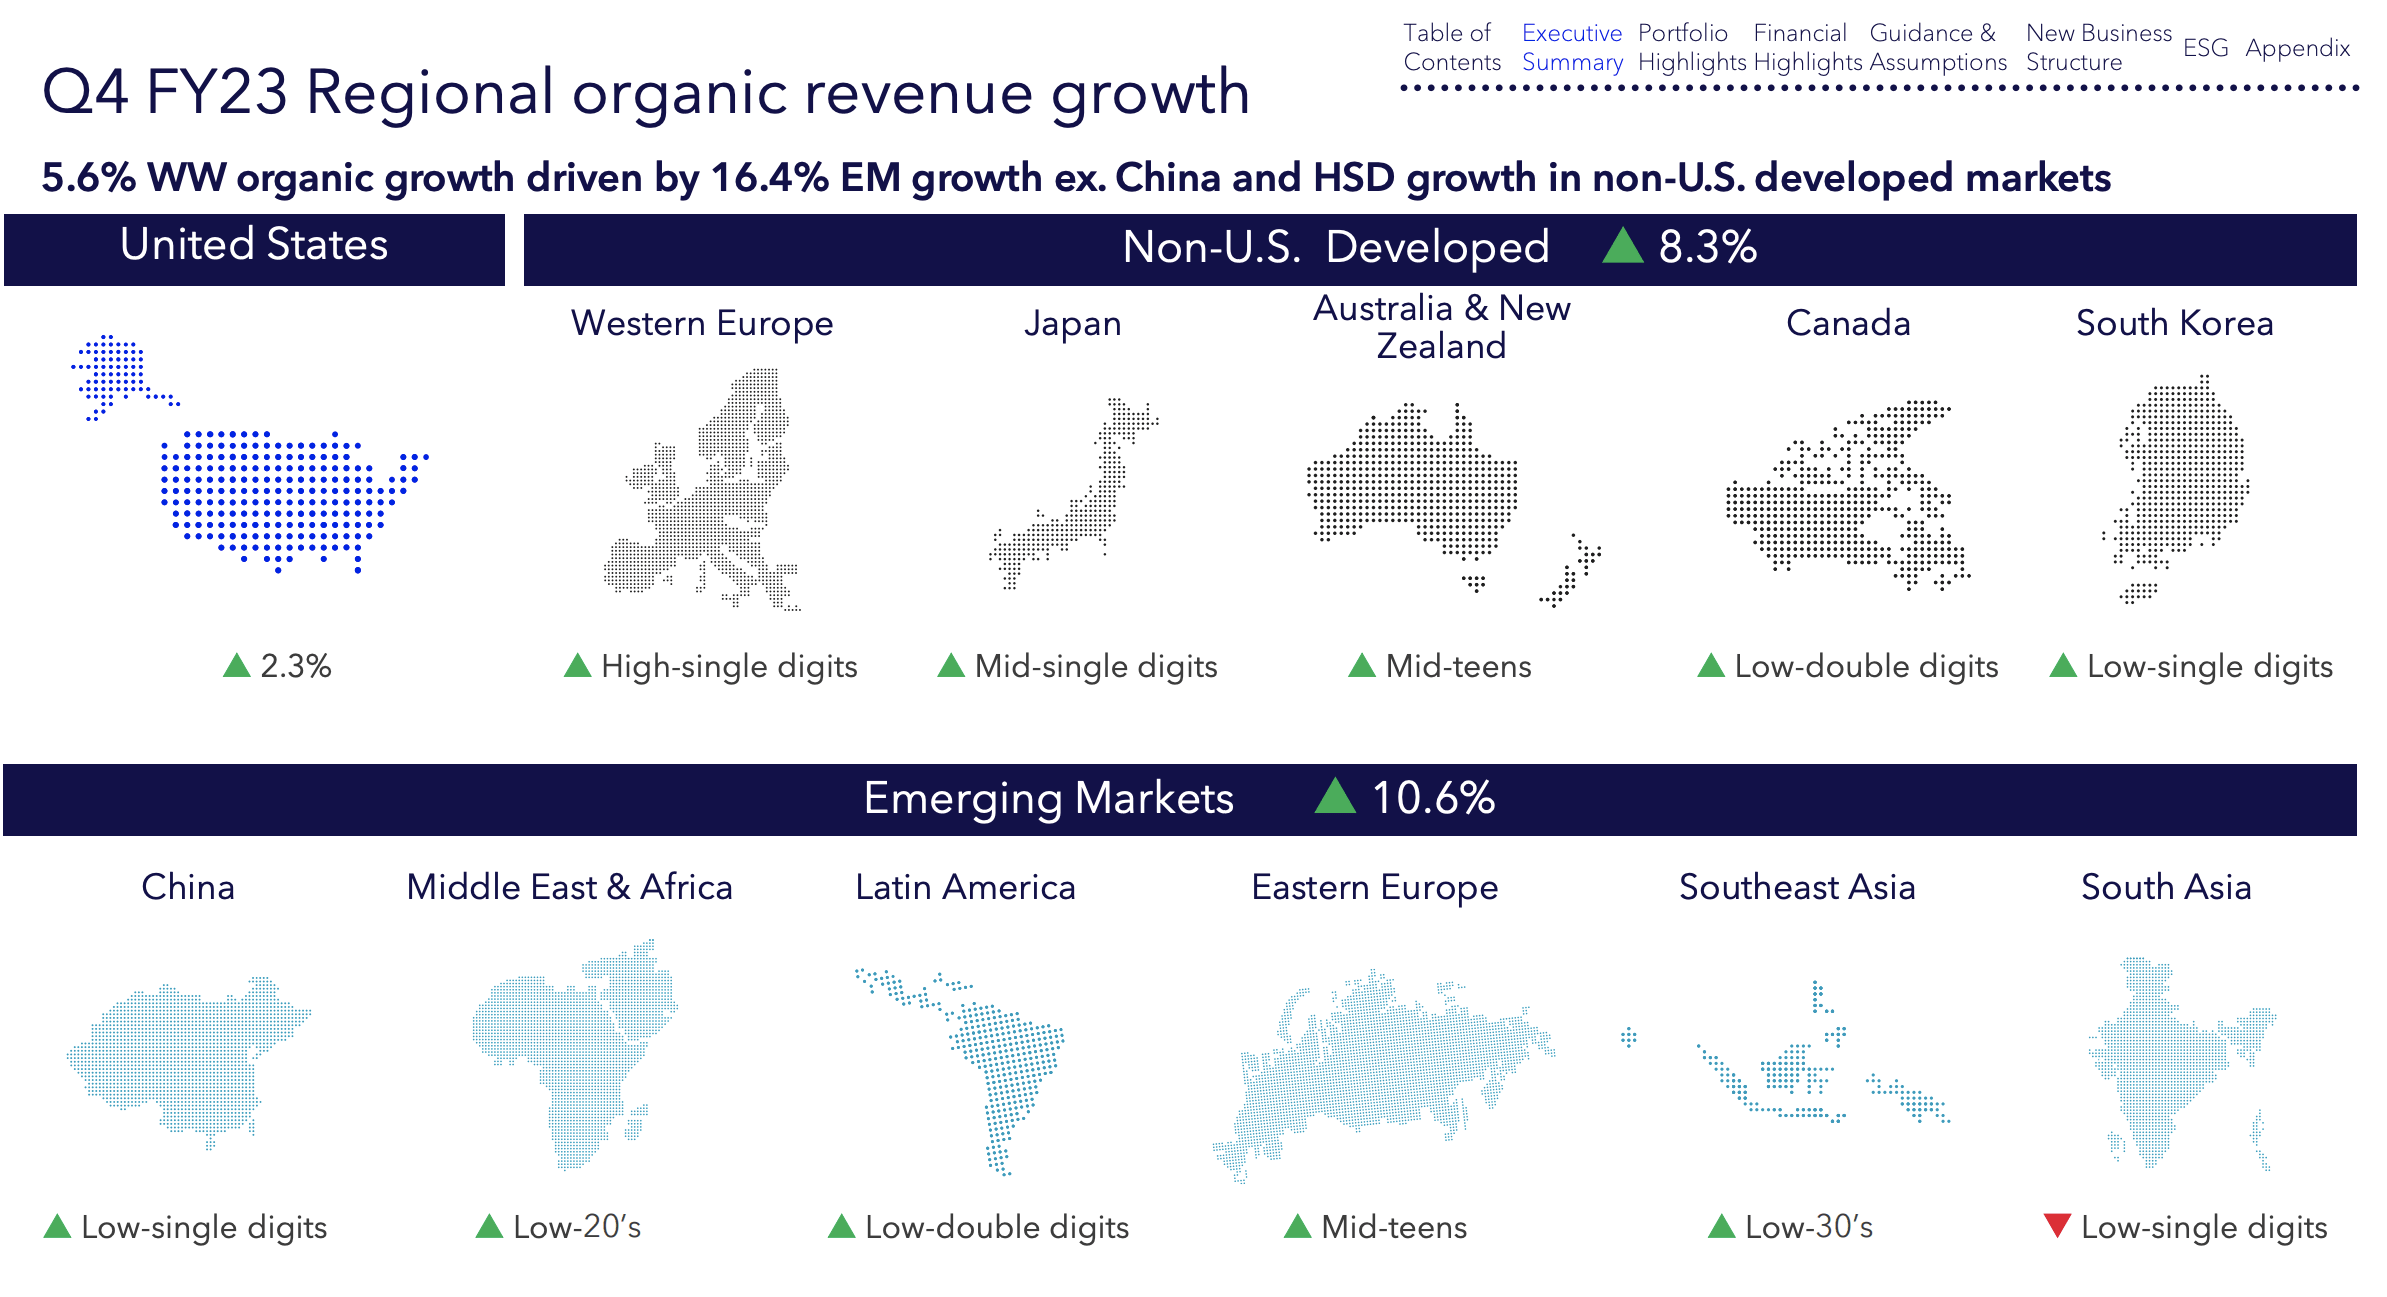
Market
Medtronic’s primary revenue driver, the cardiovascular devices market, is projected to maintain a robust growth trajectory with a compound annual growth rate [CAGR] of 7.9% until the year 2032. This notable projection underscores the promising growth prospects within Medtronic’s pivotal sector.
Cardiovascular devices market size projection (Precedence Research)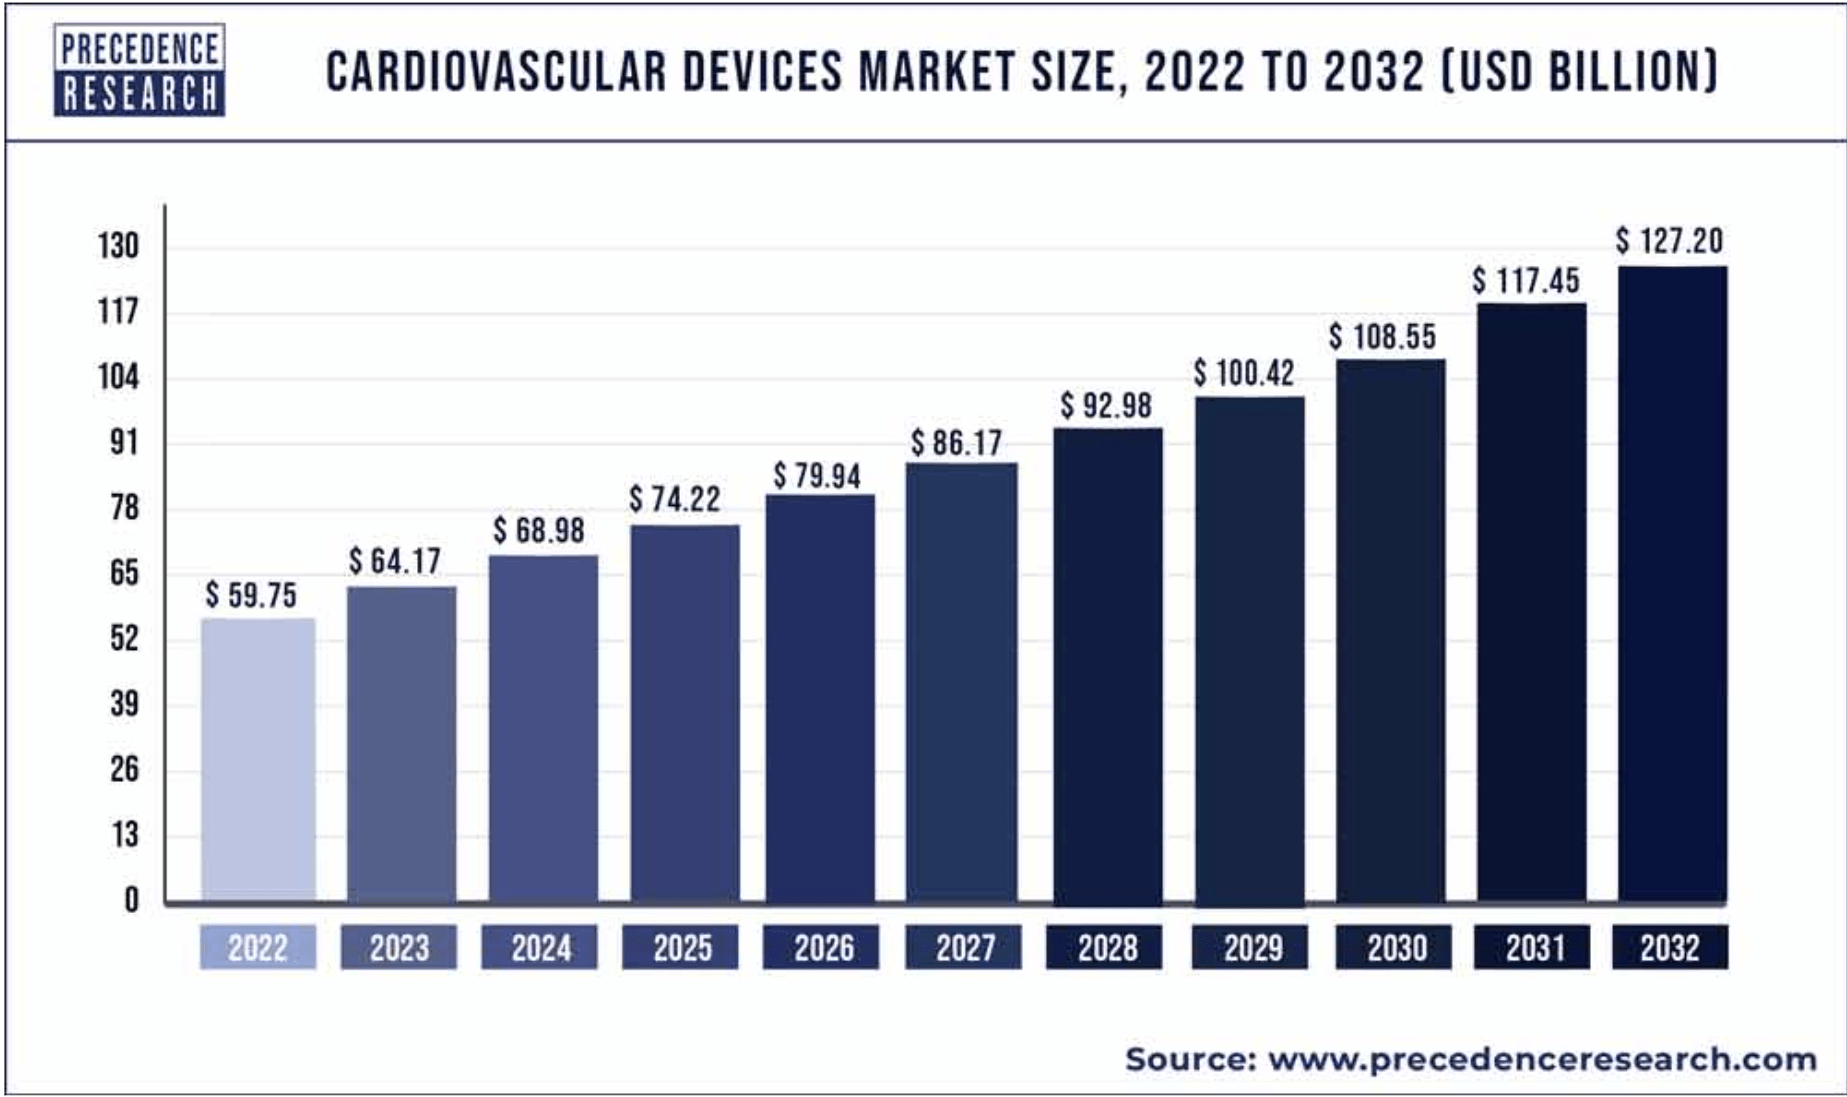
Globally, the medical surgical devices market is anticipated to expand substantially, demonstrating a CAGR of 9.4%. This growth trajectory is expected to elevate the market from $16.8 billion in 2023 to a substantial $31.58 billion by 2030.
Medical Surgical Devices Projections (Grand View Research)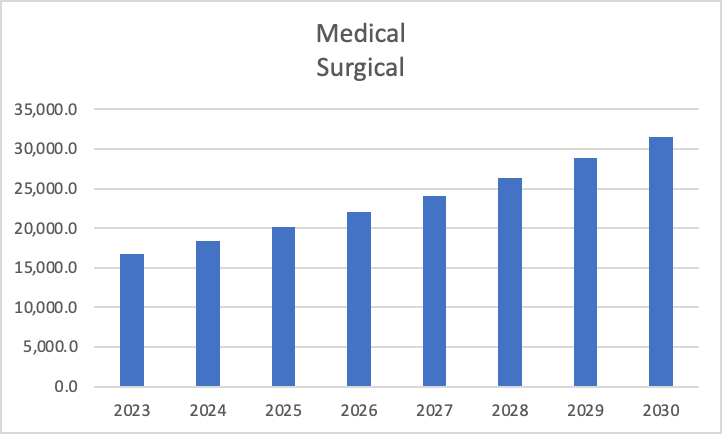
Within the realm of neuroscience, an upward trajectory is foreseen, transitioning from $31.38 billion in 2022 to an estimated $41.86 billion in 2027. This growth is underpinned by a calculated CAGR of 5.95%.
Neuroscience Devices Projections (The Business Research Company)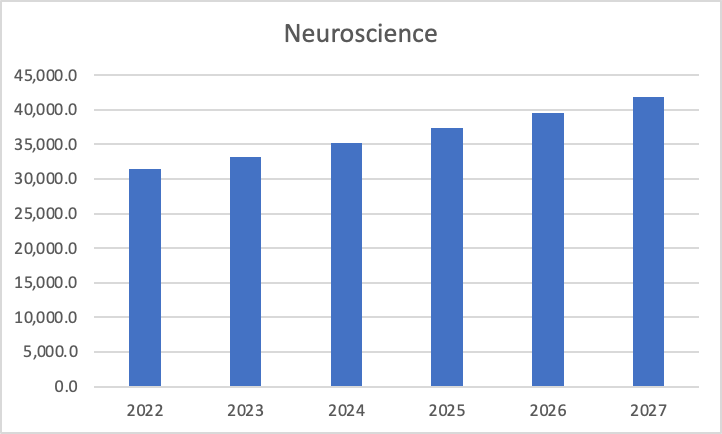
Conversely, the diabetes medical devices segment is poised for remarkable advancement. Projected to surge at a CAGR of 9.8%, this segment is anticipated to burgeon from $41.2 billion in 2022 to an impressive $107.1 billion by 2032. This trajectory is fueled by escalating diabetes prevalence and escalating investments from both public and private entities in this domain.
Diabetes Devices Projection (Global Market Insights)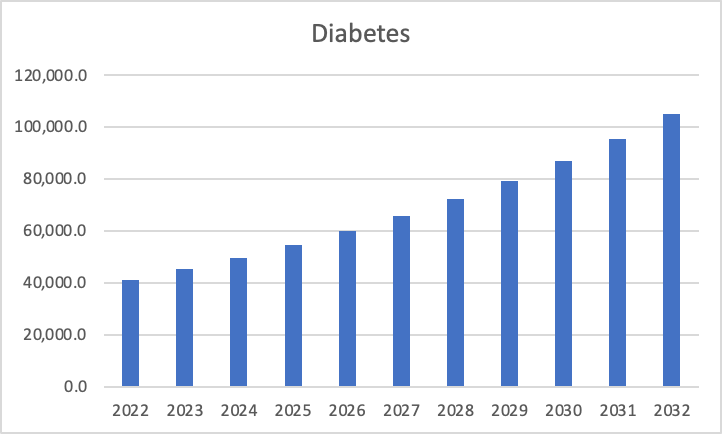
As you may have guessed, the main driver of growth here, is the aging population that will increase the demand for medical procedures. Evidently, all segments, except for neuroscience, are poised for high single-digit growth. This trend is promising, indicating that Medtronic possesses the potential to outpace the 4 – 4.5% growth it has maintained over the past five years-a rate that aligns with its recent Q4 2023 earnings report. Should Medtronic align its growth with the pace of their respective market segments, an optimal growth rate of 8.25% could feasibly be anticipated.
Medtronic’s Recent Problems
In 2022, the company encountered significant challenges stemming from supply chain disruptions, specifically related to China’s COVID-19 lockdowns. This predicament exerted cost pressures on Medtronic, subsequently impacting its revenue performance.
Medtronic also faced complications regarding the FDA’s approval process for its MiniMed 780G pump. The FDA had placed the approval on hold due to quality concerns within Medtronic’s diabetes division. The approval of this product holds considerable significance as it marks an inflection point for the diabetes segment. Notably, this product experiences robust demand, leading to an 18% surge in revenue for this segment across developed markets outside the United States.
Medtronic’s Rebound Plan
Beyond introducing new products like the aforementioned insulin pump, Medtronic is strategically venturing into the development of digital technologies to enhance their client services, exemplified by their recent foray into AI implementation.
Moreover, Medtronic is actively pursuing a cost-cutting strategy with a strong emphasis on divesting certain assets. According to the CEO, this approach aims to yield savings amounting to $1 billion by the year 2025.
However, it’s important to acknowledge that Medtronic’s growth prospects are constrained within certain parameters. The potential for what could be termed “enormous growth” is limited, as the company’s avenue for expansion primarily rests on crafting more advanced devices than their competitors.
In my assessment, the forthcoming years’ growth trajectory will be inherently tied to the broader market expansion. While Medtronic can indeed innovate new technologies, the outcome remains somewhat unpredictable. Regardless, in a less optimistic scenario, the possibility of revenue growth remaining stable exists. This, in my view, sufficiently mitigates the potential downside risk associated with the stock.
Financials
Medtronic’s recent trajectory has been characterized by a lack of substantial growth; in fact, a careful examination of its financials reveals a pattern of stagnation and sluggish expansion. This trend becomes evident when observing its revenue figures, which have only grown by a modest 6.2% over the span of seven years. This lackluster growth is further mirrored in the declining trajectories of both the net operating margin and net income margin.
| Revenue | Operating Income | Net Operating %Margin | Net Income | Net Income %Margin | |
| 2017 | 29,710 | 6,110 | 20.6% | 4,028 | 13.6% |
| 2018 | 29,953 | 6,545 | 21.9% | 3,104 | 10.4% |
| 2019 | 30,557 | 6,709 | 22.0% | 4,631 | 15.2% |
| 2020 | 28,913 | 5,162 | 17.9% | 4,789 | 16.6% |
| 2021 | 30,117 | 5,490 | 18.2% | 3,606 | 12.0% |
| 2022 | 31,686 | 6,862 | 21.7% | 5,039 | 15.9% |
| 2023 | 31,227 | 5,679 | 18.2% | 3,758 | 12.0% |
| 2024 | 31,558 | 5,958 | 18.9% | 3,620 |
11.5% |
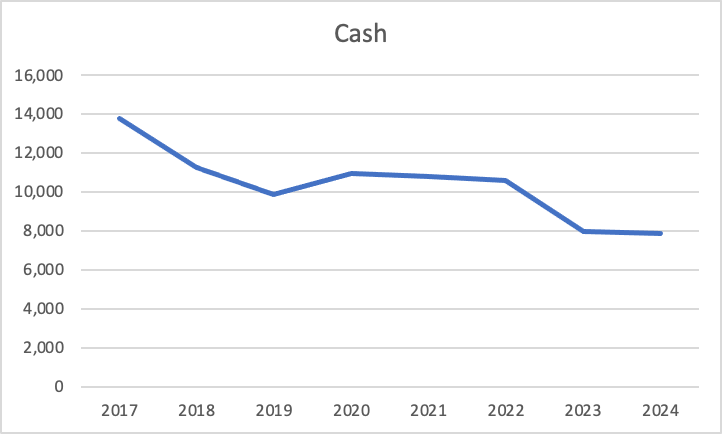
Turning attention to Medtronic’s balance sheet, a more sanguine perspective emerges. The consistent reduction in total debt over time is indicative that Medtronic has not transitioned into what could be described as a “zombie enterprise” or a similar scenario.
| Short-Term Debt | Long-Term Debt | Total Debt | Cash | ||
| 2017 | 6,176 | 25,909 | 32,085 | 2017 | 13,754 |
| 2018 | 1,000 | 23,698 | 24,698 | 2018 | 11,241 |
| 2019 | 500 | 24,476 | 24,976 | 2019 | 9,854 |
| 2020 | 2,446 | 21,976 | 24,422 | 2020 | 10,951 |
| 2021 | 195 | 26,316 | 26,511 | 2021 | 10,817 |
| 2022 | 3,724 | 20,316 | 24,040 | 2022 | 10,573 |
| 2023 | 187 | 24,287 | 24,474 | 2023 | 7,959 |
| 2024 | 519 | 24,463 | 24,982 | 2024 | 7,876 |
Debt Evolution (Author’s Calculation) Cash Evolution (Author’s Calculation)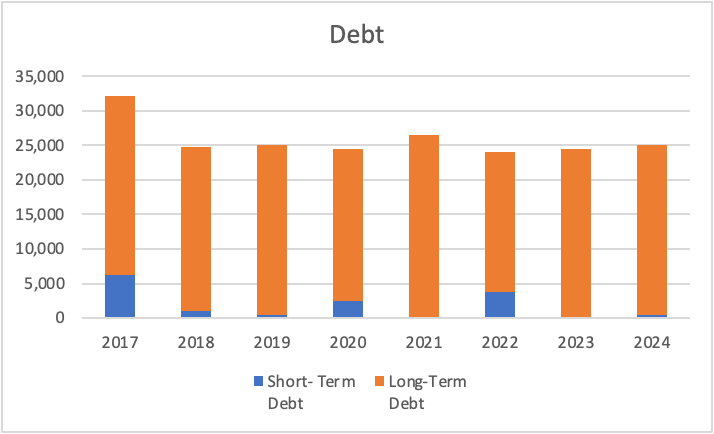
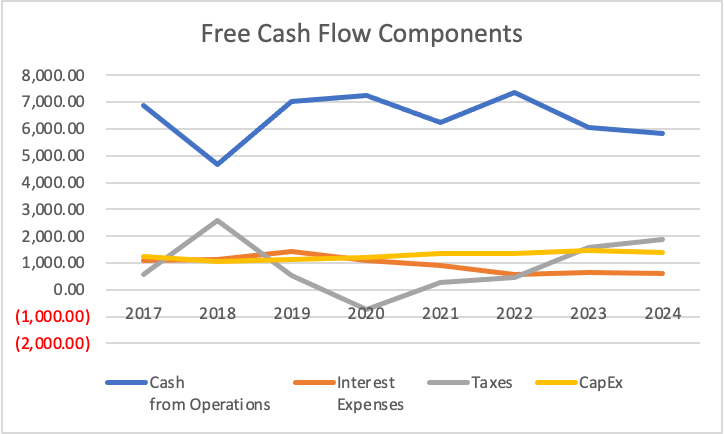
However, focusing on the realm of free cash flow reveals a more complex narrative. The free cash flow margin has undergone a notable reduction, nearly halving from its peak of 20.7% in 2017. This decline raises valid concerns. Nonetheless, it is noteworthy that the margin, despite its decline, remains relatively robust. Presently standing at 10.1%, it translates to a significant $3.1 billion in free cash flow.
| Cash from Operations | Interest Expenses | Taxes | CapEx | |
| 2017 | 6,880.00 | 1,094.00 | 578.00 | 1,254.00 |
| 2018 | 4,684.00 | 1,146.00 | 2,580.00 | 1,068.00 |
| 2019 | 7,007.00 | 1,444.00 | 547.00 | 1,134.00 |
| 2020 | 7,234.00 | 1,092.00 | (751.00) | 1,213.00 |
| 2021 | 6,240.00 | 925.00 | 265.00 | 1,355.00 |
| 2022 | 7,346.00 | 553.00 | 456.00 | 1,368.00 |
| 2023 | 6,039.00 | 636.00 | 1,580.00 | 1,459.00 |
| 2024 | 5,831.00 | 620.00 | 1,868.00 | 1,387.00 |
Free Cash Flow (Author’s Calculation) FCF Components (Author’s Calculations)
| Free Cash Flow | Margin % | |
| 2017 | 6,142.00 | 20.7% |
| 2018 | 2,182.00 | 7.3% |
| 2019 | 6,770.00 | 22.2% |
| 2020 | 7,864.00 | 27.2% |
| 2021 | 5,545.00 | 18.4% |
| 2022 | 6,075.00 | 19.2% |
| 2023 | 3,636.00 | 11.6% |
| 2024 | 3,196.00 | 10.1% |
Valuation
Next, the calculations involve determining depreciation and amortization (D&A) as well as Interest expenses based on revenue-related margins. Specifically, Medtronic allocates 8.39% of its revenue to D&A and 1.93% to interest payments.
| Revenue | Net Income | Plus Taxes | Plus D&A | Plus Interest | |
| 2023 | $32,180.00 | $4,312.12 | $5,779.97 | $8,480.97 | $9,100.97 |
| 2024 | $33,650.00 | $4,509.10 | $6,044.00 | $8,868.38 | $9,516.70 |
| 2025 | $36,426.13 | $4,881.10 | $6,542.63 | $9,600.02 | $10,301.83 |
| 2026 | $39,431.28 | $5,283.79 | $7,082.39 | $10,392.02 | $11,151.73 |
| 2027 | $42,684.36 | $5,719.70 | $7,666.69 | $11,249.37 | $12,071.75 |
| 2028 | $46,205.82 | $6,191.58 | $8,299.19 | $12,177.44 | $13,067.67 |
| ^Final EBITA^ |
Next, the calculations involve determining depreciation and amortization (D&A) as well as Interest expenses based on revenue-related margins. Specifically, Medtronic allocates 8.39% of its revenue to D&A and 1.93% to interest payments.
| D&A Projection | Interest Projection | |
| 2023 | 2,701.000 | 620.00 |
| 2024 | 2,824.383 | 648.32 |
| 2025 | 3,057.395 | 701.81 |
| 2026 | 3,309.630 | 759.71 |
| 2027 | 3,582.674 | 822.38 |
| 2028 | 3,878.245 | 890.23 |
Subsequently, I present the assumptions table, which is populated with the most current data. This table forms an essential component for the calculation of the Weighted Average Cost of Capital (WACC).
Assumptions 1 (Author’s Calculations) DCF 1 (Author’s Calculations) Results 1 (Author’s Calculations)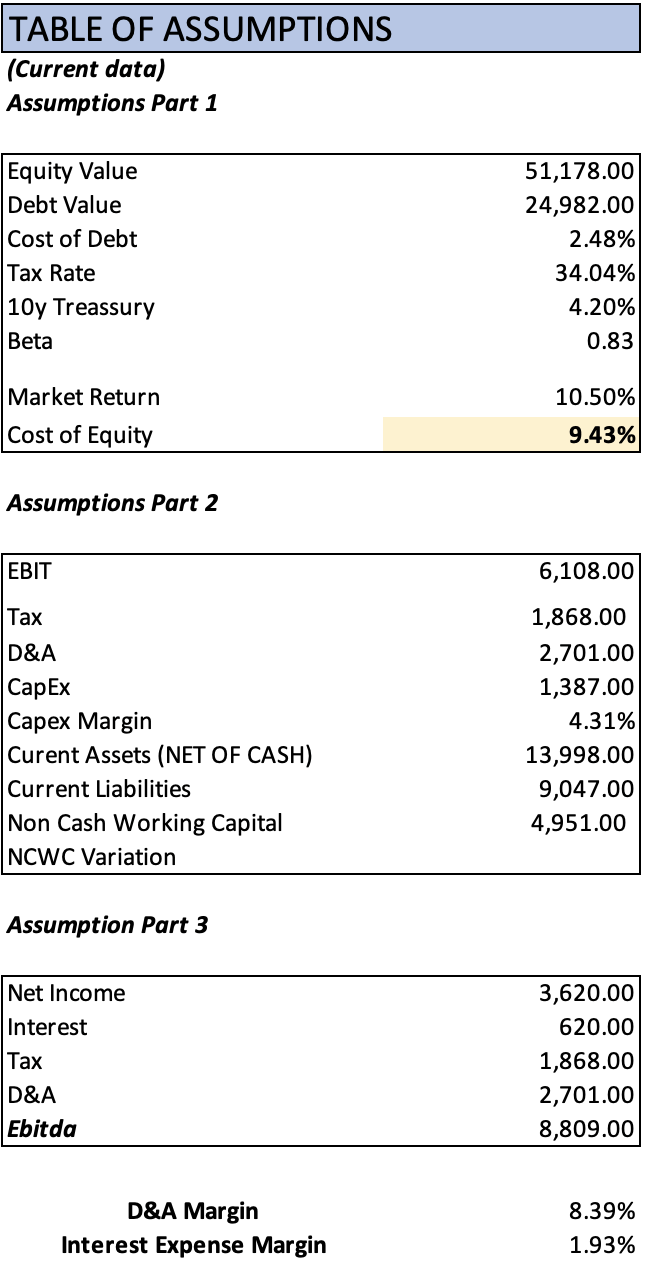
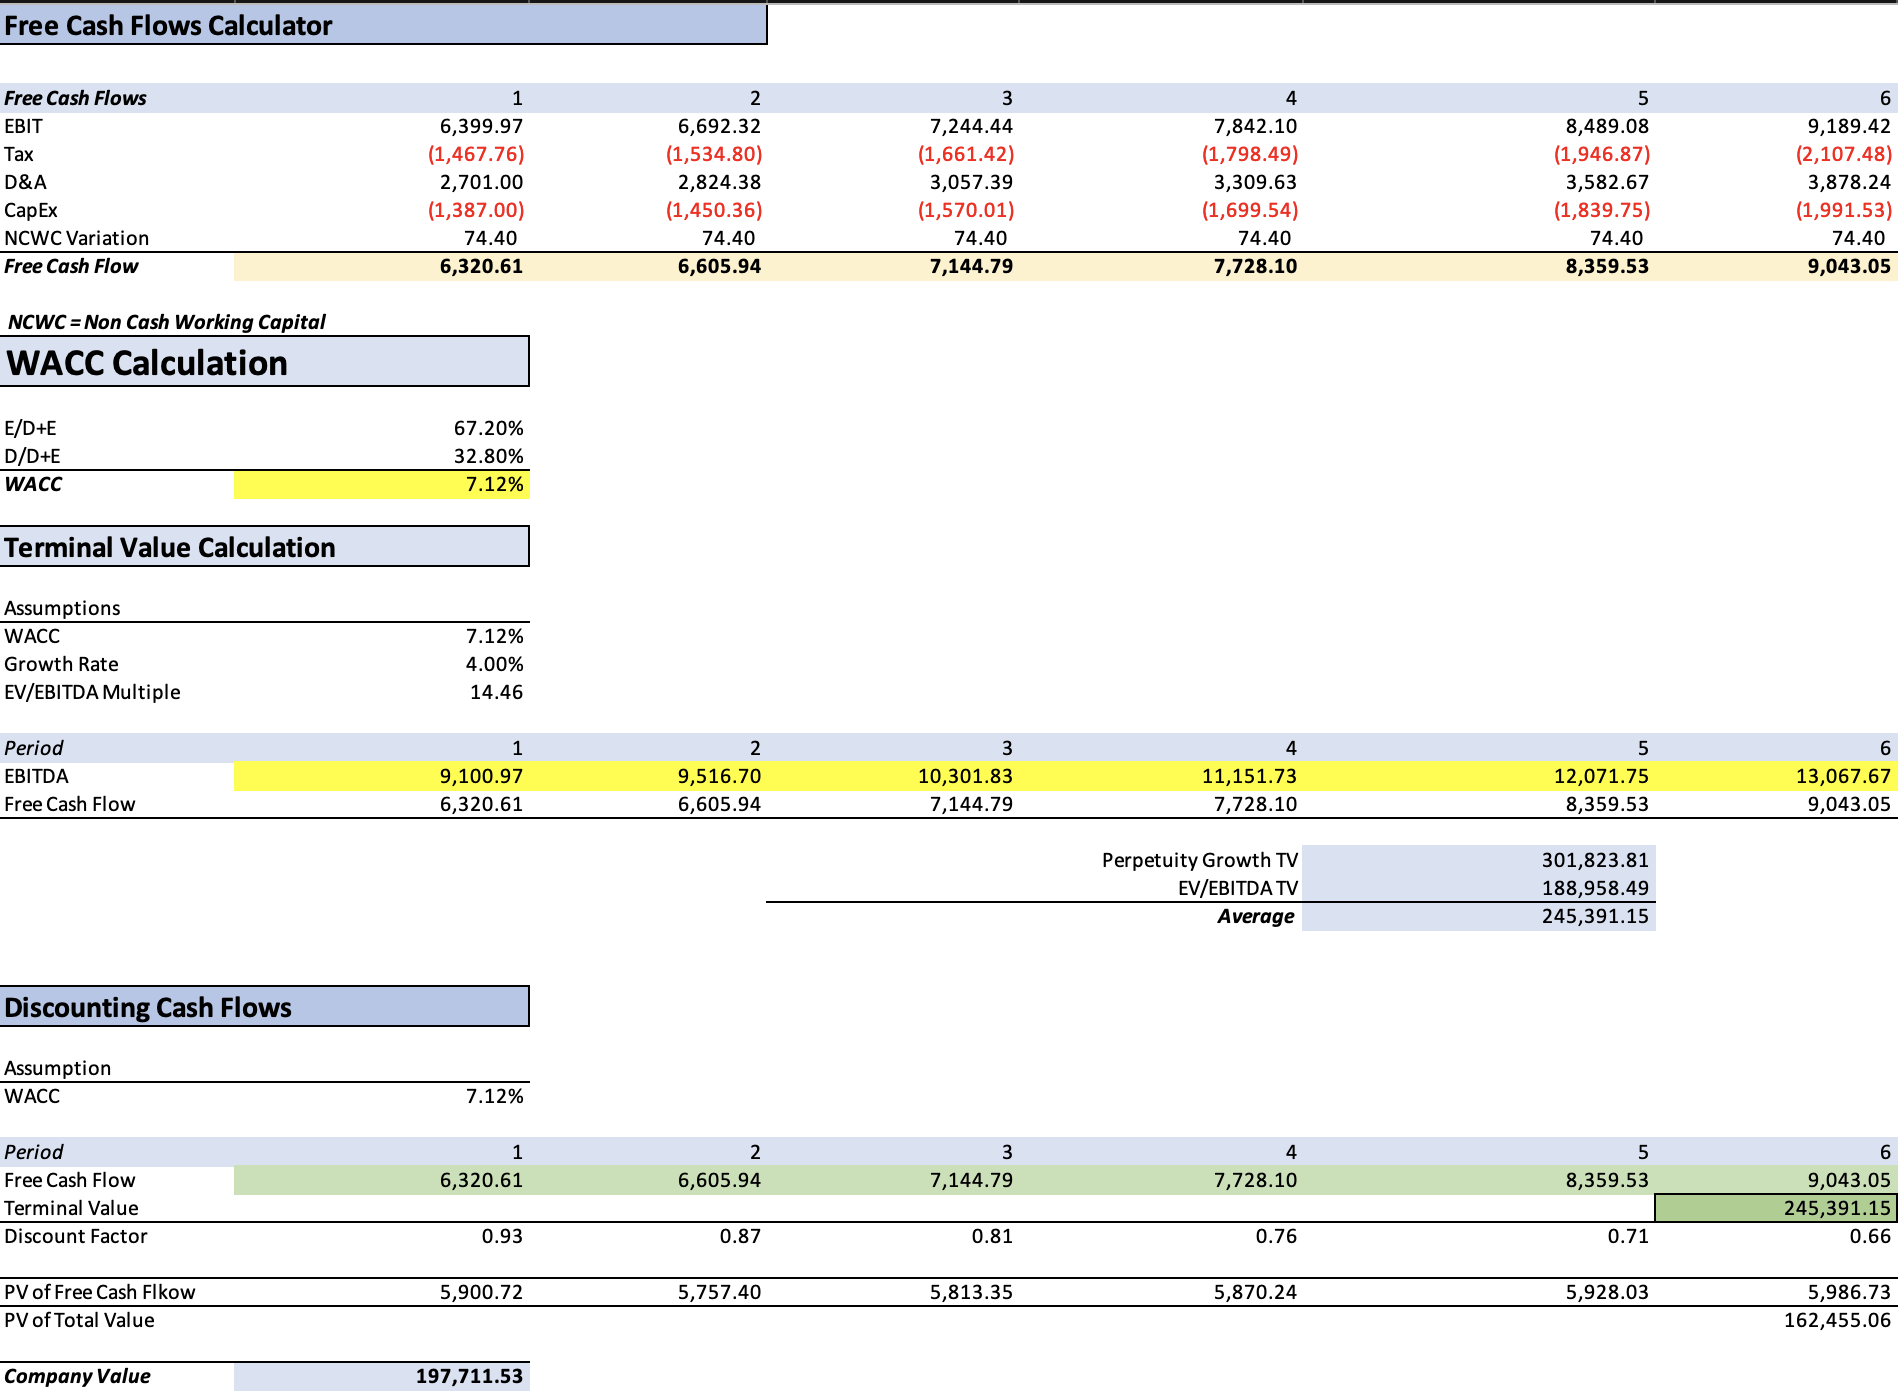
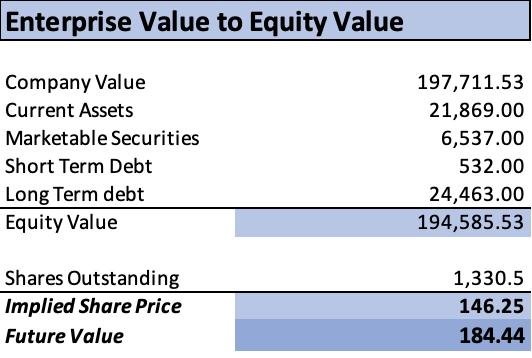
Upon examining the calculations, it becomes evident that the suggested present intrinsic value stands at $146.25 per share. This implies a significant upside potential of 80%, with a corresponding future value upside of 127%. This latter figure suggests a prospective annual return of approximately 21%. However, it’s important to exercise caution as this represents the uppermost estimate.
Now, let’s explore the next scenario-a scenario that assumes a more plausible revenue growth rate of 4.5% extending up until 2028. This projection appears to be grounded in greater realism compared to the previous one. From my perspective, achieving this second scenario is within the grasp of Medtronic, especially considering the ongoing trend of an aging global population.
| Revenue | Net Income | Plus Taxes | Plus D&A | Plus Interest | |
| 2023 | $32,180.00 | $4,312.12 | $5,779.97 | $8,480.97 | $9,100.97 |
| 2024 | $33,650.00 | $4,509.10 | $6,044.00 | $8,868.38 | $9,516.70 |
| 2025 | $35,164.25 | $4,712.01 | $6,315.98 | $9,267.46 | $9,944.95 |
| 2026 | $36,746.64 | $4,924.05 | $6,600.20 | $9,684.49 | $10,392.48 |
| 2027 | $38,400.24 | $5,145.63 | $6,897.21 | $10,120.30 | $10,860.14 |
| 2028 | $40,128.25 | $5,377.19 | $7,207.58 | $10,575.71 | $11,348.85 |
| ^Final EBITA^ |
| D&A Projection | Interest Projection | |
| 2023 | 2,701.000 | 620.00 |
| 2024 | 2,824.383 | 648.32 |
| 2025 | 2,951.480 | 677.50 |
| 2026 | 3,084.297 | 707.98 |
| 2027 | 3,223.090 | 739.84 |
| 2028 | 3,368.129 | 773.14 |
DCF 2 (Author’s Calculations) Results 2 (Author’s Calculations)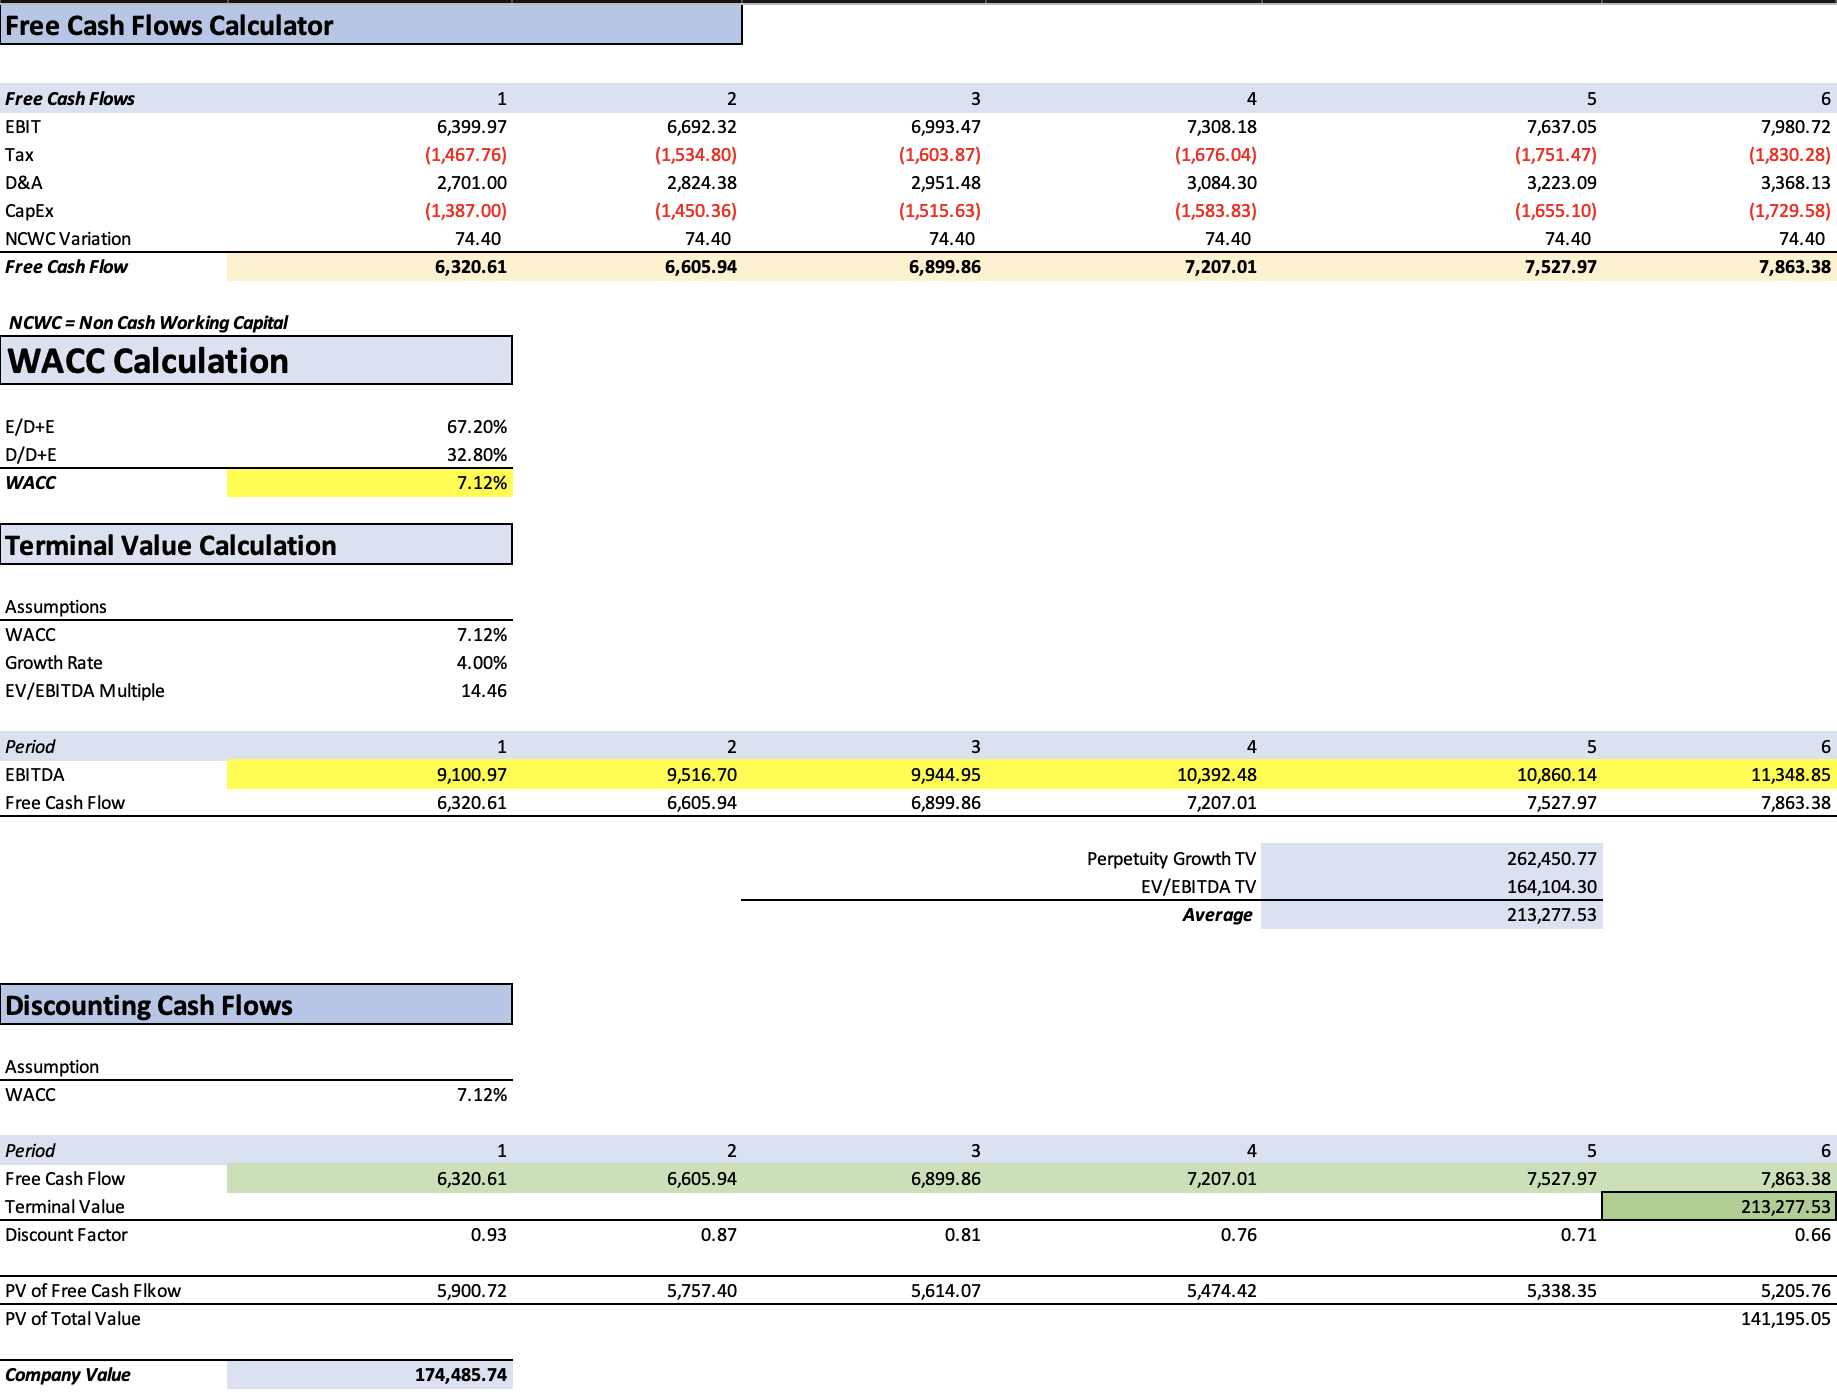

Ultimately, this scenario translates into a stock price target of 58%, coupled with a future value projection of 97%, indicating a compelling annual return of 16%. Both scenarios offer attractive double-digit returns. In my assessment, the latter target holds more weight, given the increased likelihood of its realization compared to the earlier estimate.
In the wake of its peak in September 2021 at $134, Medtronic’s stock price has undergone a decline of approximately 39%. This decline potentially presents a substantial opportunity for Medtronic’s resurgence. Furthermore, it’s worth noting that Medtronic offers an appealing dividend yield of 3.37%. As mentioned before, even in a less favorable scenario where revenue growth remains static, investors would still have benefited from the dividend yield of 3.37%.
Risks to Thesis
The primary macro risk to this thesis lies in the realm of intense competition. For instance, Medtronic’s diabetes business faced fierce rivalry from entities like DexCom, Inc. (DXCM) and Abbott Laboratories (ABT). Although the competition momentarily receded when Abbott Laboratories had to recall certain units of its diabetic devices, and DexCom’s smaller size places it at a disadvantage in a price war against Medtronic, the episode underscores the fierce nature of the competition within the medical device market. This landscape often demands years of effort to surge ahead of rivals, and the protracted FDA approval timelines only exacerbate the challenges.
Another facet of risk pertains to business-related factors. Should Medtronic fail to attain the projected 4.5% revenue growth rate, it could perpetuate the problem of stagnant revenue into the foreseeable future.
In my assessment, this stock is a compelling opportunity, primarily due to its substantial 39% decline from its peak. Coupled with the promising future prospects of the markets it operates within, there is a significant potential for achieving the envisaged 4.5% growth rate, which stands as a feasible and sustainable trajectory.
Conclusion
In conclusion, the assessment of Medtronic’s current state and future potential reveals a nuanced landscape defined by both opportunities and challenges. While the company has faced recent periods of stagnation and formidable competition, its strategic initiatives and market dynamics provide a foundation for optimism.
Medtronic’s multifaceted approach to growth includes the introduction of innovative products like the MiniMed 780G insulin pump, as well as a strategic focus on digital technologies and cost-cutting measures. These strategies align with the evolving healthcare landscape and position the company for renewed expansion.
Considering the intricacies of revenue growth, Medtronic’s potential scenarios offer contrasting narratives. The ambitious projection of an 8.25% growth rate, while compelling, relies on factors that might prove uncertain. On the other hand, the more conservative estimate of 4.5% growth until 2028 appears grounded in market realities and the company’s capacity to adapt to changing trends, such as the aging global population.
The dynamics of competition, typified by Medtronic’s tussle with rivals in the diabetes sector, underline the industry’s cutthroat nature. The journey to outpace competitors and secure regulatory approvals often demands perseverance, strategic prowess, and the ability to innovate consistently.
Amidst these considerations, Medtronic’s stock price trajectory presents an intriguing prospect. The decline of approximately 39% from its peak, coupled with promising future market trends, underscores the company’s potential for revitalization. Even if the aggressive growth scenarios prove elusive, Medtronic’s solid dividend yield offers a degree of downside protection.
In the grand scheme, Medtronic emerges as a company at the crossroads of its growth trajectory. While challenges persist, the convergence of strategic initiatives, market potential, and the opportunity to capitalize on technological advancements places Medtronic in a position to navigate the complexities of the medical device landscape. The prudent course forward involves a balanced outlook, recognizing the potential while being mindful of the industry’s intricacies and the company’s adaptive capabilities.
Analyst’s Disclosure: I/we have no stock, option or similar derivative position in any of the companies mentioned, but may initiate a beneficial Long position through a purchase of the stock, or the purchase of call options or similar derivatives in MDT over the next 72 hours. I wrote this article myself, and it expresses my own opinions. I am not receiving compensation for it (other than from Seeking Alpha). I have no business relationship with any company whose stock is mentioned in this article.
Seeking Alpha’s Disclosure: Past performance is no guarantee of future results. No recommendation or advice is being given as to whether any investment is suitable for a particular investor. Any views or opinions expressed above may not reflect those of Seeking Alpha as a whole. Seeking Alpha is not a licensed securities dealer, broker or US investment adviser or investment bank. Our analysts are third party authors that include both professional investors and individual investors who may not be licensed or certified by any institute or regulatory body.