
Summary:
- Meta bottomed in November at a 64% historical discount and just 4.2X cash-adjusted earnings.
- Layoff announcements and general market bullishness has sent Meta up 117% in four months.
- Meta remains almost 30% undervalued, trading at 9X cash-adjusted earnings. Cost cutting is expected to return it to strong growth in the coming years.
- Meta could almost double in the next three years if it grows as expected. If you think Zuckerberg’s Metaverse plans will work, it’s a potentially strong buy.
- Long-term, a shrinking user base, falling revenue per user, and 9% growth make it a poor alternative to superior growth stocks like AAPL, MSFT, and AVGO. If Meta started paying a dividend, it could boost its return potential by 20% and become a far more attractive investment.
dikushin
This article was published on Dividend Kings on Tuesday, March 14th
—————————————————————————–
After a horrific year for tech in 2022, Wall Street’s former darlings are once more the belle of the ball.
Ycharts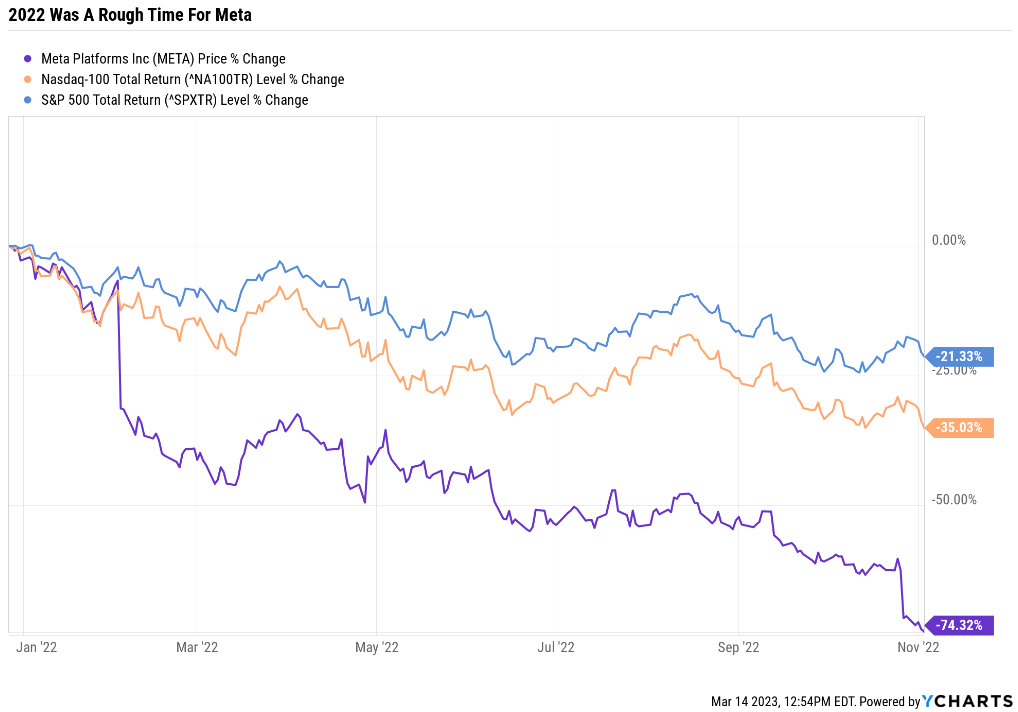
This is what happens when high PE growth names run into growth headwinds and rates soar.
Ycharts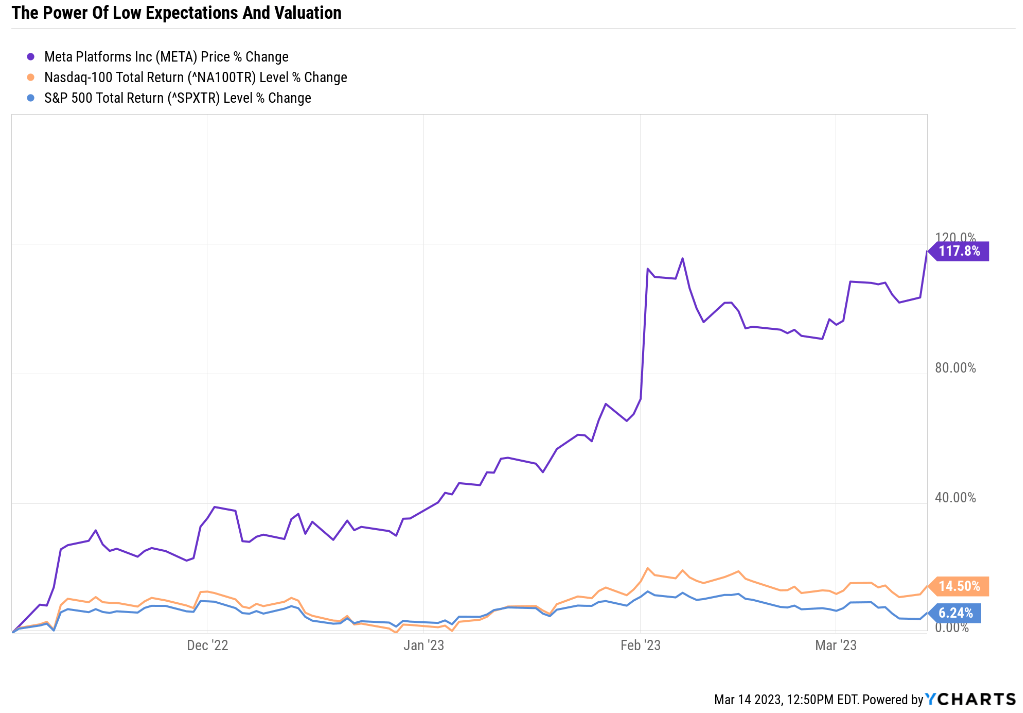
And this is what happens when a former growth darling becomes a deep-value stock.
How undervalued was Meta (NASDAQ:META) at its November 3rd low?
- $88 = 9.1X earnings
- 4.2X cash-adjusted earnings
For context, private equity firms try to buy companies at 11X to 12X cash-adjusted earnings.
Meta’s historical fair value for 2023 was $259 based on 2023 estimates, and it was trading at $88.
- a 64% discount to historical fair value
Is it any wonder now that Zuckerberg is getting religion on cost controls and has stopped pushing his metaverse dream that Meta has more than doubled?
Rolling Returns Since 2012
Portfolio Visualizer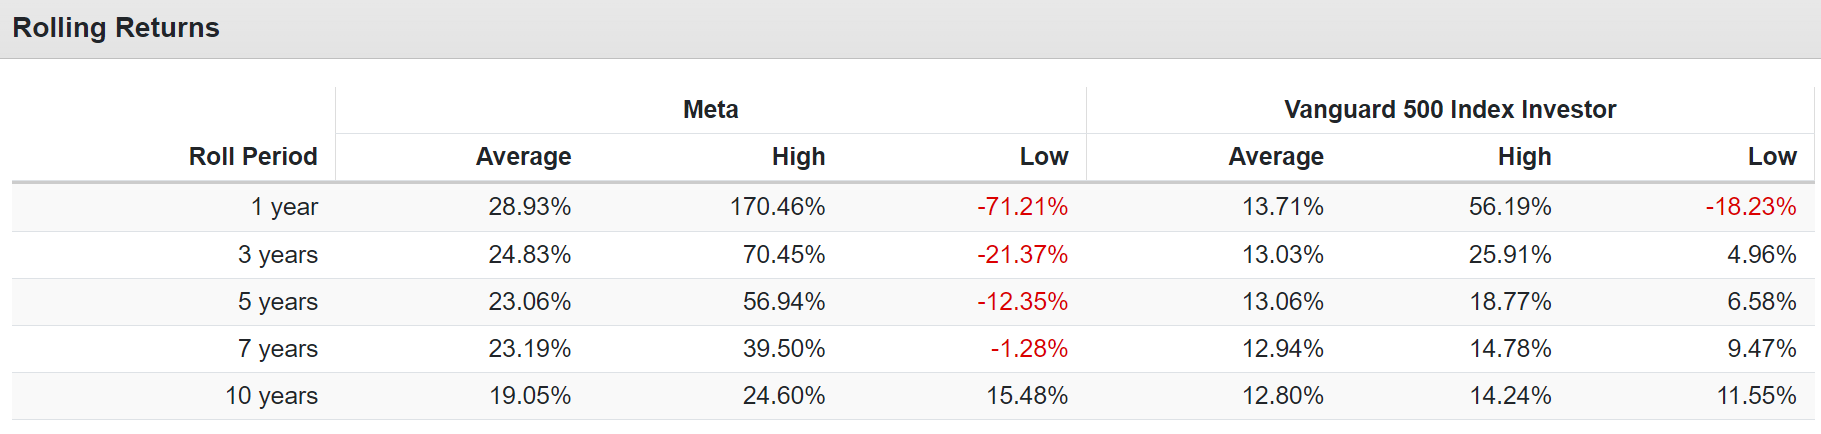
Meta is a company that is capable of 170% 12-month returns off bear market lows.
Wait a second? If Meta was 64% undervalued and is up 117%, doesn’t that mean it’s undervalued?
Yes, Meta is likely still very undervalued.
- 12-month forward fair value: $269.92
- current price: $192.66
- historical discount: 29%
- DK quality score: 84% medium-risk 11/13 SWAN
- DK rating: potential strong buy
FAST Graphs, FactSet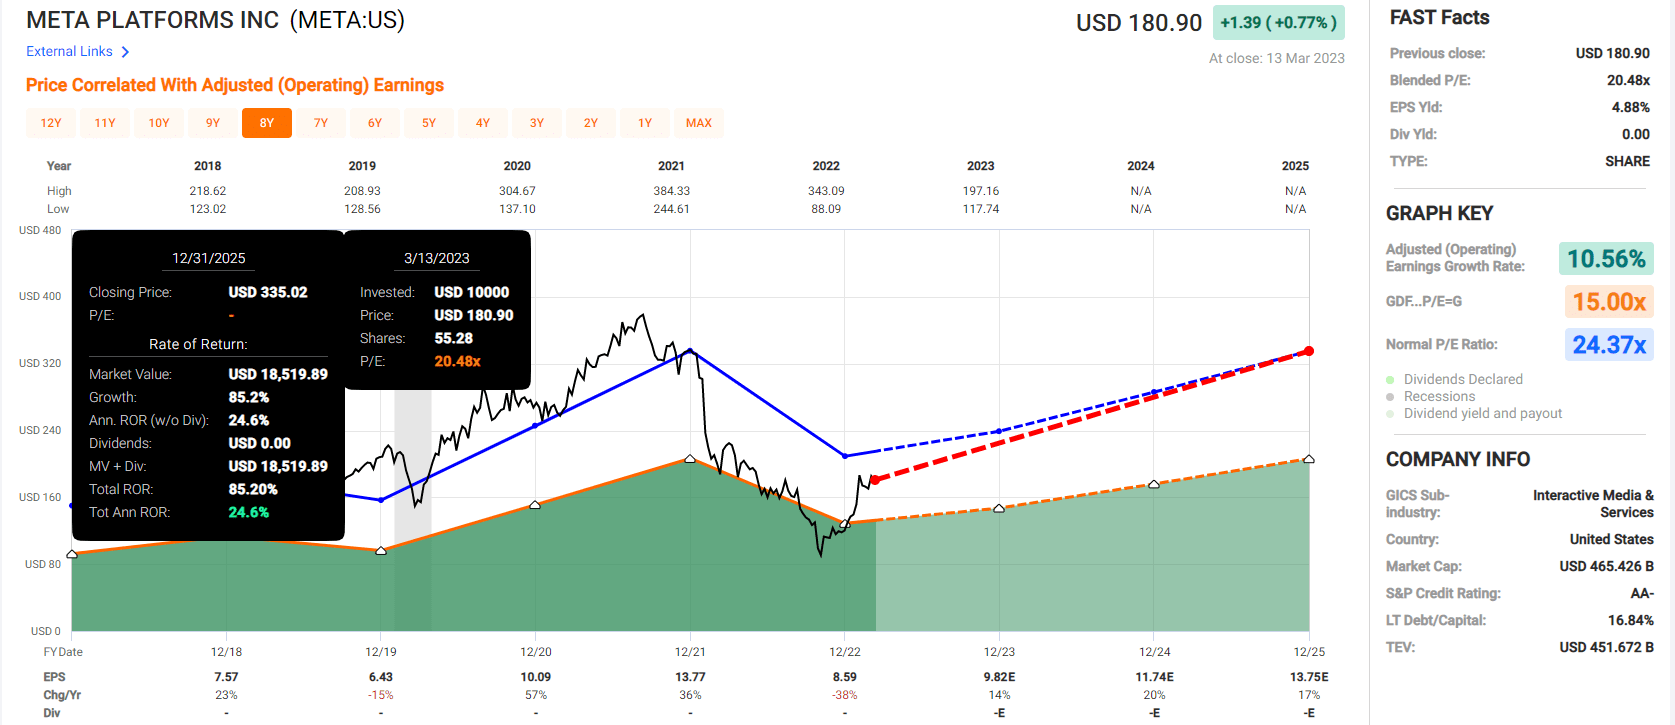
Even growing at high single or low double-digits the market has historically valued Meta at about 24X earnings, and today it trades at 20X.
- 9.0X cash-adjusted earnings
- still a bargain by private equity standards
Several Dividend Kings members have asked me to review whether Meta is a good long-term growth stock to potentially combine with high-yield blue-chips to generate superior income growth over time.
Its valuation is certainly still attractive, and its short-term growth prospects appear solid, thanks to another round of layoffs and strict cost-cutting.
The good news is that Meta, even after doubling, has the potential to double again within three years. That’s how undervalued it was.
But before you get too excited and back up the truck on Meta, you should know its deep dark secret.
Why My $2 Million Family Hedge Fund Owns Very Little Of Meta
Morningstar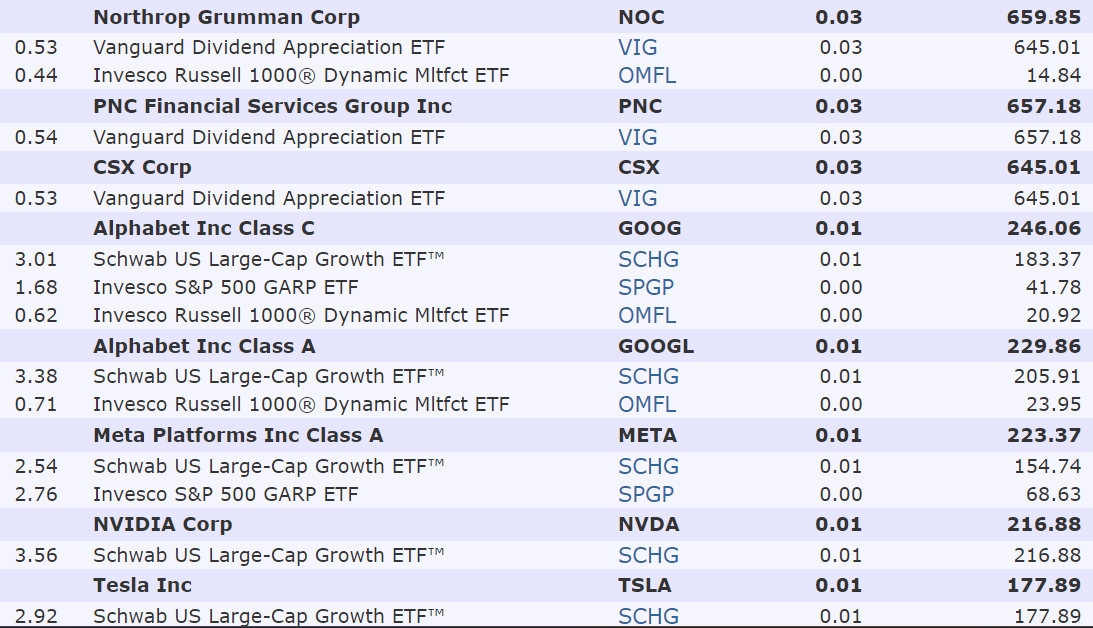
Currently, my family hedge fund owns $223 worth of Meta.
Eventually, we’ll own about a 0.33% position.
- Because SCHG and SPGP own about 2.6% each
Morningstar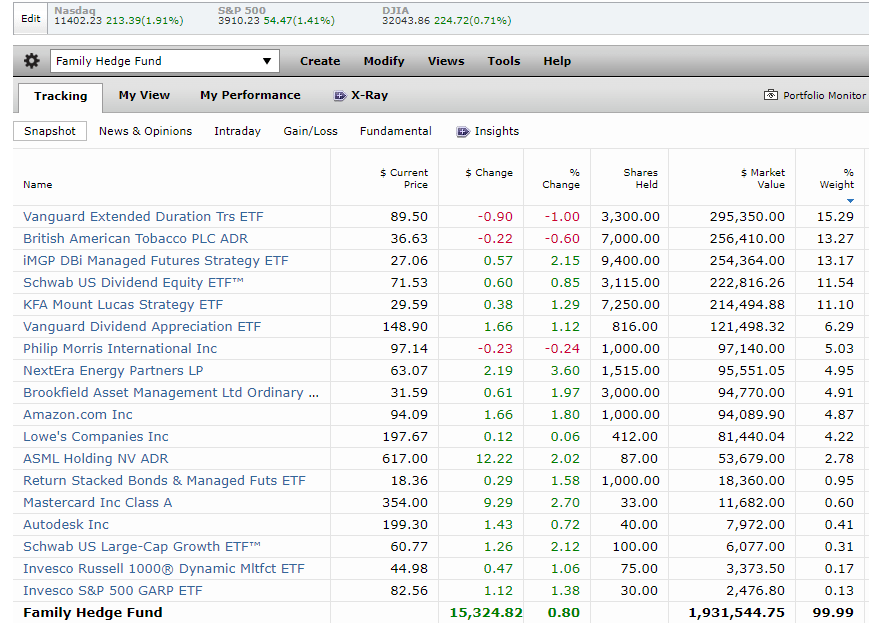
It will take a few years for my family hedge fund to match the Dividend Kings’ ZEUS Income growth portfolio, which looks like this.
DK ZEUS Portfolio Tracker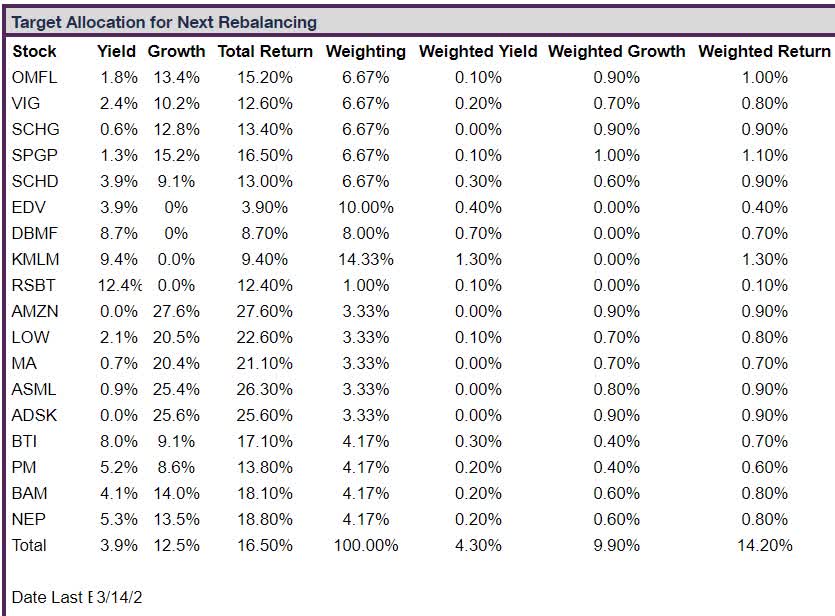
To pay medical bills, we had to overweight value and high-yield stocks, and I’m buying growth over time per a set schedule. We’re also very likely headed for recession and a debt ceiling crisis, so we are building up our bond position.
I use 50% of our weekly DCA budget to buy bonds and 50% for whichever blue-chip our spreadsheet says to buy next.
- currently, 40% hedges
- 40% value
- 20% growth (on the way to 33%)
If my family’s medical bill issues didn’t exist, I would have the above portfolio, and we’d own about $6,400 worth of Meta.
I’m not interested in owning more than that, and here’s why.
The Good News About Meta
First, the good news for Meta owners.
FactSet Research Terminal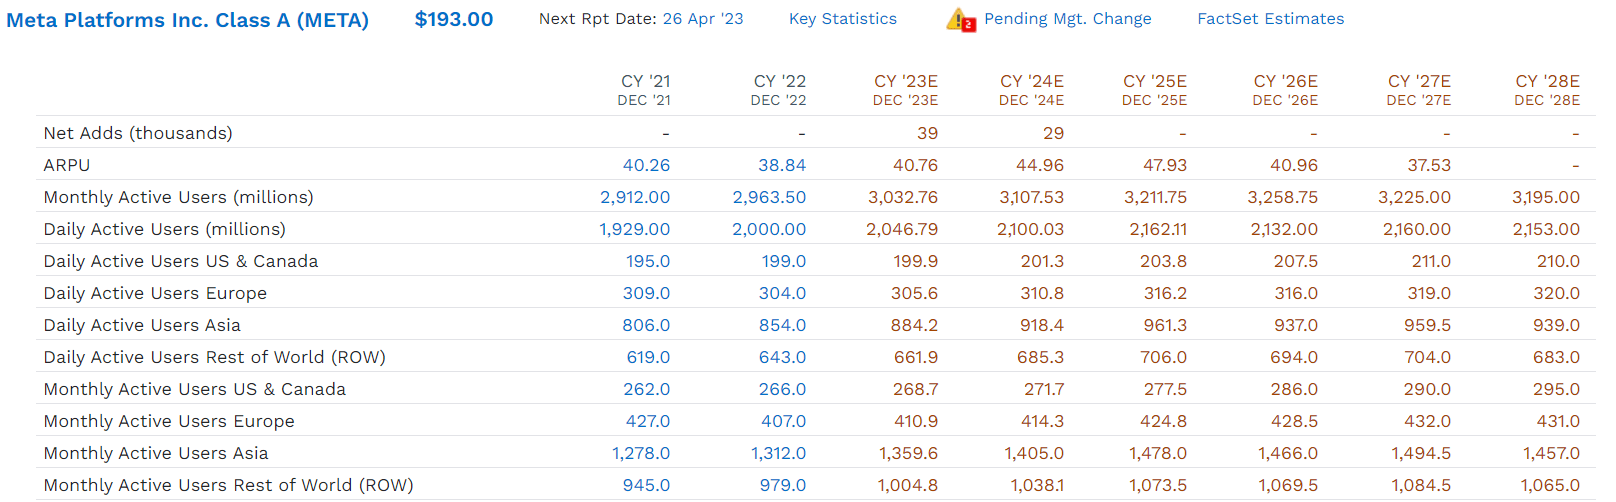
Meta managed to grow its user base by 1.8% in 2022. And slow but steady growth is expected through 2026.
Daily active users are expected to grow modestly through 2027.
And average revenue per user, or ARPU, is expected to grow through 2025.
Meta Medium-Term Growth Consensus
| Year | Sales | Free Cash Flow | EBITDA | EBIT (Operating Income) | Net Income |
| 2022 | $116,609 | $18,439 | $53,358 | $28,819 | $23,200 |
| 2023 | $122,208 | $17,559 | $54,868 | $31,862 | $25,459 |
| 2024 | $136,087 | $24,012 | $62,377 | $37,006 | $29,870 |
| 2025 | $151,045 | $28,891 | $72,877 | $43,280 | $34,838 |
| 2026 | $166,218 | $34,587 | $81,755 | $50,505 | $40,274 |
| 2027 | $183,610 | $39,490 | $89,590 | $56,127 | $45,107 |
| 2028 | $193,678 | $43,913 | $98,936 | $61,206 | $49,467 |
| Annualized Growth 2022-2028 | 8.82% | 15.56% | 10.84% | 13.38% | 13.45% |
| Cumulative 2023-2027 | $952,846 | $188,452 | $460,403 | $279,986 | $225,015 |
(Source: FactSet Research Terminal)
Meta’s sales are expected to grow about 9% through 2028 driving impressive free cash flow growth of almost 16%.
Meta Margin Consensus Forecast
| Year | FCF Margin | EBITDA Margin | EBIT (Operating) Margin | Net Margin |
| 2022 | 15.8% | 45.8% | 24.7% | 19.9% |
| 2023 | 14.4% | 44.9% | 26.1% | 20.8% |
| 2024 | 17.6% | 45.8% | 27.2% | 21.9% |
| 2025 | 19.1% | 48.2% | 28.7% | 23.1% |
| 2026 | 20.8% | 49.2% | 30.4% | 24.2% |
| 2027 | 21.5% | 48.8% | 30.6% | 24.6% |
| 2028 | 22.7% | 51.1% | 31.6% | 25.5% |
| Annualized Growth 2022-2028 | 6.19% | 1.85% | 4.18% | 4.25% |
(Source: FactSet Research Terminal)
Thanks to stricter cost controls, including 10,000 more layoffs and putting 5,000 new hires on hold, margins are expected to rise steadily, especially free cash flow margins.
- By 2028 Meta’s free cash flow margins are expected to be what Apple’s (AAPL) is today
But Meta is also taking a page out of the Apple playbook with lots of buybacks.
Meta Buyback Consensus
| Year | Consensus Buybacks ($ Millions) | % Of Shares (At Current Valuations) | Market Cap |
| 2022 | $27,956 | 5.6% | $501,770 |
| 2023 | $18,906 | 3.8% | $501,770 |
| 2024 | $16,516 | 3.3% | $501,770 |
| 2025 | $21,181 | 4.2% | $501,770 |
| 2026 | $20,930 | 4.2% | $501,770 |
| 2027 | $22,979 | 4.6% | $501,770 |
| 2028 | $25,331 | 5.0% | $501,770 |
| Total 2023 through 2028 | $125,843 | 25.1% | $501,770 |
| Annualized Rate | 4.68% | Average Annual Buybacks | $20,974 |
| 1% Buyback Tax | $1,258 | Average Annual Buyback Tax | $210 |
(Source: FactSet Research Terminal)
Meta is expected to average $21 billion worth of buybacks over the next six years, enough to repurchase 25% of its stock at current valuations potentially.
So that should mean Meta’s FCF/share will grow close to 20% per year, right? Think again.
The Bad News? Those Buybacks Don’t Mean What You Think
Let’s consider Meta’s FCF/share consensus estimates to see how much value those $125 billion buybacks are expected to generate for shareholders.
(Source: FactSet Research Terminal)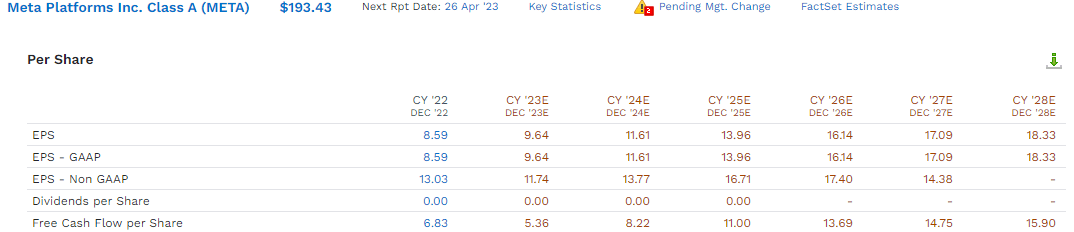
- 2022 FCF/share: $6.83
- 2028 consensus FCF/share: $15.90
- annualized growth: 15.1%
- FCF growth consensus: 15.6%
- annual buyback boost: -0.5%
How can a company buy back almost 5% of its stock each year and have negative value accretion from buybacks?
Morningstar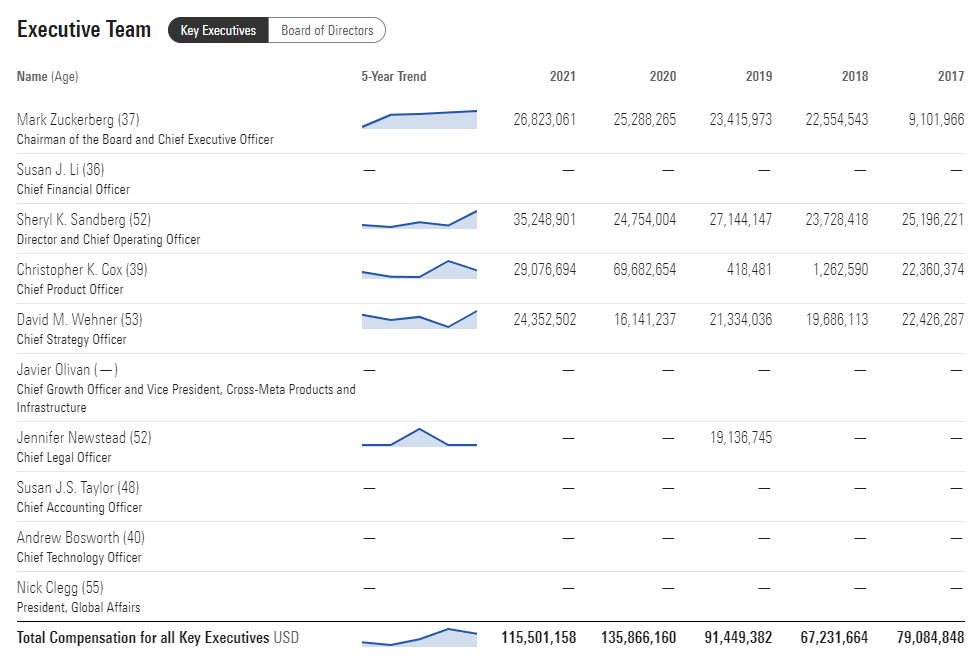
Meta’s executive team makes over $100 million annually, almost all in stock.
- Compensation growth 2017 to 2021: 7.8%
Morningstar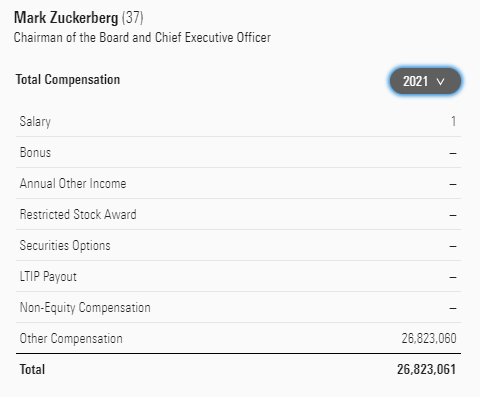
In fact, Zuckerberg earned just $1 in 2021 and was paid entirely in stock.
And it’s not just Meta’s CEO.
Morningstar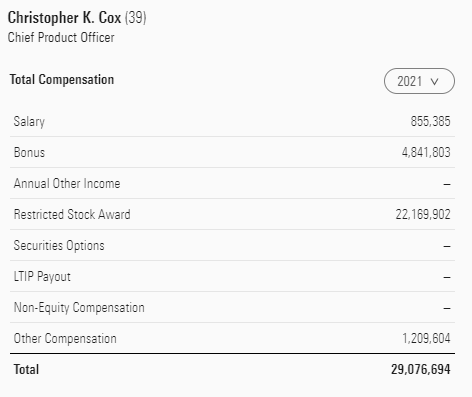
All of Meta’s executives earn most of their generous compensation in stock.
Morningstar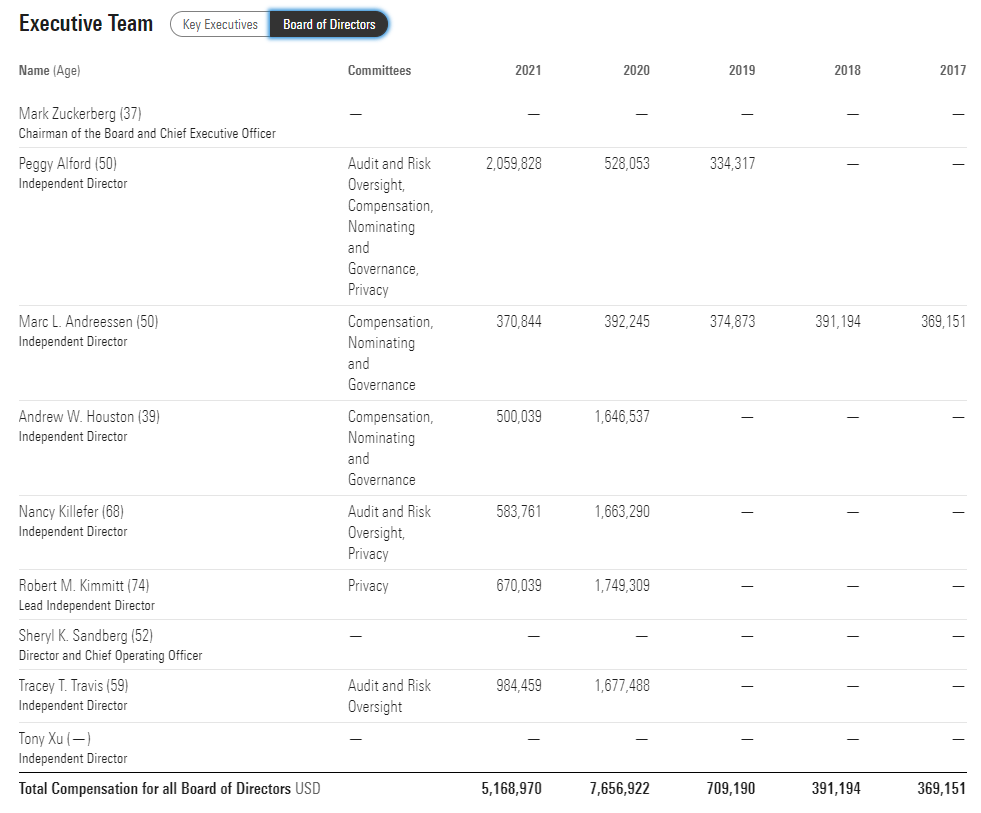
The same is true of its board of directors, including several executives who get paid twice.
- 2017 to 2021 board compensation growth: 69%
Morningstar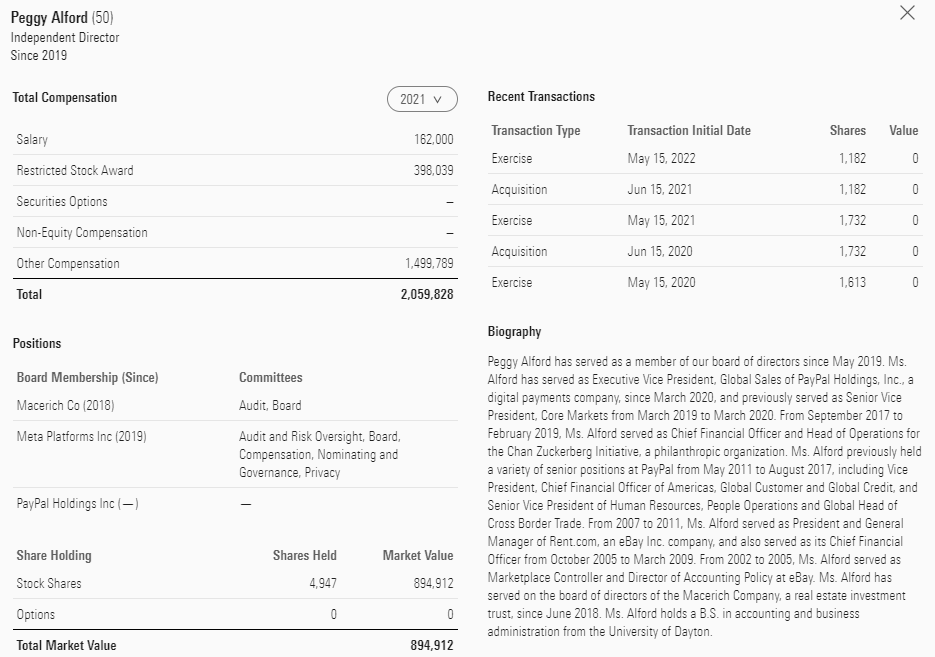
And board members are also paid mostly in stock.
In total, the top executives and board of Meta are paid over $120 million, almost all in stock.
And that’s just the top brass.
Statista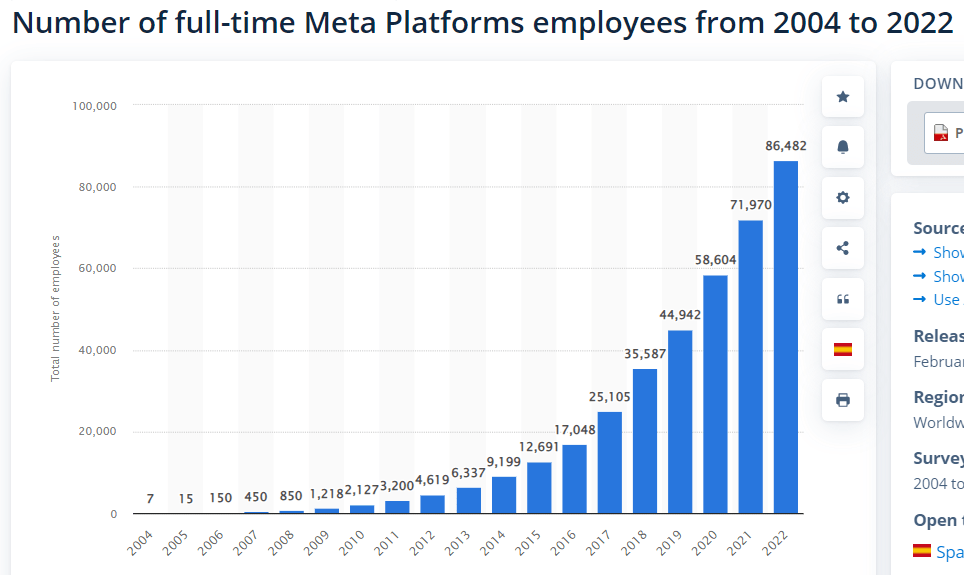
Even with 10,000 planned layoffs, Meta will employ 76,000 people, 75% more than pre-pandemic levels.
Comparably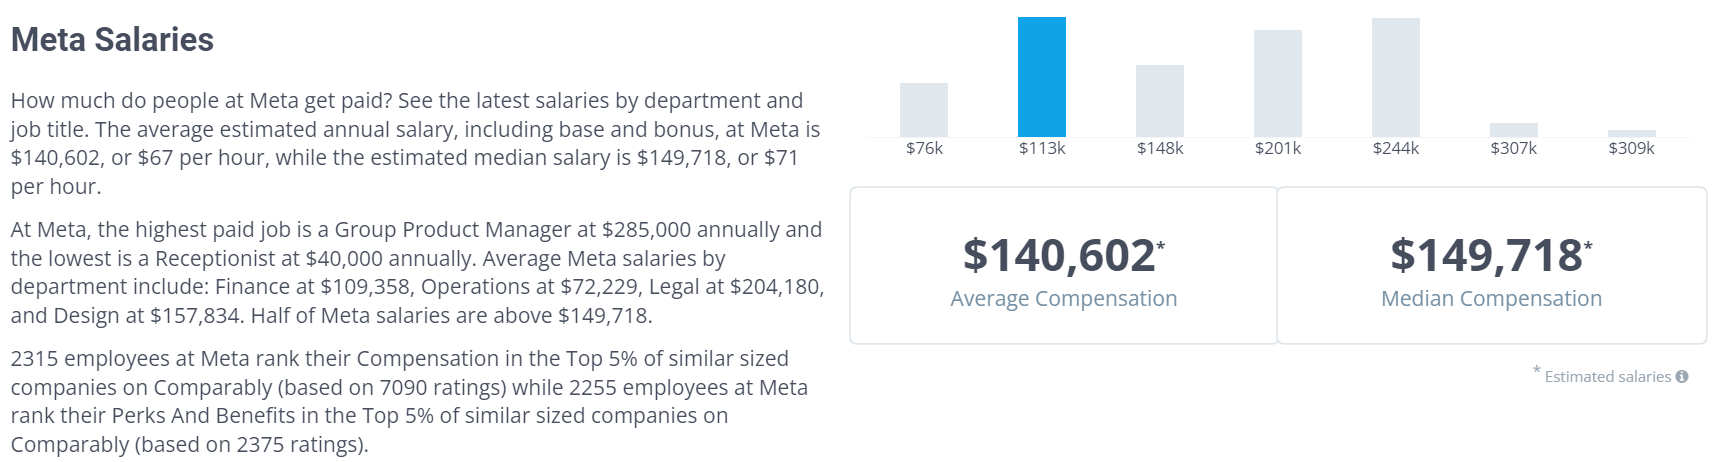
The median pay at Meta is about $150,000.
But that’s just the salary.
Comparably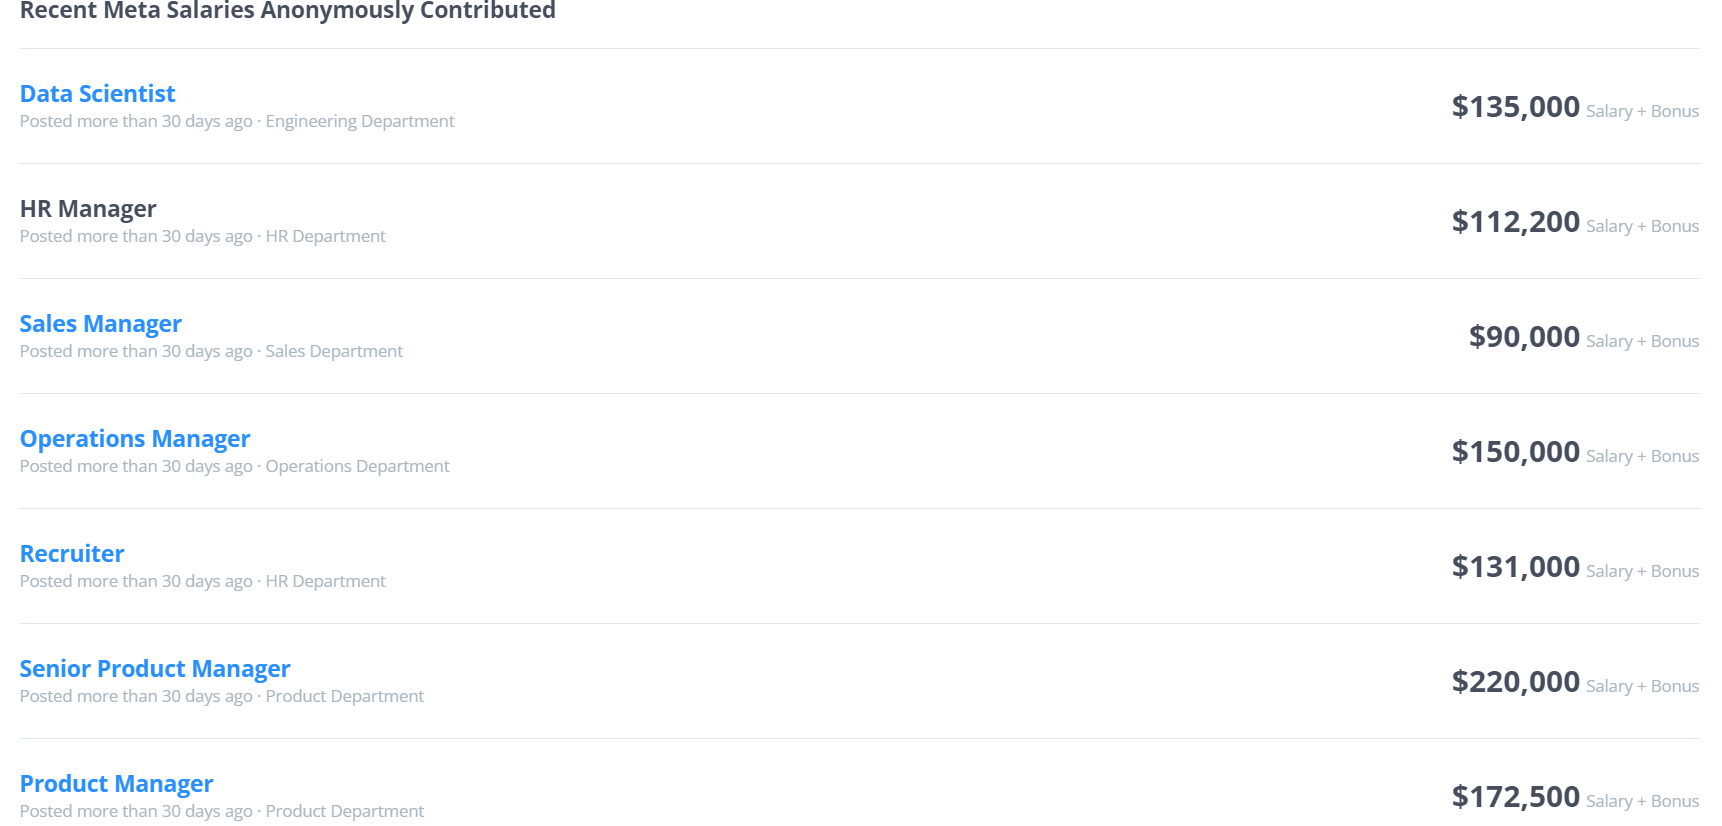
On top of competitive salaries, about 77% of Meta employees also get paid bonuses. And guess what form those take? Yes, stock options.
Macrotrends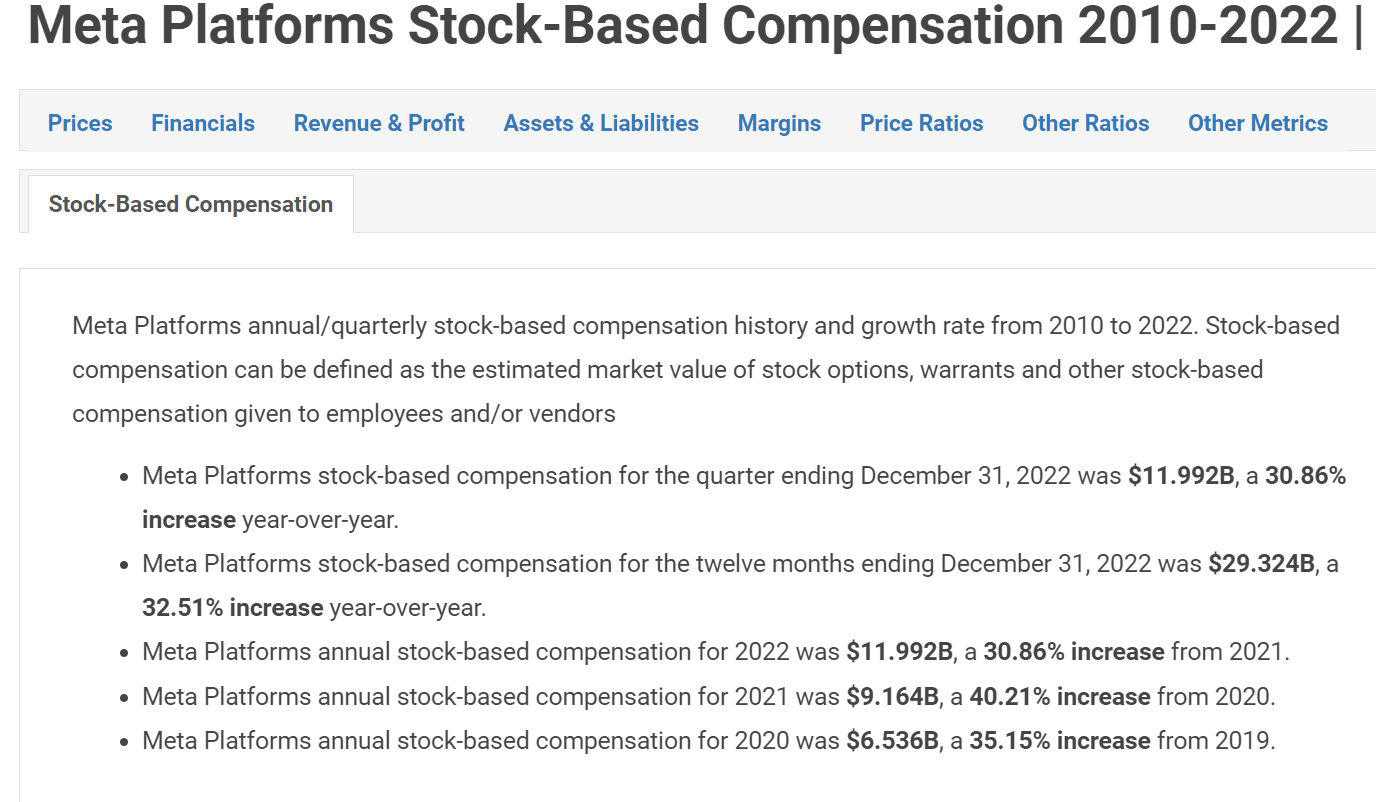
In 2022, Meta paid out $12 billion in stock to its employees.
- 99% of stock awards go to non-executives
I have nothing against employing a lot of people and paying them handsomely. I myself make 50% more than the President of the United States.
But the point is that Meta’s buybacks are not benefiting shareholders like you might imagine.
That $125 billion in buybacks is an extra $125 billion for Meta’s employees. Now in the tightest job market in 54 years, that’s fine. And since 70% of US GDP is consumer spending, and almost all of that is driven by wages, I’m all in favor of high worker pay.
Just realize that Meta’s big headlines about big buybacks aren’t what they appear. They only indirectly benefit shareholders by retaining talented employees and motivating them.
Ok, but aren’t we splitting hairs here? Meta is growing it’s net income at 13% to 14% per year, which is faster than Apple and on par with Alphabet (GOOG) (GOOGL).
Yes, that’s true, but only for the next few years.
What Do You Call A Growth Stock Growing At Single Digits? Meta
FactSet Research Terminal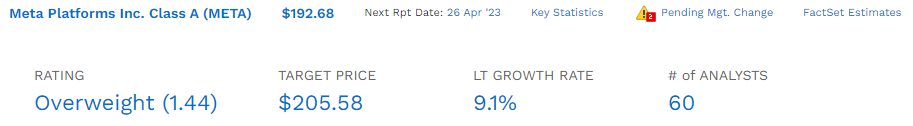
Remember this?
FactSet Research Terminal
Meta managed to grow its user base by 1.8% in 2022. And slow but steady growth is expected through 2026.
Daily active users are expected to grow modestly through 2027.
And average revenue per user, or ARPU, is expected to grow through 2025.
Well, what happens after those dates? Meta’s user base is expected to start shrinking slowly.
And its ARPU is also expected to start shrinking.
While Meta’s sales growth is expected to be close to 9% annually through 2028, by 2028, it’s expected to fall to 5%.
While its net income is expected to grow 13.5% through 2028, by 2028, it’s expected to fall to 10%.
And while its EPS growth through 2028 is expected to be 13.5% (buybacks offsetting stock comp), by 2028, it’s expected to fall to 7.3%.
In other words, Meta’s demographic problems mean its long-term growth rate, even factoring higher buybacks in the future (enough to offset stock comp), is about 9%.
At least that’s the median estimate today from all 60 analysts who cover Meta on Wall Street and collectively know it better than anyone other than Zuckerberg.
- forecast range -2% to 27% CAGR
Long-Term Total Return Consensus
| Investment Strategy | Yield | LT Consensus Growth | LT Consensus Total Return Potential | Long-Term Risk-Adjusted Expected Return |
| ZEUS Income Growth (My family hedge fund) | 4.3% | 9.9% | 14.2% | 9.9% |
| Schwab US Dividend Equity ETF | 3.6% | 9.4% | 13.0% | 9.1% |
| Vanguard Dividend Appreciation ETF | 2.2% | 10.0% | 12.2% | 8.5% |
| Meta With a 3% Dividend | 3.0% | 9.1% | 12.1% | 8.5% |
| Nasdaq | 0.8% | 10.9% | 11.7% | 8.2% |
| Colgate | 2.7% | 8.1% | 10.8% | 7.6% |
| Dividend Aristocrats | 1.9% | 8.5% | 10.4% | 7.3% |
| S&P 500 | 1.7% | 8.5% | 10.2% | 7.1% |
| REITs | 3.9% | 6.1% | 10.0% | 7.0% |
| Meta | 0% | 9.1% | 9.1% | 6.4% |
| 60/40 Retirement Portfolio | 2.1% | 5.1% | 7.2% | 5.0% |
(Source: DK Research Terminal, FactSet, Morningstar)
At the moment, Meta is expected to generate long-term returns of 9%, less than the S&P, the aristocrats, and even Colgate.
If it paid a 3% dividend yield, it would be expected to outperform the Nasdaq and become a highly attractive stock.
- After ten consecutive years of raising its dividend, it would be added to VIG
- and SCHD could add it even sooner
Bottom Line: Even After Doubling, Meta Could Soar Much More…But There’s A Catch
Meta offers solid medium-term growth potential, decent long-term potential, and an attractive valuation.
It could potentially double in three years, even after soaring 117%. That’s because it’s still 28% undervalued.
But as the company is structured today, a company whose demographics are terrible and whose main avenue for growth is to cut costs and lay off workers.
Well, without a dividend, Meta isn’t expected to outperform most companies. Even boring old dividend aristocrats like Colgate are expected to deliver superior returns.
Could analysts be wrong? Might Zuckerberg’s Metaverse plan return it to its former growth glory days? Perhaps. Deutsche Bank’s Benjamin Black and Evercore ISI’s Mark Mahaney think Meta will grow at 18.7% and 27% annually, respectively.
But guess how many analysts out of 60 think Meta can grow at double-digits in the long-term? Just three.
An equal amount thinks Meta will grow at between -2% to 3%.
They might be wrong as well, but I think the odds of Meta growing at 3% are probably a lot higher than it growing at 12+%.
Daily Shot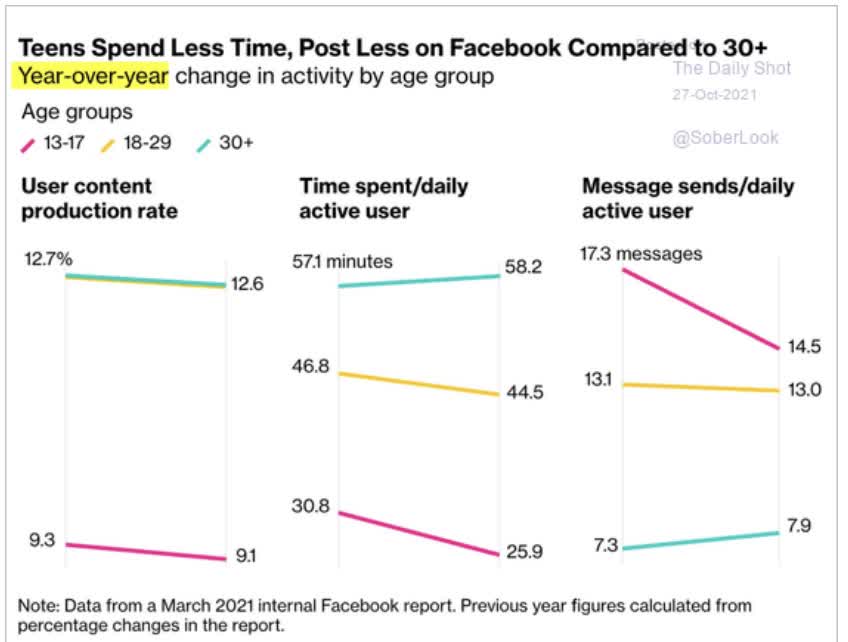
Facebook is dominant among older users, and less popular with the young.
That’s why its userbase is expected to peak soon and gradually decline.
It’s also why its revenue per user is expected to decline by 2026.
Advertisers want to market to younger people whose earnings and spending are upswing, not retired seniors.
I’m not saying that’s morally right, it’s just the facts.
All of this means that without a dividend, Meta’s long-term total return potential is far below many of Wall Street’s favorite growth stocks today.
Morningstar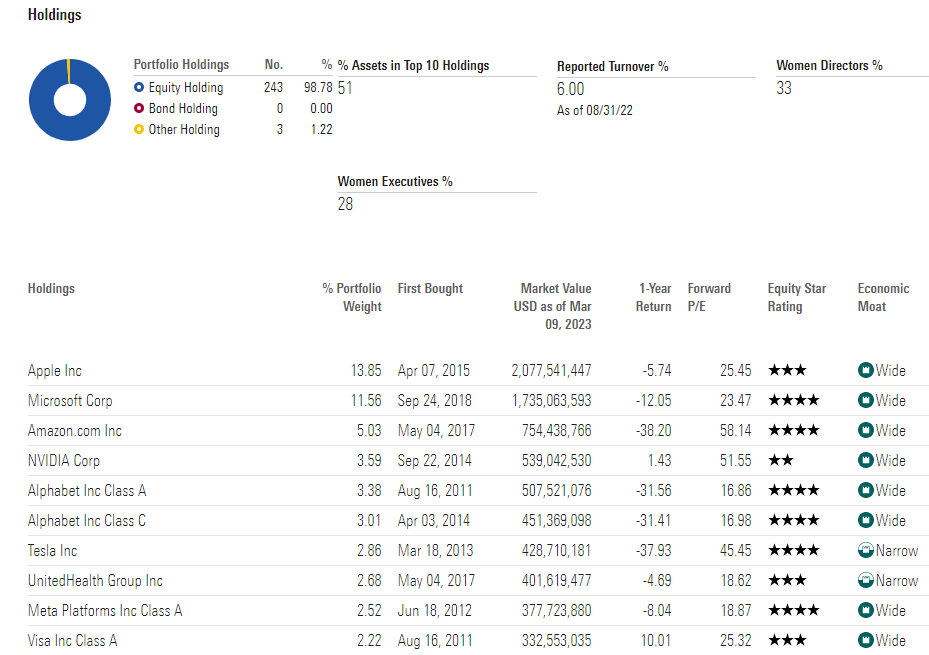
Let’s consider SCHG, my favorite growth ETF.
- Top 50% of S&P by growth under using multi-factor analysis
Now let’s compare how fast these growth companies are expected to grow long-term.
| Company | Long-Term Growth Consensus | Yield |
Long-Term Return Potential |
| AMZN | 27.6% | 0.0% | 27.6% |
| AMD | 27.2% | 0.0% | 27.2% |
| LLY | 21.9% | 1.4% | 23.3% |
| MA | 22.1% | 0.7% | 22.8% |
| AVGO | 19.2% | 2.9% | 22.1% |
| NVDA | 21.2% | 0.1% | 21.3% |
| TSLA | 19.0% | 0.0% | 19.0% |
| CRM | 18.6% | 0.0% | 18.6% |
| V | 16.3% | 0.8% | 17.1% |
| ADBE | 15.2% | 0.0% | 15.2% |
| UNH | 13.4% | 1.4% | 14.8% |
| GOOG | 14.5% | 0.0% | 14.5% |
| MSFT | 12.9% | 1.1% | 14.0% |
| ACN | 10.9% | 1.8% | 12.7% |
| AAPL | 10.4% | 0.6% | 11.0% |
| LIN | 9.4% | 1.5% | 10.9% |
| COST | 9.3% | 0.8% | 10.1% |
| TMO | 9.2% | 0.3% | 9.5% |
| META | 9.1% | 0.0% | 9.1% |
| DHR | 6.2% | 0.4% | 6.6% |
| S&P | 1.7% | 8.5% | 10.2% |
(Source: FactSet Research Terminal)
What’s a better growth stock than Meta? Many wonderful dividend stocks like Broadcom (AVGO), Microsoft (MSFT), and even Apple.
Meta is only superior to these three on valuation.
Is it smart to own Meta? Sure, in ETFs.
Is it smart to buy Meta today? Absolutely, if you’re a value or GARP investor.
Is it smart to load up on more Meta today after it’s doubled? Yes, if you’re a momentum trader.
But Meta growing at single digits long-term can’t be combined with high-yield blue-chips and turbocharger your income growth.
Things would change entirely if it begins paying a generous and steadily growing dividend.
- a 50% FCF payout ratio would be a 2% yield and 11.1% long-term return potential
- making Meta a 30% undervalued dividend growth SWAN that could double in three years
But as things stand now? I’ll pass on Meta because there are so many wonderful alternatives.
Disclosure: I/we have no stock, option or similar derivative position in any of the companies mentioned, and no plans to initiate any such positions within the next 72 hours. I wrote this article myself, and it expresses my own opinions. I am not receiving compensation for it (other than from Seeking Alpha). I have no business relationship with any company whose stock is mentioned in this article.
Additional disclosure: I own a bit of Meta via ETFs.
—————————————————————————————-

Dividend Kings helps you determine the best safe dividend stocks to buy via our Automated Investment Decision Tool, Research Terminal, Company Screener, and Daily Blue-Chip Deal Videos.
Membership also includes
- Access to our 13 model portfolios (all of which are beating the market in this correction)
- my personal correction watchlist
- My $2 million family hedge fund
- 50% discount to iREIT (our REIT-focused sister service)
- real-time chatroom support
- real-time email notifications of all my personal buys
- numerous valuable investing tools
Click here for a two-week free trial so we can help you achieve better long-term total returns and your financial dreams.