Summary:
- How do the current fundamentals show that Meta has dug a hole for itself?
- We look at specific price levels for the stock and what is the most likely path forward.
- What does crowd behavior have to do with Meta’s stock price?
PeopleImages/iStock via Getty Images
By Levi at StockWaves; produced with Avi Gilburt
We might even affirm that Meta Platforms (NASDAQ:META) has spent itself into a “hold,” as that’s how we have it rated for the moment. What facts have helped us come to this conclusion? What’s the likely path for price going forward? Also, we will briefly discuss the difference between one person’s opinion vs. crowd behavior in action.
The Fundamental Picture With Lyn Alden
Looking at the fundamentals with Lyn gives us a solid thesis that we can then mesh with the technical picture. Here are some of her recent comments to members of StockWaves:
“Meta’s fundamentals suggest a very unclear forward outlook, which by extension makes the risk/reward not too attractive.”
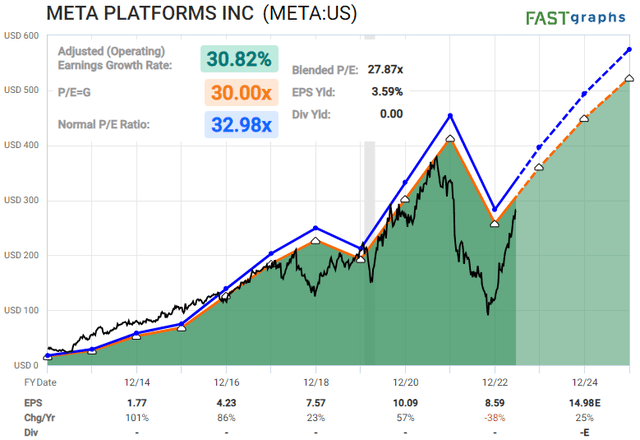
“On one hand, consensus analysts expect a resumption of growth. Meta, however, is already trading at a rather rich valuation relative to its forward growth prospects (over 23x forward price/earnings) and thus seems to agree with and take into account that growth potential.”
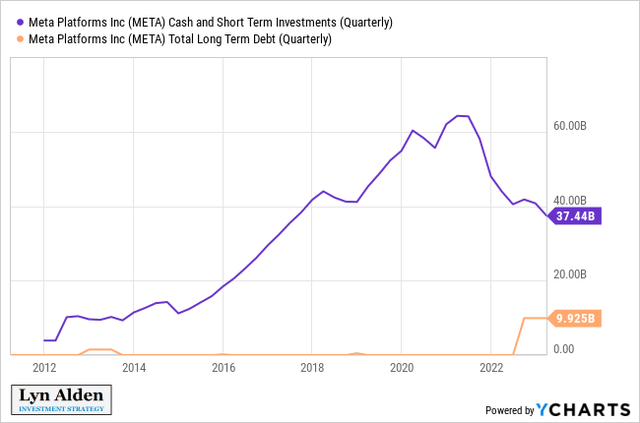
“More concerningly, the company has had an unclear capex strategy that doesn’t exactly inspire confidence. They burned significant cash pursuing the Metaverse/VR concept, which thus far has not paid off, and has new entrants (e.g., Apple) entering the competitive fray. Specifically, they’ve drawn down their cash reserves significantly, while also tapping into debt markets.
Overall, I have neither a conviction bull or bear view on Meta Platforms, and I consider there to be clearer risk/return investments on the market.”
Where Fundamentals Meet Technicals
That’s the place that we call StockWaves. Having Lyn Alden as one of our lead analysts gives us an extra edge to find high-probability setups for both buys and sells. However, based on Lyn’s analysis and our own charts produced by Zac Mannes and Garrett Patten, although we’re not outright bearish in the long term for META, it would appear that this is a good place to turn cautious, ergo the “hold” rating for now.
Let’s dive a bit deeper into what the structure of price on the META chart is telling us. Also, Avi Gilburt has recently contributed an update to a chart that he posted back in October of last year. Now, granted, Avi is typically focused on our market service as well as writing and educating others about the correct application of Elliott Wave theory. However, there will be brief moments when he “pops” into StockWaves to provide an extra point of view into a stock. These are generally pivotal moments in time for the stock.
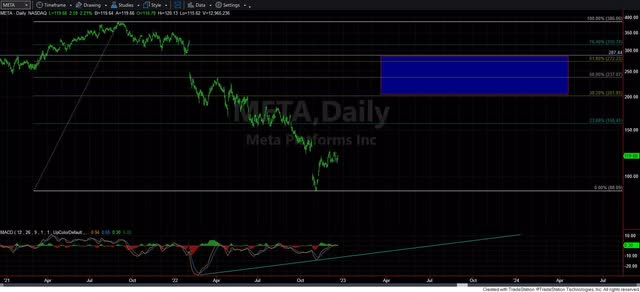
One of these moments was towards the end of October 2022 when the majority of the crowd was “freaking out” about META’s stock price. Avi calculated a $90 target for the low; the eventual low was $88.11, struck just a week later. What happened shortly after that? Note Avi’s chart from Dec. 21, 2022, that projected a potential target zone overhead from $202-$287.
Yes, a large price area, but the potential was just the beginning. Just a few days ago, Avi posted this to our members:
“META has come a long way since we caught the bottom in October. If you remember, we were looking for a drop down toward the 90 region, and then a rally back to the target box on the chart. We are now at the top of our expectations for this rally. This will be an interesting coming several weeks.”
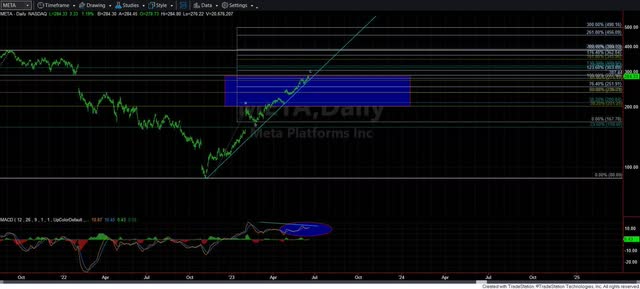
Alright, let’s zoom in to a bit more detail with the technical picture. Both Zac and Garrett regularly update their views for members and have recently posted these charts.
By Zac Mannes/StockWaves – MotiveWave By Garrett Patten/StockWaves – MotiveWave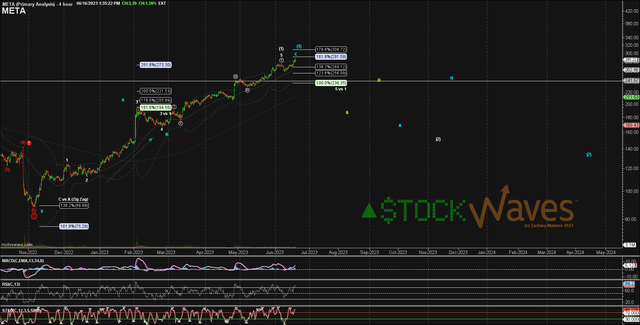
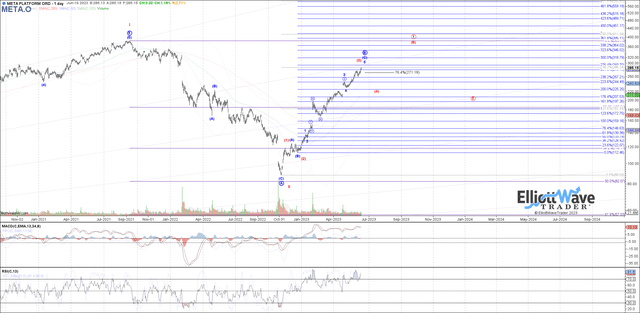
You can see from both charts that META stock is nearing the next zone where a larger pullback may unfold. We are looking at the $302-$318 area to be a waypoint for this current uptrend. It will be the structure of that pullback that will tell us what is most likely thereafter.
In the bigger picture, as you can view on both charts, there’s the possibility that META is actually setting up for a much larger rally once this consolidation completes.
Regarding some of the risks in the current setup, one would be if the price actually moves directly above the $318 level that it could continue toward the next Fibonacci price extension overhead at $344-$360. We do not view this current chart as a short candidate unless near-term support levels break. Rather, it would appear prudent based on valuation, debt levels, and the structure that price is telling us on the chart that caution is warranted in the near term.
What’s Your Opinion?
Nearly everyone you query will have an opinion on Facebook/Meta. And, what’s more, their opinion is likely to be specific and many times even acrid. This is one company that tends to polarize opinions and even galvanize them further the more one learns about it. But this is really not what’s important. What? I’m irrelevant, you say? As far as what moves a stock price – yes. We’re all like grains of sand on the seashore, driven hither and thither by the waves of the social masses.
Don’t dismay. Once you recognize this is what actually is responsible for the movement in the stocks that make up the market we observe, you will have opened your eyes to a whole new way of seeing trading and investing. It’s this exact methodology that led Avi to be able to project the $90 low for META last year.
So, while individuals were panicking, what was the crowd preparing to do? We can now see the results of that rebound. This appears to be due to what is termed as an “emergent behavior.”
In a paper entitled “Large Financial Crashes,” published in 1997 in Physica A, a publication of the European Physical Society, the authors, within their conclusions, present a nice summation for the overall herding phenomena within financial markets:
“Stock markets are fascinating structures with analogies to what’s arguably the most complex dynamical system found in natural sciences, i.e., the human mind. Instead of the usual interpretation of the Efficient Market Hypothesis in which traders extract and incorporate consciously (by their action) all information contained in market prices, we propose that the market as a whole can exhibit an ’emergent’ behavior not shared by any of its constituents. In other words, we have in mind the process of the emergence of intelligent behavior at a macroscopic scale that individuals at the microscopic scales have no idea of. This process has been discussed in biology for instance in the animal populations such as ant colonies or in connection with the emergence of consciousness.”
OK, so what do ants have to do with investing? Remember, we’re talking about crowd behavior. This herding mentality moves in patterns. These patterns are repeatable and therefore predictable. But, what about subjectivity that can permeate the analysis?
Fibonacci Pinball is a way to standardize our approach to markets. It’s a framework that can be overlaid upon Elliott Wave theory and mitigate to a great degree said subjectivity.
I would like to take this opportunity to remind you that we provide our perspective by ranking probabilistic market movements based upon the structure of the market price action. And if we maintain a certain primary perspective as to how the market will move next, and the market breaks that pattern, it clearly tells us that we were wrong in our initial assessment. But here’s the most important part of the analysis: We also provide you with an alternative perspective at the same time we provide you with our primary expectation, and let you know when to adopt that alternative perspective before it happens.
There are many ways to analyze and track stocks and the market they form. Some are more consistent than others. For us, this method has proved the most reliable and keeps us on the right side of the trade much more often than not. Nothing is perfect in this world, but for those looking to open their eyes to a new universe of trading and investing, why not consider studying this further? It may just be one of the most illuminating projects you undertake.
Analyst’s Disclosure: I/we have no stock, option or similar derivative position in any of the companies mentioned, and no plans to initiate any such positions within the next 72 hours. I wrote this article myself, and it expresses my own opinions. I am not receiving compensation for it. I have no business relationship with any company whose stock is mentioned in this article.
Seeking Alpha’s Disclosure: Past performance is no guarantee of future results. No recommendation or advice is being given as to whether any investment is suitable for a particular investor. Any views or opinions expressed above may not reflect those of Seeking Alpha as a whole. Seeking Alpha is not a licensed securities dealer, broker or US investment adviser or investment bank. Our analysts are third party authors that include both professional investors and individual investors who may not be licensed or certified by any institute or regulatory body.
STOCK WAVES: Where fundamental analysis meets technical analysis for highest-probability investment opportunities!
“Thus far, the best stock-picking service I’ve seen–and I’ve been doing this for 35+ years! (Gunfighter)
“Stock Waves has produced more gains in the past month(+) than many sites do in years or decades.” (Keto)
“The amount of trades I’ve been able to take resulting in 100%+ returns is nothing short of amazing. If you do not have Stockwaves, you are only doing yourself a disservice.” (dgriff617)
Click here for a FREE TRIAL.

