Summary:
- Meta Platforms has experienced significant volatility but achieved new all-time highs above $600, prompting a downgrade from “buy” to “hold” due to increased downside risk.
- Despite strong financial performance, including EPS and revenue beats, and impressive net income growth, caution is advised given the stock’s previously unpredictable price action.
- Meta’s forward price-earnings multiple remains attractive compared to other MAG-7 stocks, but its price-sales valuation is less favorable, suggesting better investment opportunities elsewhere.
- A break below $544.23 would signal a shift to sideways consolidation, and a drop below $495.60 would prompt a “sell” rating due to the potential for accelerating losses.
Robert Way
When I last wrote about Meta Platforms (NASDAQ:META) on April 26th, 2024 with “Meta Implodes: Below $400 Could Accelerate Declines“, the stock was caught in the midst of a severe sell-off that generated declines of -22% in just 17 days and even experienced downside price gaps that stretched nearly $45 in length:
META: Severe Price Declines (Income Generator via TradingView)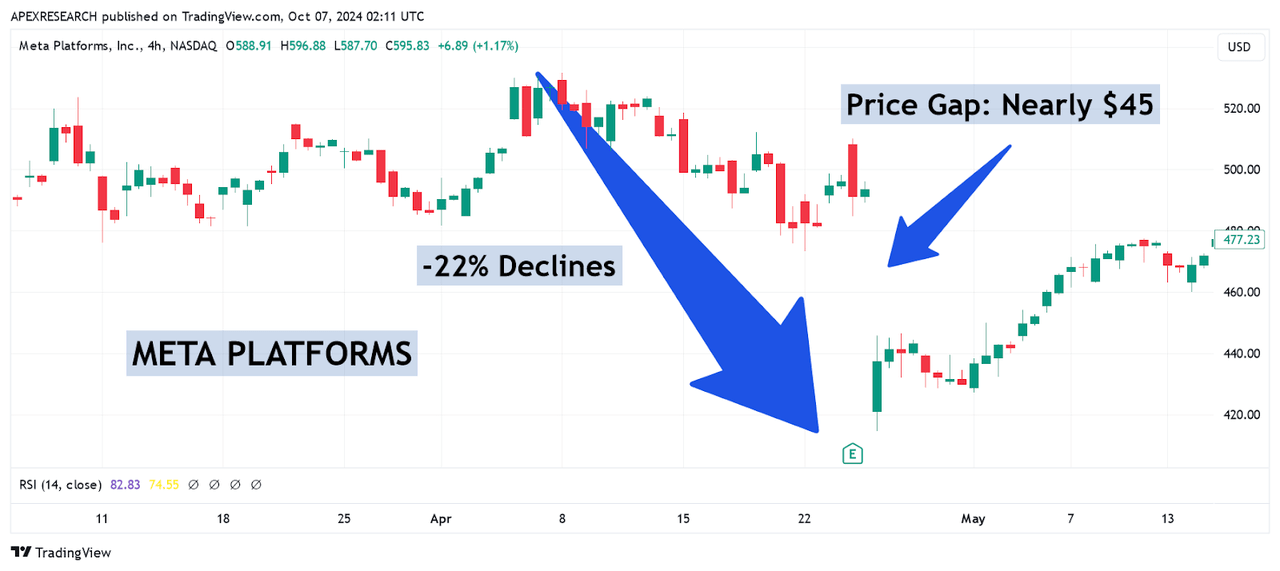
Understandably, many investors with long positions in this stock were wondering about the potential for continued weakness in share prices – and we defined a break below the $400 level as the ultimate sign of an impending collapse where share prices might have the potential to further accelerate losses. Fortunately, the ultimate low that was seen during this specific trend-wave movement lower posted at $414.50, and the resulting bounce in share prices was enough to protect stockholders from much more severe declines that might have been fueled by possible stop-loss activity to the downside.
Since then, the stock has seen several instances of erratic two-way price action (covered in a more in-depth fashion below), but the ultimate resolution of all of this volatile price action has been the formation of new all-time highs above $600 per share. As a result, our “buy” position has significantly outperformed the market with total returns of 34.36% while the S&P 500 has lagged far behind (with gains of 12.37%).
Meta Platforms: Q2 2024 Earnings Figures (Meta Platforms Earnings Presentation)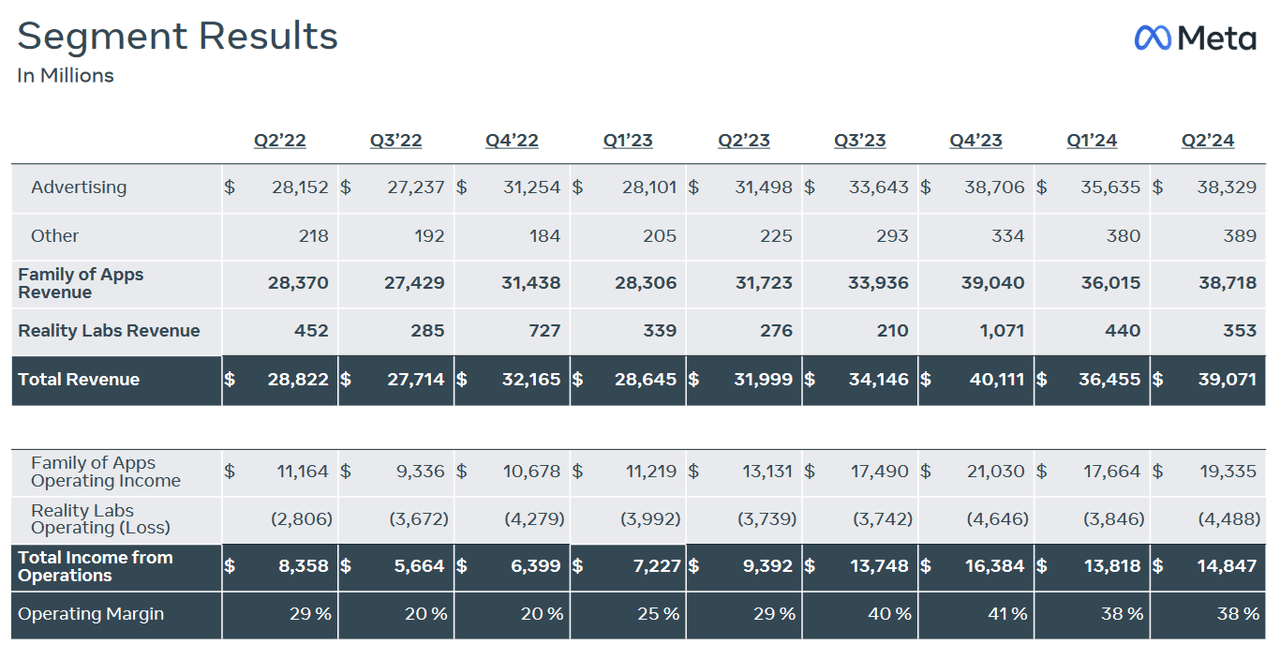
In the meantime, significant developments have been seen with this company, and many of these events have been quite positive in nature. For the second quarter period, Meta reported $5.16 in EPS (solidly beating consensus estimates of $4.73 in EPS) and revenue of $39.07 billion (moderately beating consensus estimates of $38.31 billion). Interestingly, the company reported $32 billion in Q2 2023 (indicating 22% in revenue growth on an annualized basis) and this means that Meta has now generated revenue growth rates above 20% for four consecutive quarters.
Meta Platforms: Q2 2024 Earnings Figures (Meta Platforms: Earnings Presentation)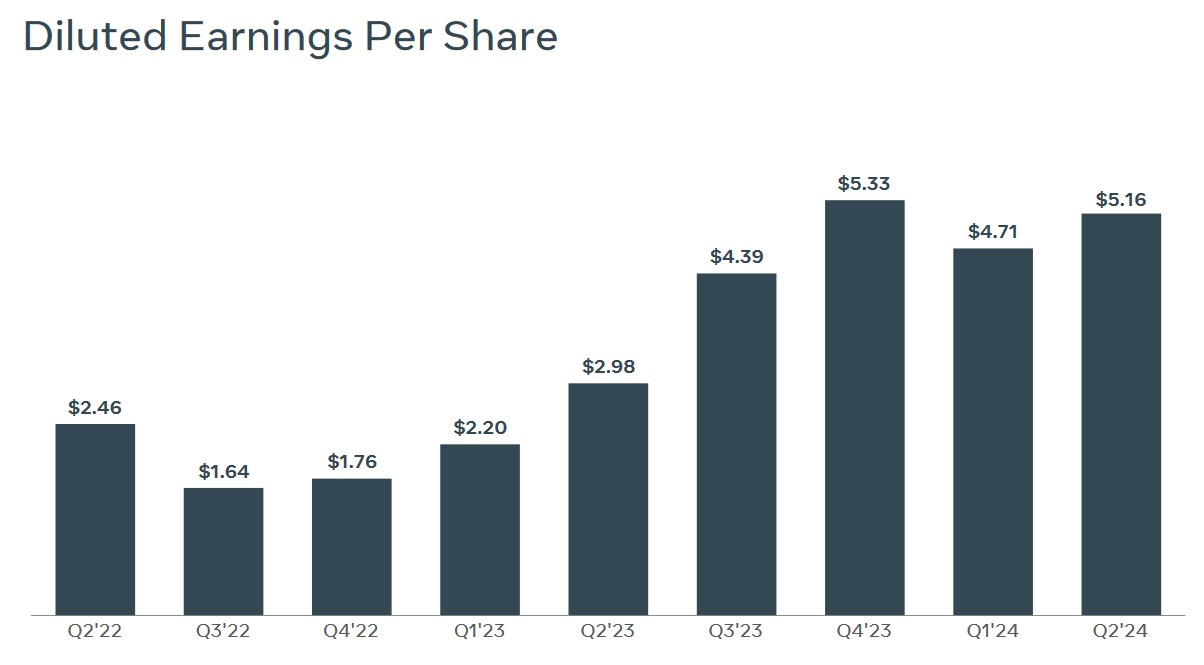
Also impressive were the company’s net income figures, which came in at $13.47 billion (indicating stellar annualized growth rates of 73%). For the third quarter period, Meta’s guidance figures imply a potential revenue range of $38.5-41.0 billion, and this $39.75 billion midpoint does surpass prior consensus estimates (which were seen at $39.1 billion).
Meta Platforms: Q2 2024 Earnings Figures (Meta Platforms: Earnings Presentation)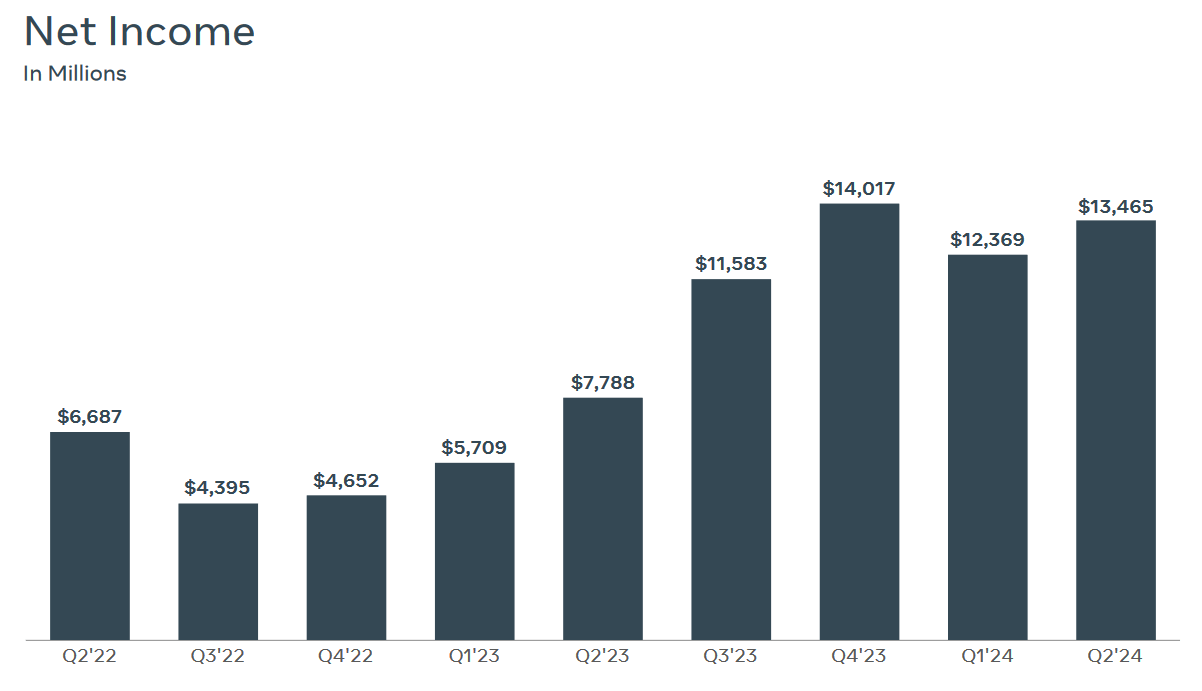
Q2 expenses came in at $24.2 billion, while CAPEX figures posted below expectations of $9.51 billion (at $8.47 billion). Current guidance suggests that CAPEX will now post within a range of $37-40 billion for the full-year period, with estimates for total expenses now seen at $96-99 billion.
Meta Platforms: Q2 2024 Earnings Figures (Meta Platforms: Earnings Presentation)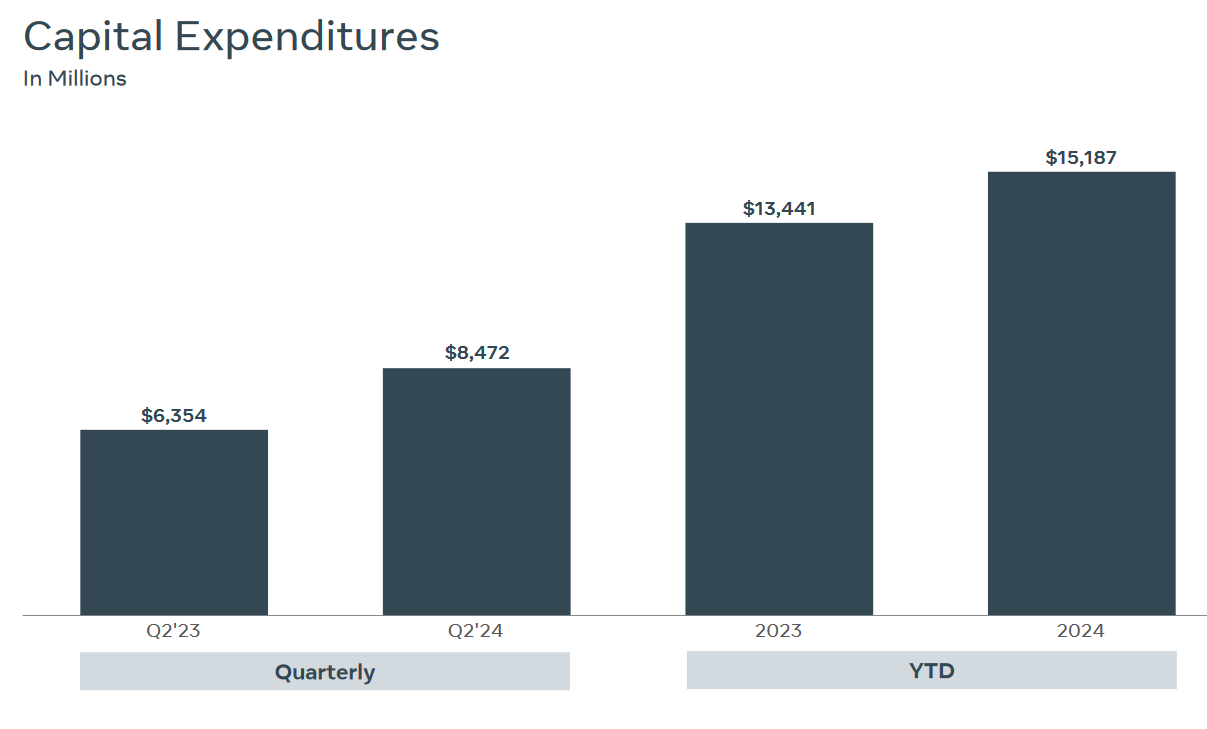
Over the past five months, Meta share prices have had several instances of two-way price action that have probably taken many investors by surprise. During the two worst cases, the stock lost nearly $117 in share price value during the period stretching from April 8th to April 25th and then lost over $100 in share price value during the period stretching from July 8th to July 25th. At the risk of sounding as though there is some type of coincidence between this series of dates, it should at least be clear that this is a stock that is highly susceptible to volatile two-way price action. Unfortunately, this downside volatility tends to increase toward extreme levels whenever the stock itself is moving toward significant historical highs.
META: Dual Downtrend Price Movements (Income Generator via TradingView)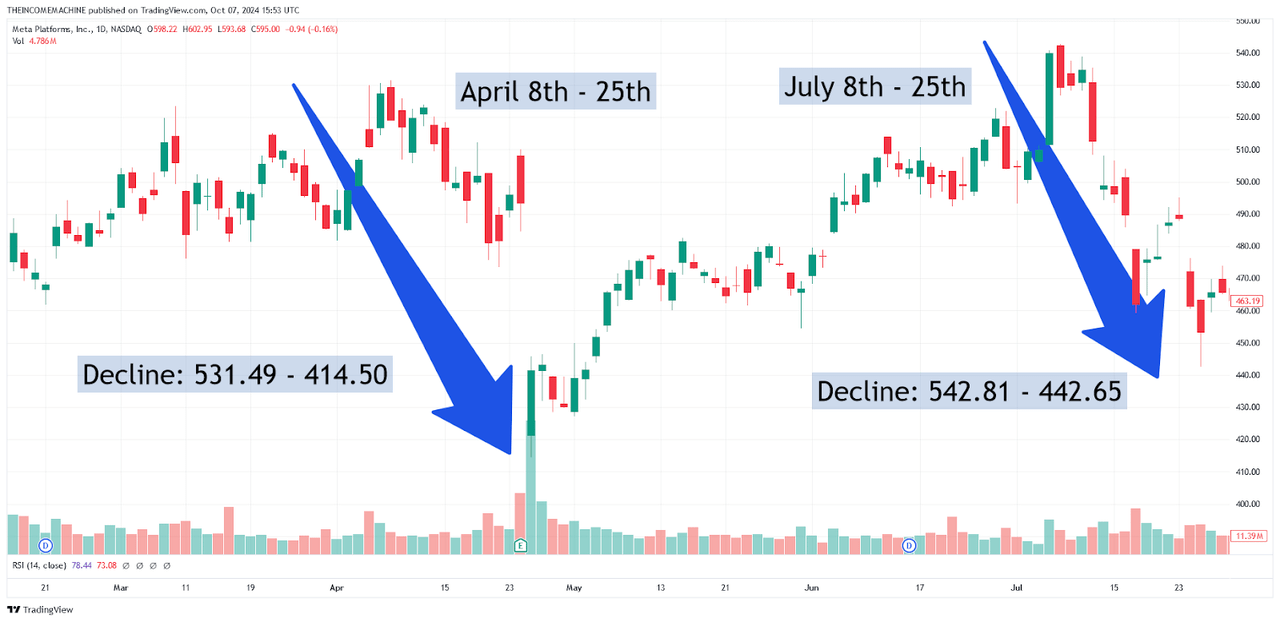
So now that we have finally breached the important psychological level at $600 per share, I think that it is time to start exercising a bit of caution when considering new purchases of META stock. This is the most significant portion of the reasoning that underlies my decision to downgrade META from a “buy” to a “hold”. But there are still several reasons to believe that my assertions here might be incorrect.
Comparative Valuations: Forward Price-Earnings Ratios (YCharts)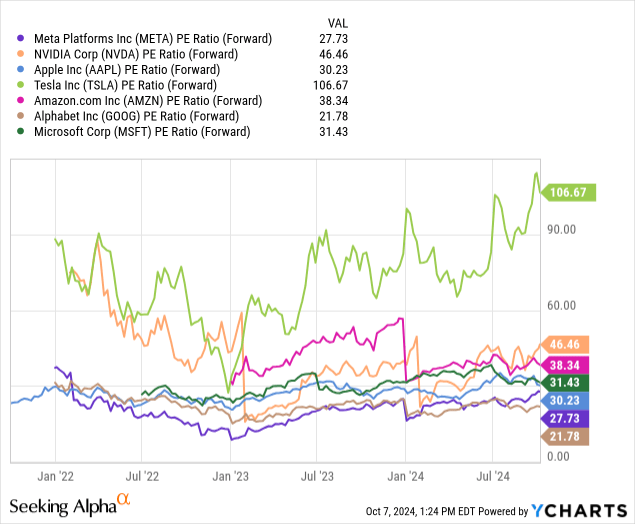
As one example, we can point to Meta’s forward price-earnings multiple, which is currently trading far below most of the other MAG-7 stocks. When making these types of assessments, I personally prefer to compare companies like Meta with other stock choices within the MAG-7 cohort. Obviously, each of these top-tier companies has its own unique business (and many of these companies are not even in the same type of industry). However, I usually tend to view these stocks in this manner because I think that when many investors are making the decision to buy a mega-cap stock, they are basing these selections on the potential outperformance of the other MAG-7 stocks (rather than in comparison to other companies that might be operating within the same industry). In this case, we can see that Meta remains undervalued when compared to Microsoft (MSFT), Amazon (AMZN), Apple (AAPL), and certainly, when compared to Nvidia (NVDA) and Tesla (TSLA). However, at the same time, Alphabet (GOOG) still has a forward price-earnings valuation that remains preferable when compared to Meta Platforms.
Comparative Valuations: Forward Price-Sales Ratios (YCharts)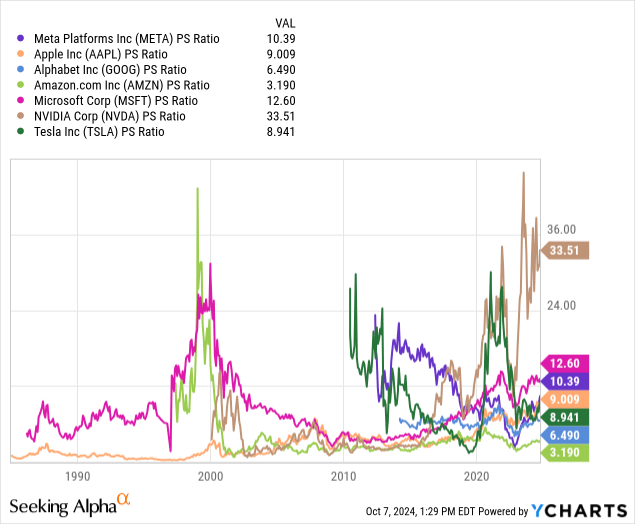
However, when we compare Meta’s price-sales valuation to the other MAG-7 stocks, the picture becomes a bit cloudier. Specifically, we can see that Amazon, Alphabet, Tesla, and Apple all trade with a price-sales valuation that is preferable to Meta Platforms. Currently, only Microsoft and Nvidia trade with higher valuations when using this metric – and this suggests that there might be other parts of the mega-cap stock sector that could be more attractive choices for investment at the moment.
META: Daily Chart (Income Generator via TradingView)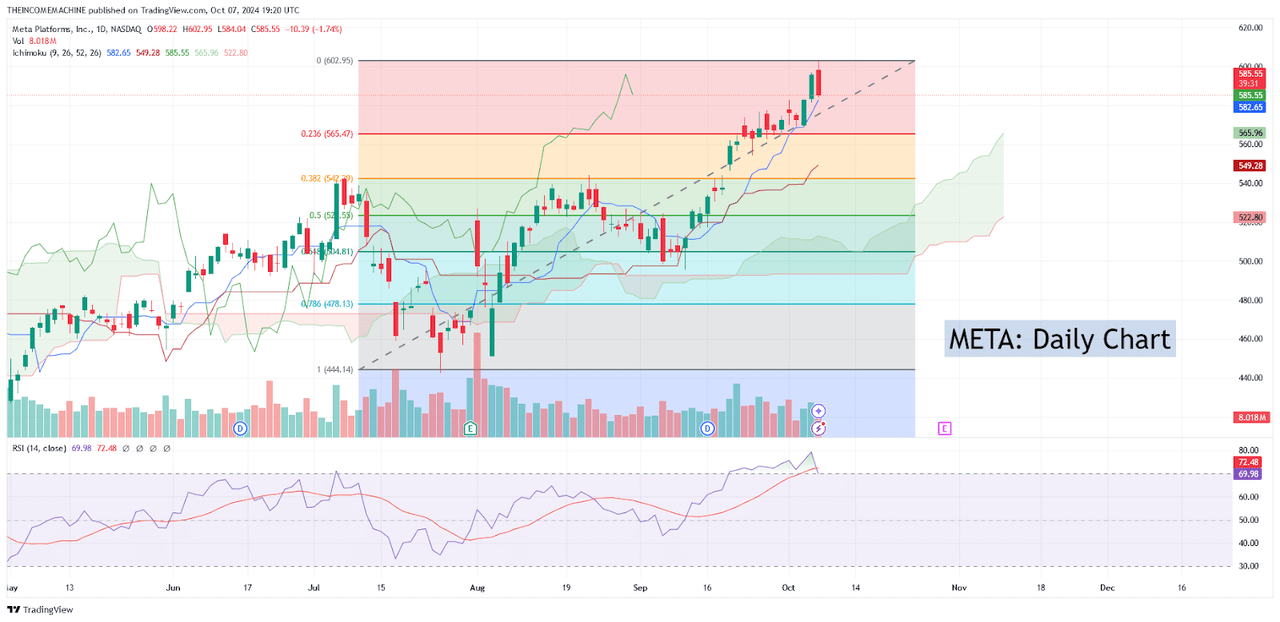
At the same time, these negatives are not enough of a reason for me to sell my position outright. For me, the true line in the sand would be encountered if META share prices were to fall below $544.23. Essentially, this price region marks the resistance high that was formed during the August 22nd trading session. Additionally, this price region coincides quite closely with the 38.2% Fibonacci retracement of the bullish trend-wave beginning from the July 25th lows of $442.65 and extending through to the October 7th highs of $602.95 (currently located near $542.30). When I see these types of technical signals working in combination with one another, I tend to view them as being stronger and more significant. Thus, a downside break of this area would lead me to believe that the bullish paradigm has shifted and that META share prices are likely to start experiencing a period of sideways consolidation. Further, a break below $495.60 (the stock’s price low from September 11th, 2024) would lead me to believe that losses are likely to begin accelerating to the downside. At this point, I would change my current “hold” rating to a “sell” rating.
As a result, I think that the prudent move for this stock would be to downgrade from the current “buy” rating. Of course, there are still many fundamental factors supporting the outlook for this preeminent social media company, but the potential for downside risk seems to be increasing dramatically now that the stock has reached new all-time highs. At this stage, I feel as though the stock should be viewed through the lens of increased unpredictability, given the fact that we have already witnessed some fairly severe downturns in share prices in the not-so-distant past. Currently, I believe that there are other MAG-7 stocks that are starting to become more attractive at current levels and I will consider changing my position outlook to sell if we do, in fact, see a break back below $495 per share.
Analyst’s Disclosure: I/we have a beneficial long position in the shares of META either through stock ownership, options, or other derivatives. I wrote this article myself, and it expresses my own opinions. I am not receiving compensation for it (other than from Seeking Alpha). I have no business relationship with any company whose stock is mentioned in this article.
Seeking Alpha’s Disclosure: Past performance is no guarantee of future results. No recommendation or advice is being given as to whether any investment is suitable for a particular investor. Any views or opinions expressed above may not reflect those of Seeking Alpha as a whole. Seeking Alpha is not a licensed securities dealer, broker or US investment adviser or investment bank. Our analysts are third party authors that include both professional investors and individual investors who may not be licensed or certified by any institute or regulatory body.
