Summary:
- Mark Zuckerberg announced 2023 to be the “Year of Efficiency”. Following the spending decadence in 2021-22, what Meta needs is a decade, not a year, of efficiency.
- I tried to estimate opex by infrastructure cost, headcount costs, and other reported expenses to get a sense of the overall spending structure for Meta.
- In terms of inefficiencies, Reality Labs perhaps takes the cake, and it is indeed potentially a significant drag for shareholders going forward.
- Of course, hardly anyone believes Reality Labs is worth any positive value. The business that’s perhaps worth all of Meta’s market cap (and then some) is Family of Apps.
Editor’s note: Seeking Alpha is proud to welcome Abdullah Al-Rezwan, CFA as a new contributor. It’s easy to become a Seeking Alpha contributor and earn money for your best investment ideas. Active contributors also get free access to SA Premium. Click here to find out more »
Kira-Yan
Originally posted on March 1, 2023
Mark Zuckerberg announced 2023 to be the “Year of Efficiency”. Following the spending decadence in 2021-22, I think what Meta (NASDAQ:META) needs is a decade, not a year, of efficiency.
The primary objective of this update is to understand what shareholders like myself need to believe to generate ~10% IRR without using a lofty exit multiple, e.g. ~10-12x in 2030. (I’ll comment on what may be appropriate exit multiple as well.)
But first of all, I want to discuss the 2022 Opex. I was curious how exactly Meta managed to spend ~$88 Bn in 2022 when it spent only ~$20 Bn in 2017. I know they show their spending by line items in the Income Statement, but I wanted to approach the Opex differently to gain a better sense of their spending. That’s Section 1.
In Section 2, I will explore whether there is a path for Reality Labs to be a real business even in 2030.
In Section 3, I will move to a more hopeful direction if you are a Meta shareholder: Family of Apps.
In Section 4, I will show you some valuation math in which I’ll explore what we need to believe to make ~10% IRR using 12x terminal FCF multiple.
Finally, in Section 5, I will leave some concluding remarks on Meta Platforms.
Section 1: Making sense of ~$88 Bn expense in 2022
Instead of looking at operating expense line items such as cost of revenue, R&D, S&M, G&A, I tried to estimate opex by infrastructure cost, headcount costs, and other reported expenses to get a sense of the overall spending structure for Meta.
Let’s start with the infrastructure cost. Snap (SNAP), on its recent Investor Day, disclosed the following interesting graph:
Snap 2023 Investor Day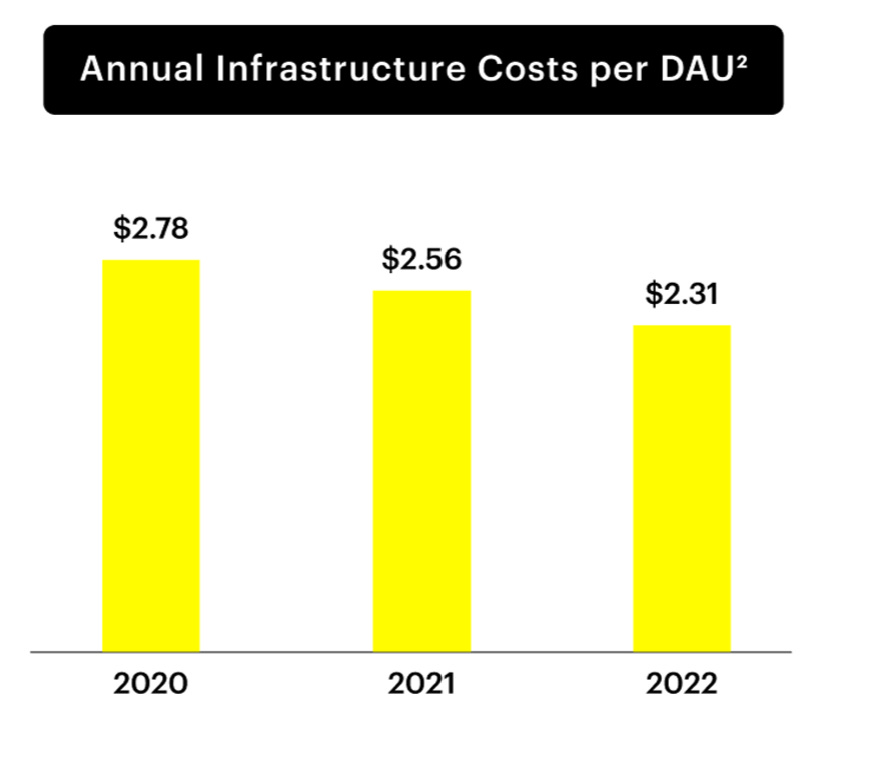
While Meta never disclosed their infrastructure costs, Snap’s disclosure could be a good starting point to estimate Meta’s infra costs. Since Snap uses public cloud whereas Meta uses their own infrastructure to run their properties, one may think Meta is likely to have lower infra cost per DAU, but, of course, there are more nuances. Meta has four major apps: Facebook, Instagram, Messenger, and WhatsApp, compared to Snap’s one major app: Snapchat. Facebook and Instagram usage is likely to cost materially more than Messenger and WhatsApp, and because of the potential cost efficiency of using their own infra versus public cloud, I assumed Meta’s infra cost per Daily Active People (DAP) to be 2x of Snap’s reported number in 2020. But since Reels was launched in August 2020 and subsequently became an increasing percentage of total time spent on Meta’s properties, I assumed 2.5x and 2.8x of Snap’s reported infra cost per DAU in 2021 and 2022 respectively for Meta. With such assumption, I estimate that Meta’s infra costs (includes depreciation) increased from $13.5 Bn in 2020 to $17.3 Bn in 2021 and $18.4 Bn in 2022.
I then estimated Meta’s cost of revenue for Reality Labs (mostly VR hardware), content-related costs (mostly licensing music and/or video content etc.) to calculate opex excluding cost of revenue in the last three years.
Since I wanted to gain a better understanding of total compensation paid to employees, I looked for any other cost items explicitly reported by Meta. From their 10-K, I could find their advertising expense, restructuring expense in 2022, and lease costs. Once I took into account all these expenses, I was left with $33 Bn, $44 Bn, and $55 Bn opex in 2020, 2021, and 2022 respectively.
If I assume all of that as compensation paid to employees, that would imply ~$692k per average headcount in 2022. That doesn’t sound right because we know Meta discloses their Stock-Based Compensation (SBC) number, which came out to be ~$151k per average headcount in 2022. Data from levels.fyi suggest software engineers, for example, at Meta get paid more in cash (base+ bonus) than in stocks for E3-E6 levels, whereas E7-E8 employees make significantly more in stock than in cash. Although an organization this big is likely to follow pyramid structure in headcount (significantly higher number of employees in E3-E6 than E7-E8), at the senior level total comp is so skewed to stock that it is unlikely cash comp per headcount is order of magnitude higher than average SBC per headcount. However, I looked at some data for international offices at Meta, and it seems employees in international offices get paid more in cash and less in stocks compared to employees in the US offices. While there are clearly some puts and takes here, I assumed cash to be 2x of SBC per overhead. If that’s the case, total comp per overhead at Meta was ~$454K in 2022.
Levels.fyi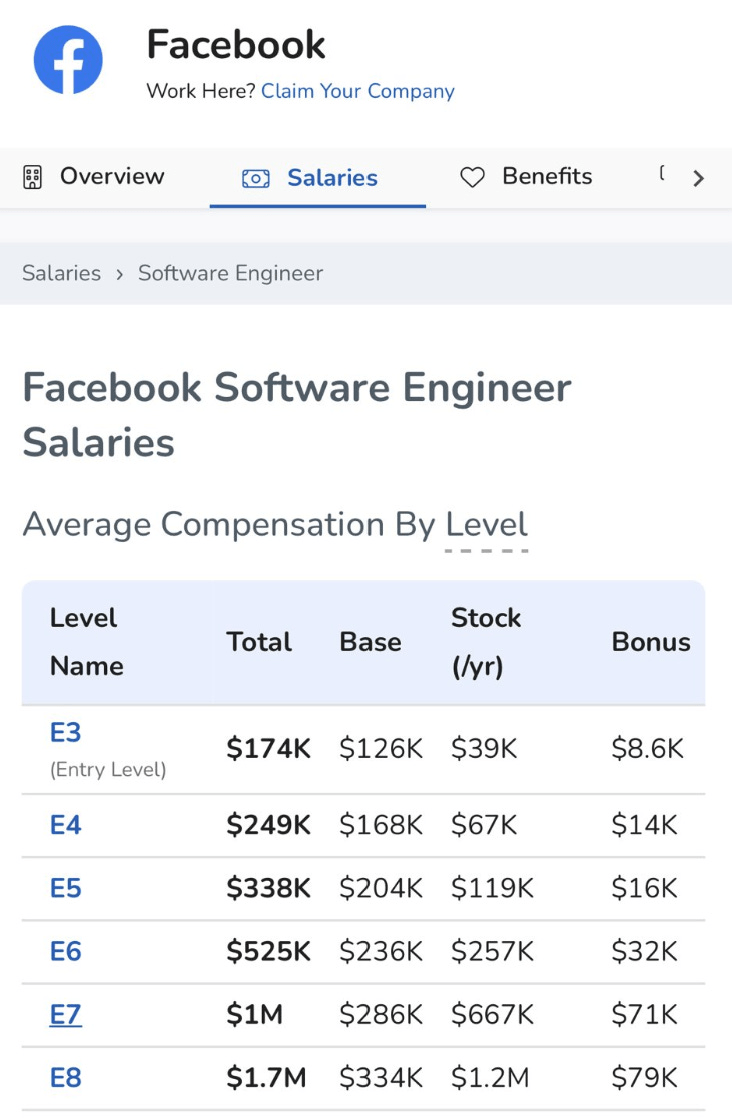
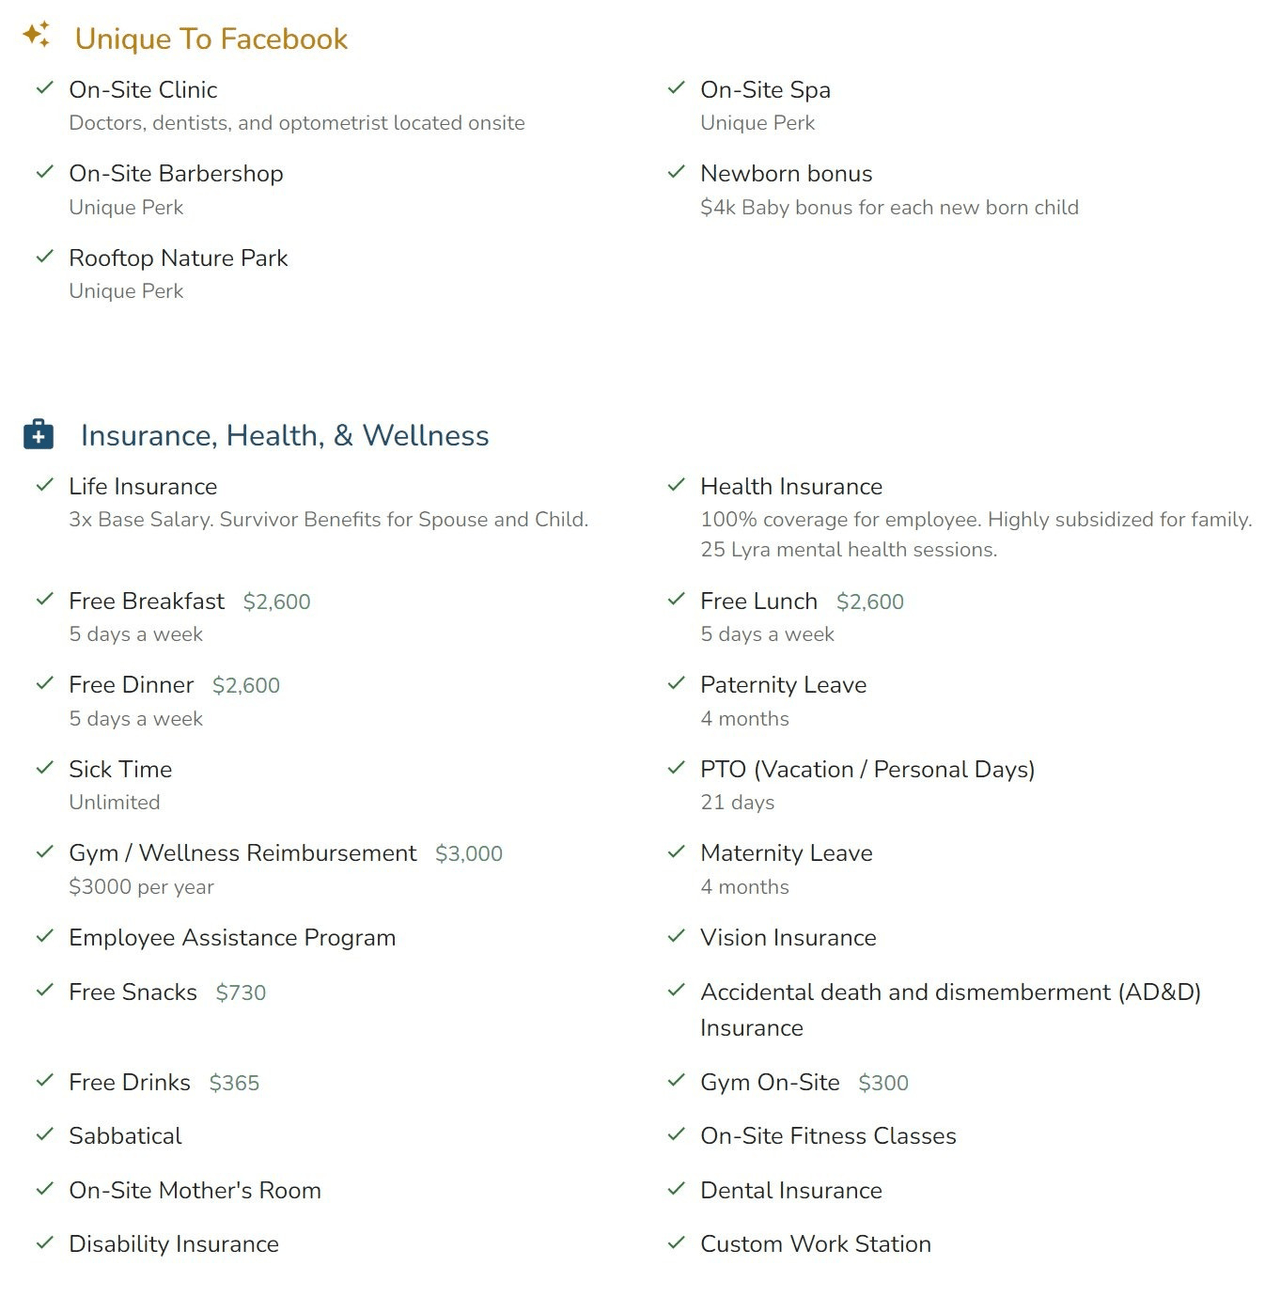
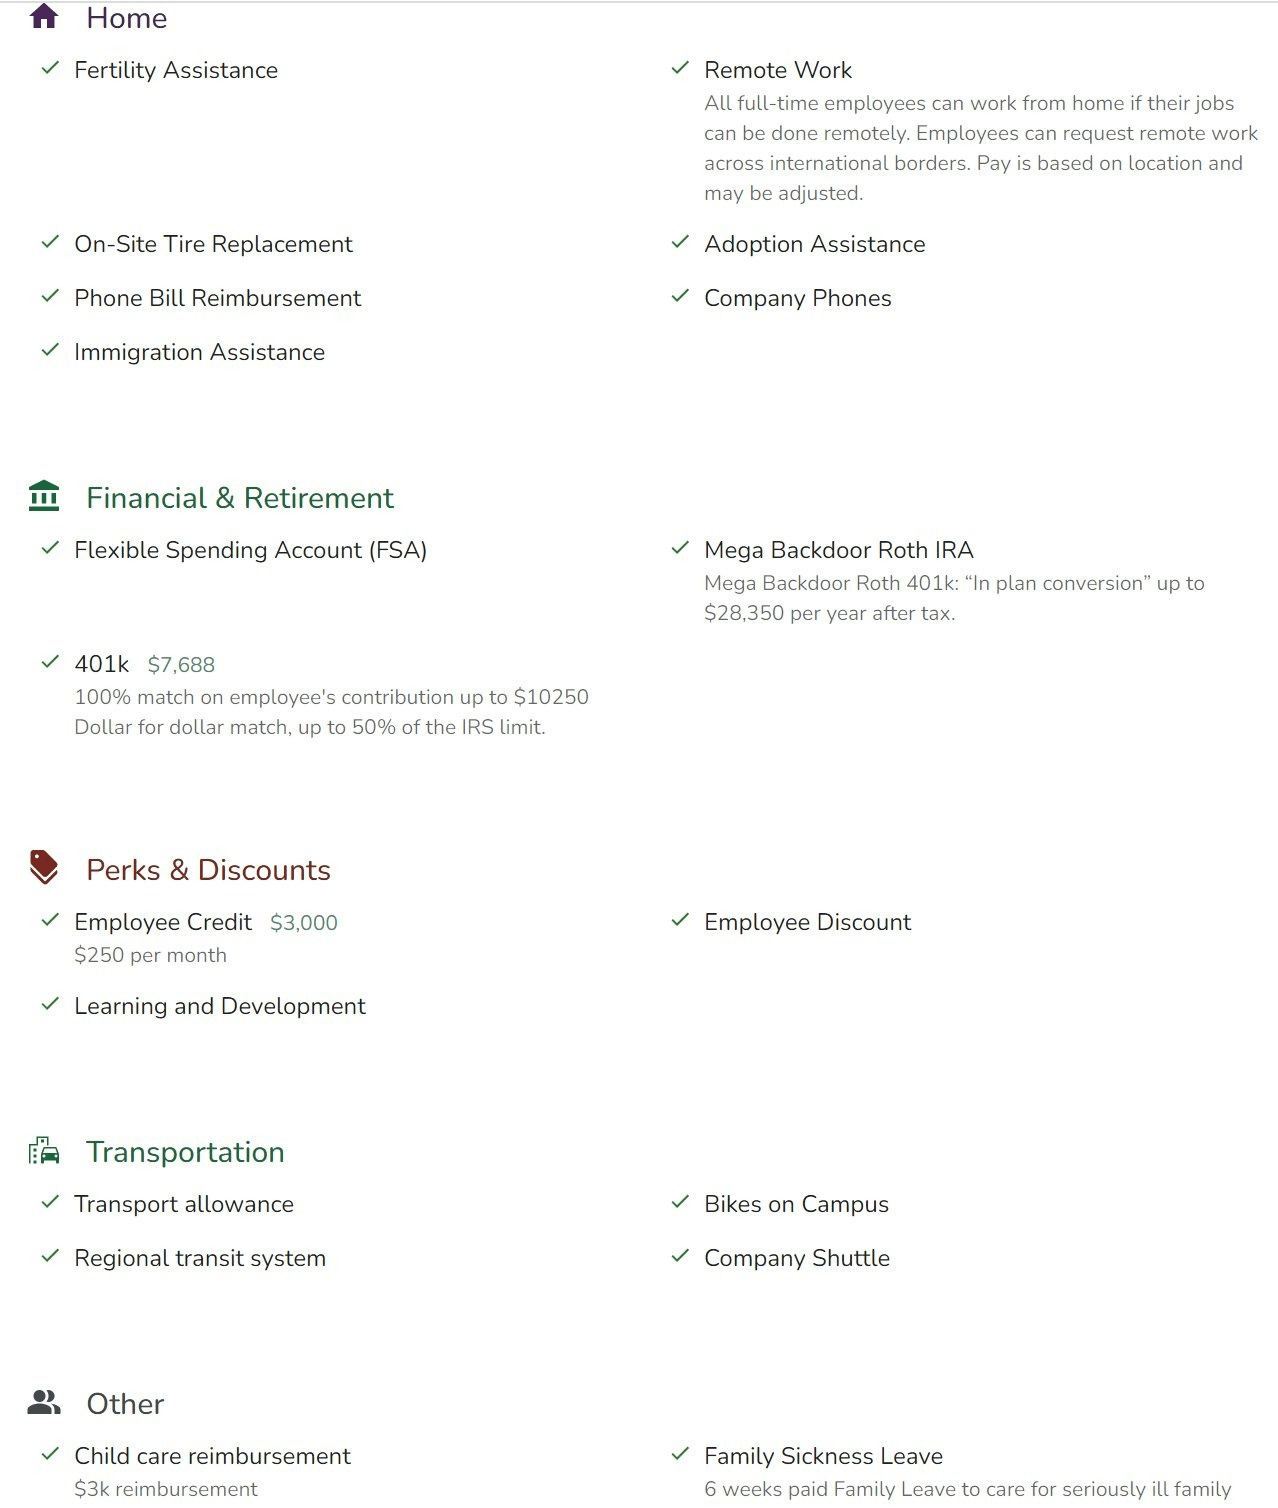
Of course, it’s not just cash and stocks; every big tech has their famed perks and benefits. We all know about that, but it was still quite something to go through some of the benefits Meta/Facebook allegedly have for their employees, as per levels.fyi.
Levels.fyi estimates that all these benefits are valued at $27,459/year. If we plug that, we can calculate that employee-related costs totaled $38 Bn in 2022, leaving $16.6 Bn unallocated opex in this exercise.
I also want to explicitly mention that as a shareholder, I want Meta to remain one of the highest-paying employers, if not the highest, among the tech companies because it is indeed one of the key competitive advantages of Meta (as it is for other big tech versus the startups or SMID cap tech companies; more on this here). On my “wish list”, I do not want lower total comp per headcount, but I certainly would love to see more discretion in the number of hiring. Meta’s employees increased from ~25k in 2017 to ~86k in 2022, and it is the pace of hiring that led to some angst among shareholders, including me. The recent layoff (and potentially more) shows Meta is finally working on addressing this.
Let’s go back to the unallocated opex. What exactly is this $16.6 Bn opex, which is $210k per average headcount? It could be office furniture, travel expenses, tech gadgets given to employees, Meta’s own software bills etc. Whatever it is, if you are looking for efficiencies, this would probably be a good place to start. If Meta could run their entire company with $20 Bn opex in 2017 (they had chairs, laptops, and software bills in 2017 too), I am sure there are plenty of inefficiencies in this bucket.
Speaking of inefficiencies, Reality Labs perhaps takes the cake, and it is indeed potentially a significant drag for shareholders going forward.
Company Filings, MBI Deep Dives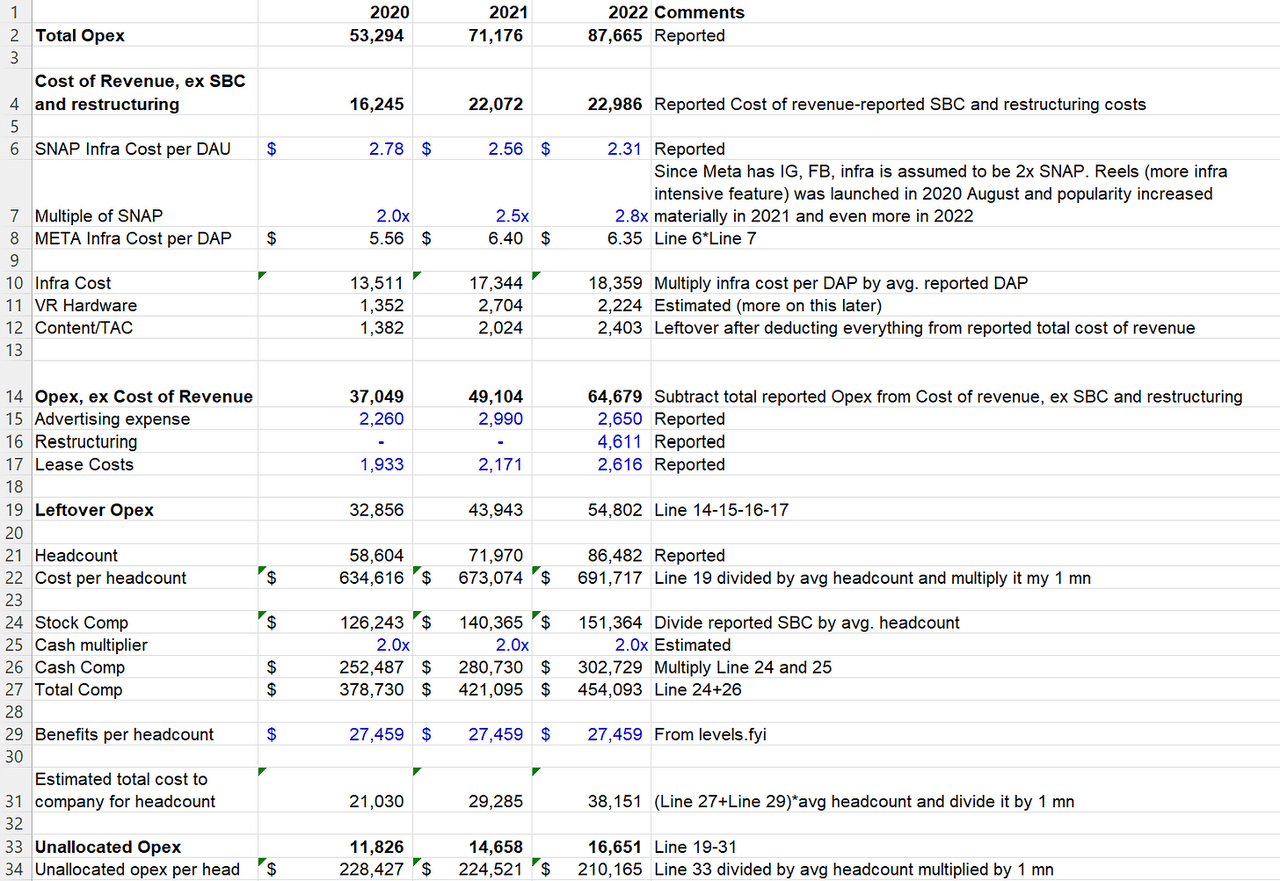
Section 2: Is there a path for Reality Labs to be a real business in 2030?
Meta disclosed segment-wise revenue and EBIT numbers from 2019 even though it doesn’t disclose more granular breakdown of operating expenses in Reality Labs. Let’s start with the revenue and gross profit build for Reality Labs. If my model appears a bit unrealistic for Metaverse skeptics out there, please stick around for the expenses modeled to generate these projected revenues to understand what I’m doing here.
Revenue and Gross Profit Build
Within Reality Labs, I have segmented revenue in broadly two categories: Virtual Reality (VR), and Augmented Reality (AR). Then within each of these categories, I assumed three sources of revenue: Hardware sales, software revenue, and advertising revenue.
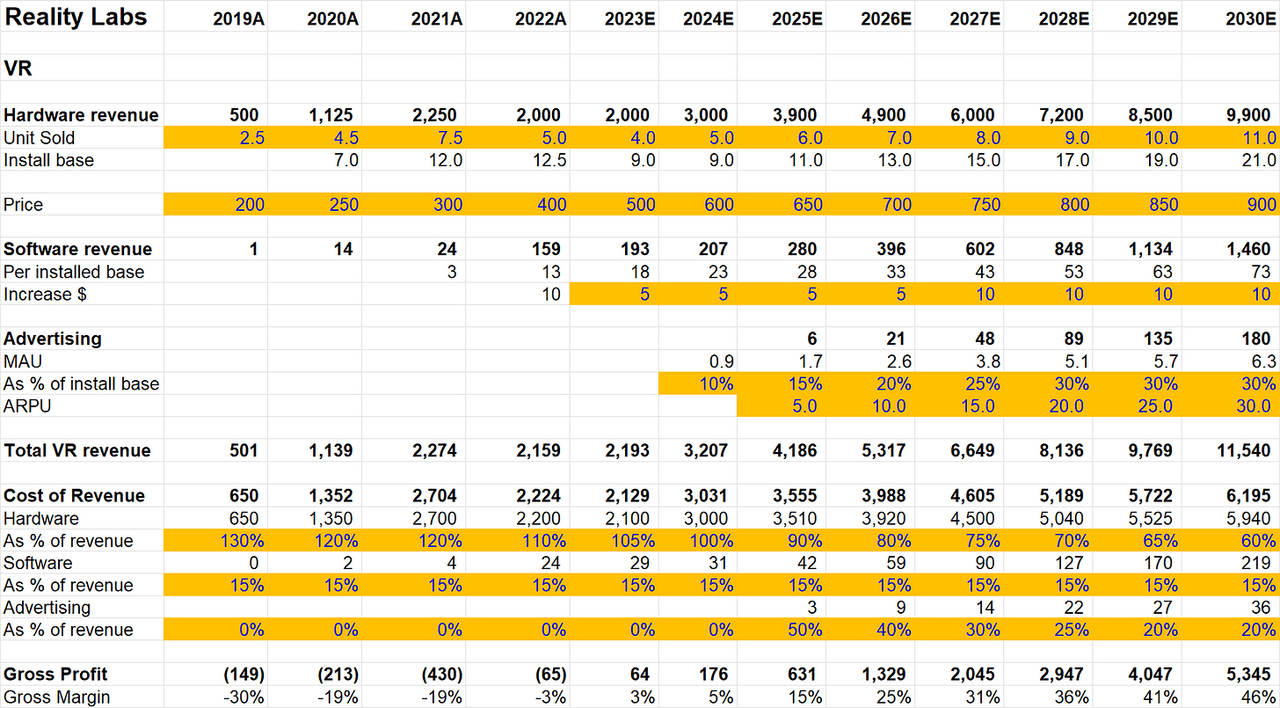
Let’s start with VR. Since Meta is yet to launch any major AR product and unlikely to do so until 2025, I attributed all of Reality Labs’ revenue to VR till 2024. Meta’s VR has, broadly speaking, two types of hardware: relatively lower-priced consumer hardware (e.g. Quest 2) and higher-priced enterprise hardware (e.g. Quest Pro). Their initial plan was to keep launching a new version of either consumer or enterprise segment in alternate years, but there seems to be some indication that they may choose not to pursue such a path. Because the Enterprise version was just launched this year and even the future versions are likely to cost at least ~2x (likely higher) the price of consumer ones, there will be a natural tailwind to Average Sales Price (ASP) per unit. The quantity is perhaps anyone’s guess. Since Quest 3 is going to be launched later this year, I imagine Quest 2 sales will dwindle for much of the year and sales will only pick up after Quest 3 is launched. I assumed continued decline in units sold, but ASP is modeled to increase by $100 due to Quest Pro and Quest 3’s higher price point compared to Quest 2, which was the bestsellers in 2021-22. Beyond 2023, let’s assume VR will keep gaining steady momentum and units sold will increase by 1 mn incrementally each year till 2030, which will mean 11 mn units sold in 2030. With $900 ASP, it implies $9.9 Bn revenue from hardware sales in 2030.
The software revenue is basically assumed to be something similar to Apple’s (AAPL) App Store model in which Meta keeps 30% of whatever gets sold on Quest Platform. Let’s assume each VR device holder will replace the hardware on an average every two years and the install base of Meta’s VR hardware will be the sum of the last two years’ units sold. For software revenue, I assumed the install base of Quest will have one paid app installed on their hardware. If one such app costs $20/month, or $240/year, Meta keeps $72/year from that revenue. If ~21 mn install base pays for one app on an average, it leads to ~$1.5 Bn revenue in 2030.
The other potential revenue source is advertising. Meta-owned apps such as Horizon are likely to monetize via advertising. It’s likely Meta may have multiple apps on their platform, which they may try to monetize via advertising. Let’s say 30% of the install base will be Monthly Active Users (MAU) of one Meta-owned app. Assuming $30 ARPU/year, this implies $180 mn revenue in 2030; so it may be rather inconsequential.
For cost of revenue, I assumed Meta to be gross margin breakeven in VR, thanks to Quest Pro and Quest 3, both of which are unlikely to be negative gross margin products. As Meta gains more scale in hardware, gross margin is modeled to exceed 45% by 2030.
Now, let’s talk about AR. There were media reports last year that indicated Meta is planning to launch its first-generation AR device by 2024 and was also already working on a lighter, more advanced design for 2026, followed by a third version in 2028.
However, on a recent Ask Me Anything (AMA) session on Instagram, Meta’s CTO Boz was asked: “Do you think AR glasses will be delayed by macroeconomic state?” Boz played down macroeconomic influences on AR launch and highlighted technological limitations. Since this AMA happened on February 2nd this year, that doesn’t sound like an optimistic news for a 2024 launch.
Meta’s CTO was also asked: “What tech breakthroughs are needed in order for AR to achieve critical mass? Timeline?” On the question of timeline, he just used one word: “Tough”.
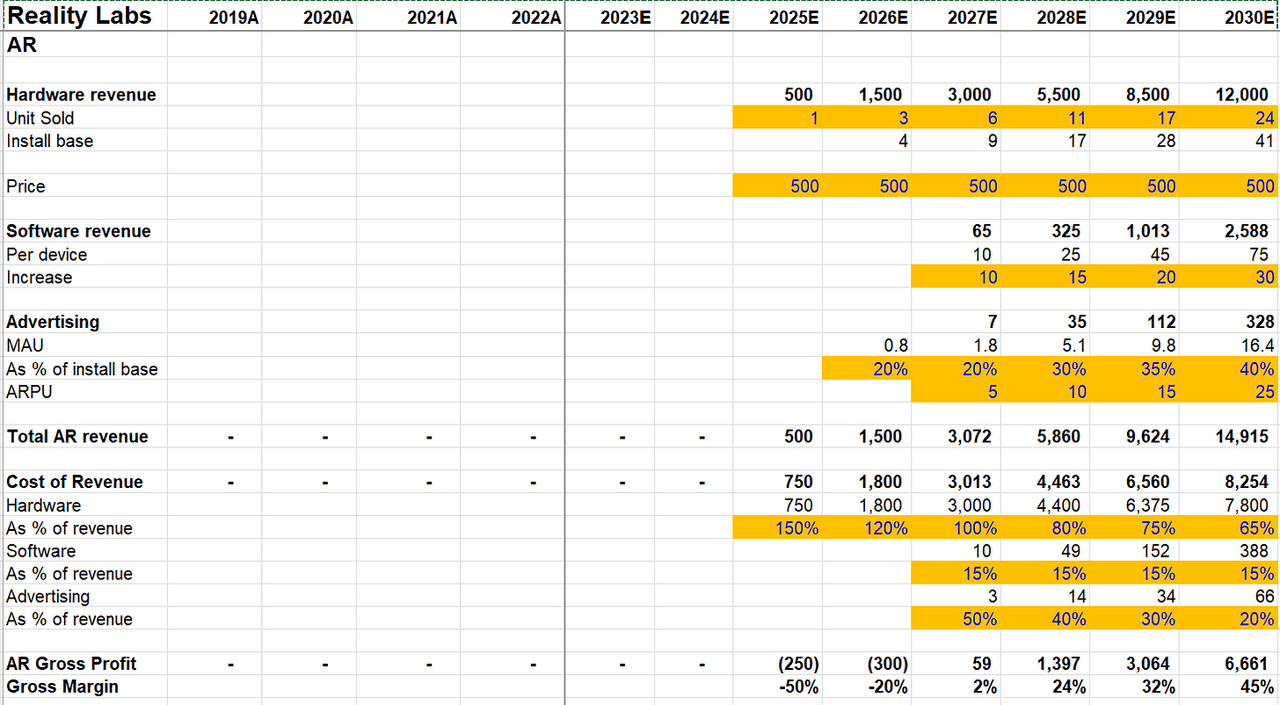
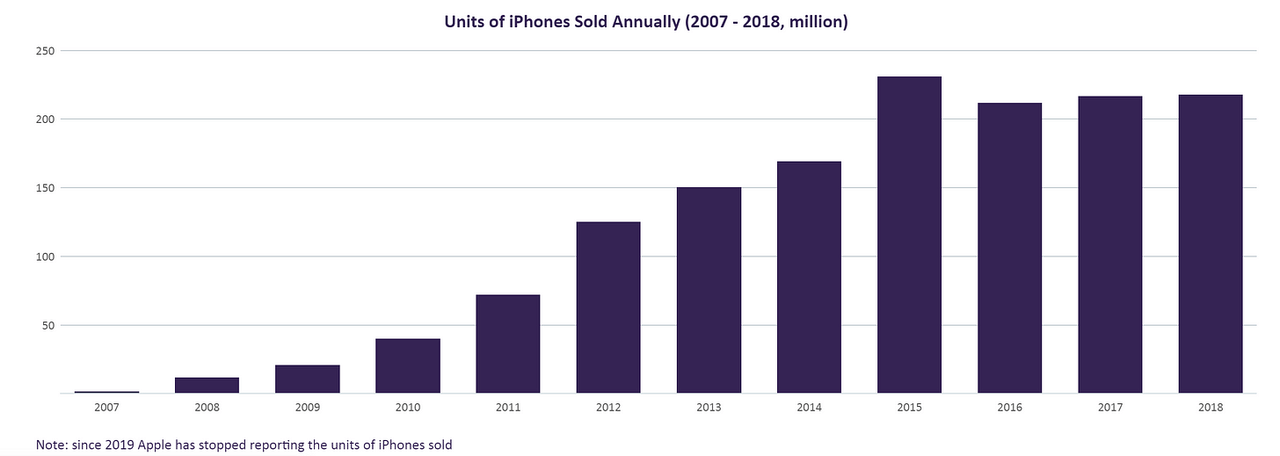
Given the sentiment shared by Boz, I assume Meta may not launch an AR device until late 2025. Zuckerberg repeatedly mentioned before he thinks AR devices (not VR) are the potential replacement for smartphones. It’s hard to say how much it will cost, but given the mass target market and potential use cases, I’m going to assume a $500 price point and a faster adoption curve compared to VR. While I assumed Meta will sell 11 mn VR devices in 2030, I assumed 24 mn AR devices will be sold in 2030. Let me be very clear: the range of estimates is very, very wide here. iPhone unit sales exceeded 100 mn five years after its launch. So, if Meta’s AR launch is anywhere nearly as successful as the iPhone (perhaps the most successful product launch in this century so far), these estimates will look laughable. On the other hand, if the technological limitations prove to be too hard, the devices may turn out to be “meh” to mass consumers, or, at the extreme, Meta may not be able to figure out at all how to build a cost-effective AR device that can appeal to mass consumers. Forecasting is almost always dangerous, but if you are in the investing business, you are always underwriting some estimates/forecasts for the future regardless of the difficulty of forecasting. I encourage readers not to take these estimates seriously and insist on only following the thought process.
At $500 price point and 24 mn unit sales in 2030, I estimate $12 Bn sales of AR hardware. Similar to assumptions made in VR segment, I estimate the install base will have on an average one paid app installed paying $240/year, which means Meta keeps ~30% of that as their net revenue. Advertising assumptions are also similar to the VR segment (and also assumed to be inconsequential).
On a consolidated basis, Reality Labs is modeled to generate $26.5 Bn revenue in 2030, which at first glance may seem like a wild success story. I wish we could eat revenue; let’s move onto expenses!
Reality Labs’ Income Statement is not for the faint-hearted. Reality Labs reported $2.2 Bn revenue and $13.7 Bn losses, implying ~$16 Bn operating expenses in 2022 (Again, Meta (then Facebook) spent $20 Bn in opex in 2017. Sigh!). As explained earlier, I estimated $2.2 Bn for cost of revenue, leaving the rest for R&D, S&M, and G&A. R&D is where most of the money is spent so far, especially since Meta is effectively inventing a lot of the technology required for AR and VR products.
From the rest of the Opex in Reality Labs, I assumed $10 Bn was spent on R&D and $1.55 Bn was spent on both S&M and G&A. Boz mentioned half of the R&D goes to AR and the rest to VR, wearable, and software/content (e.g., Horizon). Given the pressure to launch a viable product to the consumer, I assume R&D intensity is unlikely to go down despite the recent layoff and efficiency talk and assumed $1 Bn increase in R&D expense compared to 2022. Beyond 2023, I assumed R&D to increase $500 mn incrementally each year till 2030. My R&D estimates can be a bit of a Rorschach test. On one hand, the incremental increase seems quite tame and conservative compared to history. On the other hand, Meta is clearly making a huge effort to make a technological breakthrough here; will they need to keep up the intensity once the fundamental problems are solved? And if no breakthrough is possible with $10 Bn R&D spending, I’m not sure 2-3x of that spending will solve the problem either.
Zuckerberg mentioned he thinks Meta needs to be 2-3 years early compared to Apple to make sure they are ahead of the competition. It is very much possible that he may be ahead by 5-7 years, and being too early can sometimes be equivalent to being wrong. Even if Meta makes those technological breakthroughs after spending tens of billions, it may be their competitors who will be the prime beneficiary of those R&D dollars by quickly imitating Meta’s success. For all the talk of Meta being a fast follower of all the cool features other social media companies invent, the tables will perhaps be turned against Meta in the Metaverse!
One question shareholders routinely wonder is whether Meta can just shut down Reality Labs if nothing seems to pan out. While nothing is impossible, I consider it to be extremely unlikely. This goes to the crux of the difficulty of building a hardware startup as opposed to software. When Meta works on a standalone app but fails to gain traction from users, it can basically shut down swiftly without too much noise. But manufacturing hardware at scale requires collaboration with multiple stakeholders whose planning relies on your commitment. Think about Qualcomm (QCOM) or Corning (GLW), who may be partnering with Meta for the AR/VR hardware value chain, and you’ll probably appreciate how challenging it can be for Meta to unilaterally take a decision without creating much repercussion in the future. How can Qualcomm/Corning trust or rely on Meta the next time they think of building hardware? The complexity of the supply chain in hardware will make it much more difficult to make a swift decision.
The other issue is when you are trying to build the next computing platform, you need third-party developers to build on your platform. But why should anyone build on your platform as opposed to building on the current computing platform? Again, the company pursuing the next computing platform may require an unusual display of capital commitment to show their seriousness (perhaps Amazon’s (AMZN) Alexa is a similar victim to such commitment requirement?). I am not smart enough to know what the correct R&D spending should be today or 5-10 years from now at Reality Labs.
If Meta spends the way I have modeled here, despite the splashy $26.5 Bn revenue in 2030 it will incur $115 Bn aggregate losses in 2023-2030. If we add the last four years reported losses, aggregated loss from 2019-2030 will be $150 Bn. This model assumes Reality Labs losses will peak in 2026-27 and start going down afterwards but still incurring $9 Bn losses even in 2030, which may imply breakeven another 3-5 years away even from 2030.
Company Filings, MBI Deep Dives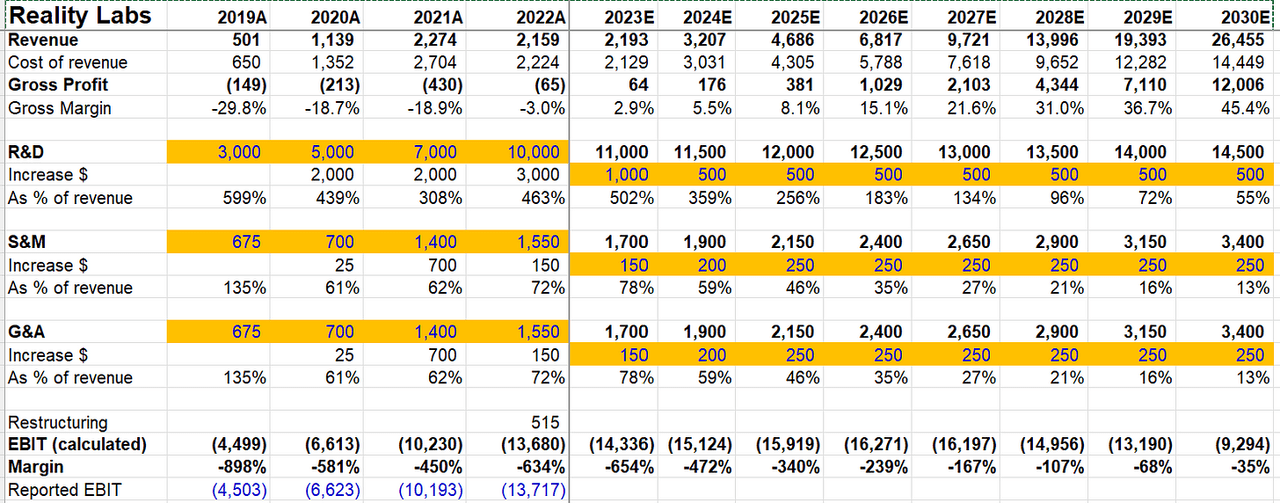
While it is easy to be a bear on Reality Labs, let’s imagine the bull case that Meta will eventually have its “iPhone” moment. In just 7 years after the launch of the iPhone, Apple’s FCF increased from $8.5 Bn in 2008 to $70 Bn in 2015. In 2022, Apple generated $111 Bn FCF and made a cumulative $782 Bn FCF in 2008-2022. Let’s imagine once Meta finds its “iPhone” moment, Reality Labs will post the exact same FCF every year following that “iPhone” moment. What would IRR from Reality Labs Investments be in such a case?
Apple FCF 2008-2022 (Tikr)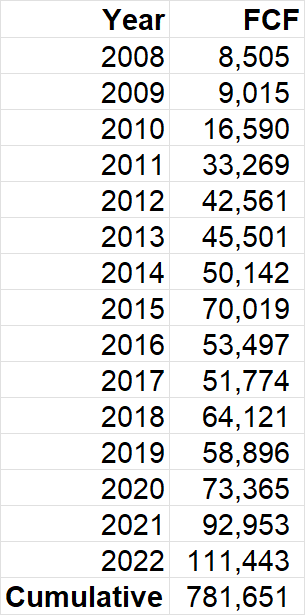
One of the major assumptions to this IRR question is investment required on Reality Labs before it finds its “iPhone” moment. I have created a scenario analysis which ranges from $150 Bn-$500 Bn investment required to get such a moment. Please note we cannot just sum up the aggregate losses to calculate the investment required. We have to take into account the cost of capital. If cost of capital is 7% for Meta and “iPhone” moment arrives in 2035, $13.7 Bn losses in 2022 is equivalent to $33 Bn in 2035 (multiply 13.7 Bn by 1.07^13). Therefore, assuming 2036 to be the starting point for “iPhone” moment (as Apple was in 2008) for the stream of FCFs, $350 Bn may be a more realistic investment amount to consider. Given that assumption, even an “iPhone” moment would lead to just ~15% IRR. Two big takeaways from this are: time is of the essence, and the longer Reality Labs is away from being a real business, the harder it is for Meta to generate a decent IRR even in the stretched bull-case scenario.
(Please note: I took Apple’s 2022 FCF and multiplied it by 10x to calculate the terminal value of Reality Labs which is $1.1 Tn. Why 10x? If Meta could truly disrupt iPhone, iPhone may have a maximum another trillion FCF left to return to shareholders. And if Meta could disrupt Apple in 2035, we also need to entertain the possibility of someone else doing the same to Meta at some point. Again, focus on thought process and not on inconsequential quibbles.)
MBI Deep Dives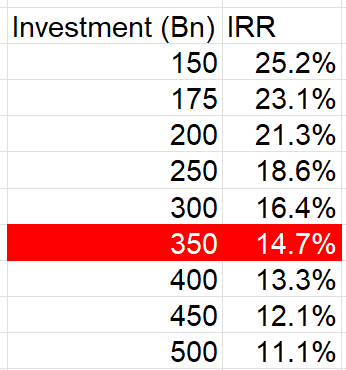
Of course, hardly anyone believes Reality Labs is worth any positive value. The business that’s perhaps worth all of Meta’s market cap (and then some) is Family of Apps. Let’s move onto a potentially more optimistic direction for Meta shareholders now.
Section 3: Family of Apps – Defying the question of durability
Family of Apps (FOA) primarily consists of Facebook, Instagram, Messenger, and WhatsApp. While investors have perennially wondered about the ghost of MySpace, FOA continued to reach new and unforeseen heights in the social media industry.
A 19-year old Mark Zuckerberg co-founded Facebook (currently Meta) in 2004, and it is hard not to be awestruck by what he did in less than couple of decades. Let me contextualize Zuckerberg’s height of success with Facebook (now Meta).
17 years after being founded, Meta reached $95 Bn Gross Profit in 2021. To reach similar gross profit, Alphabet (GOOG, GOOGL), Amazon, Apple, and Microsoft (MSFT) took 22, 24, 42, and 45 years respectively.
Company Filings, MBI Deep Dives
How about GAAP Operating Profit? Meta posted $45 Bn operating profit (including ~$10 Bn losses in Reality Labs) in 2021. To reach similar operating profit, Alphabet, Apple, and Microsoft took 22, 36, and 44 years respectively. To post such operating profit, only Microsoft required lower invested capital than Meta, so Meta was able to reach such profitability with incredible margins and ROIC. Perhaps the AGI will beat Zuckerberg’s record by reaching $45 Bn operating profit faster. While Meta may have gotten a bit derailed in 2022, it would be unfair to not acknowledge, appreciate, and applaud what Zuckerberg and his team did in 2004-2021.
Company Filings, MBI Deep Dives
Okay, let’s look at the FOA business now. I’ll start with users. Let me quickly summarize my assumptions for Daily Active Users (DAU) at Facebook (including Messenger) going forward. Except for Rest of the World (RoW), I have assumed a material deceleration for net new DAU add for Facebook in the 2023-2030 vs. 2017-2022 period (not I’m comparing next 8 years’ numbers versus the last 6 years’, so even for RoW, the net add per year is expected to decelerate).
Last year, I was much more pessimistic about user trends in the long-term following the rapid rise of TikTok (BDNCE). While the TikTok threat is far from fully neutralized, Meta seems quite well-positioned following the increasing popularity of Reels (more on this later).
Company Filings; MBI Deep Dives
With ~3.7 Bn Monthly Active People (MAP) across its Family of Apps, Meta is, of course, highly penetrated in almost all markets (ex-China), and hence, user growth is naturally expected to decelerate. It is interesting, however, that in the last 12 months, Meta added more users than Pinterest (PINS) and Snapchat even in North America.
It can be a bit confounding that Meta not only kept adding new users in North America despite the almost constant negative coverage of their products in legacy media post-2016 election, but the company also kept reporting engagement (e.g., DAU/MAU) metrics that remain the highest in North America compared to other regions in the world. In some sense, many North American Facebook users made a conscious decision to stay on the platform even if they may strongly disapprove of the owner of the platform, indicating the stickiness of these users. Even if Meta had been facing increasing difficulty in attracting “Young Adults” to its properties, especially Facebook, its agility in incorporating features such as Stories and Reels ensured the existing users aren’t leaving the platform en masse.
This isn’t a Deep Dive on Meta, so I cannot go into the intricate details on TikTok vs. Meta, but let me touch on a popular bear case briefly. Bears mention how TikTok eroded the competitive advantage of network effects that Meta enjoyed, since TikTok’s famed algo doesn’t even rely on network effects. While there is truth to that, I do think CAC is much higher for businesses that don’t have much of a network effect. With 3.7 Bn MAP on its platform, if Meta can just copy features from other apps, CAC will increase even higher.
Ultimately, Meta’s Family of Apps business is in the digital distribution business. It has aggregated essentially the entire world (ex-China) and enjoys enormous CAC advantage over anyone who is going to threaten their business. And the CAC math is even more challenging in the post-ATT world when monetization of your user base is a big question mark for all the sub-scaled networks.
Company Filings, MBI Deep Dives, Daloopa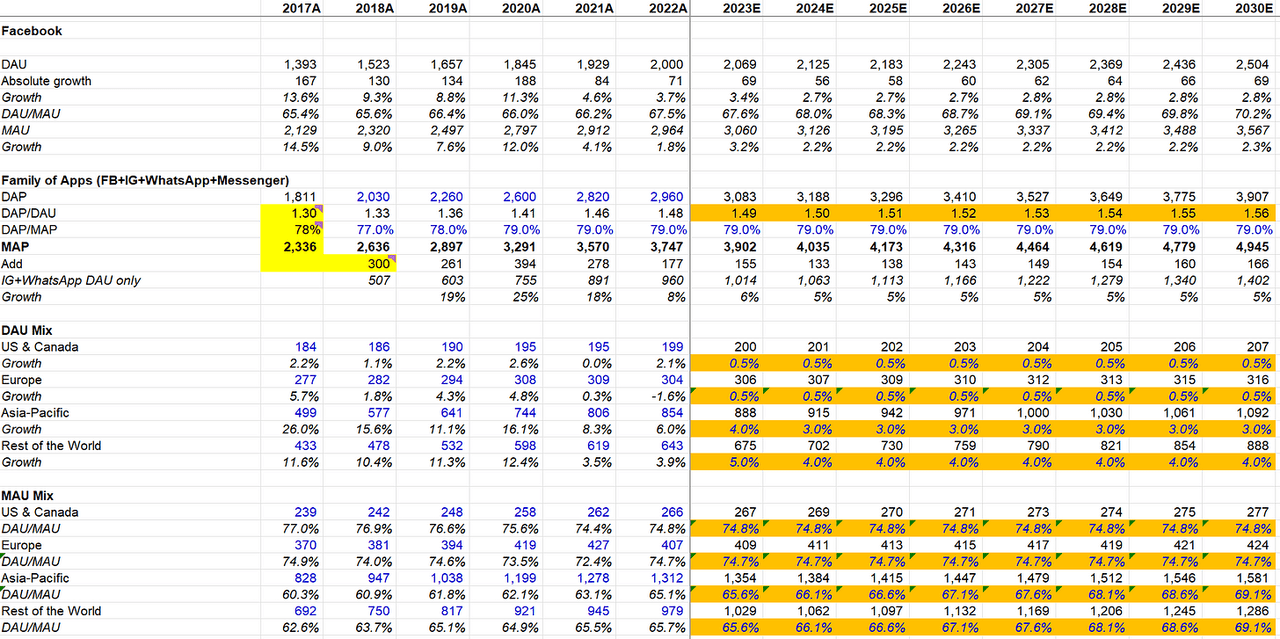
Speaking of monetization, two things are simultaneously likely to be true: a) Meta’s advertising attribution may never be as good as it was pre-ATT, and b) ATT itself will be competitive advantage against sub-scaled social media players (Twitter (TWTR), Snap, Pinterest, and even TikTok) who were struggling even in the pre-ATT world to catch up with Meta’s advertising infrastructure. Reels is currently a headwind for Meta (>20% of time spent) for monetization, and as they expect to reach parity with feed or stories by 2024, I expect it to be a natural tailwind for the business in 2023 and 2024 compared to 2022. Moreover, FX itself was ~$6 Bn headwind in 2022. I’m modeling $5 Bn and $7 Bn advertising revenue growth respectively in the next two years. If FX headwind evaporates (or becomes tailwind) and Reels monetization momentum picks up, my model may be implying not much of a growth at all from 2021 to 2024. Moreover, Meta’s investment improving ad attribution (e.g., Advantage+), >$10 Bn direct-to-messaging business run rate, and massive capex investments in the last two years (discussed later) is also likely to yield some benefit, which, if it improves attribution infra, can be a material tailwind to price per ad and, consequently, revenue growth. Speedwell discussed this eloquently:
… as targeting improves, (ad) inventory opens up, which first depresses prices, as auctions are less competitive. This lowers prices, which makes it even more attractive to advertisers, and more sellers allocate more ad budget to Facebook. Then the advertisers bid up the cost of impressions again and (hopefully) Meta releases new ad targeting improvements which start the cycle again, growing revenues with each iteration while maintaining happy advertisers.
However, given the size of Meta’s advertising business, the macro factors may outweigh all these potential tailwinds in the next couple of years. Therefore, some conservatism may be prudent. Beyond 2024, I do expect the earlier-mentioned tailwinds, along with stabilizing or hopefully improving macro environment, are likely to lead to faster growth.
Company Filings, MBI Deep Dives, Daloopa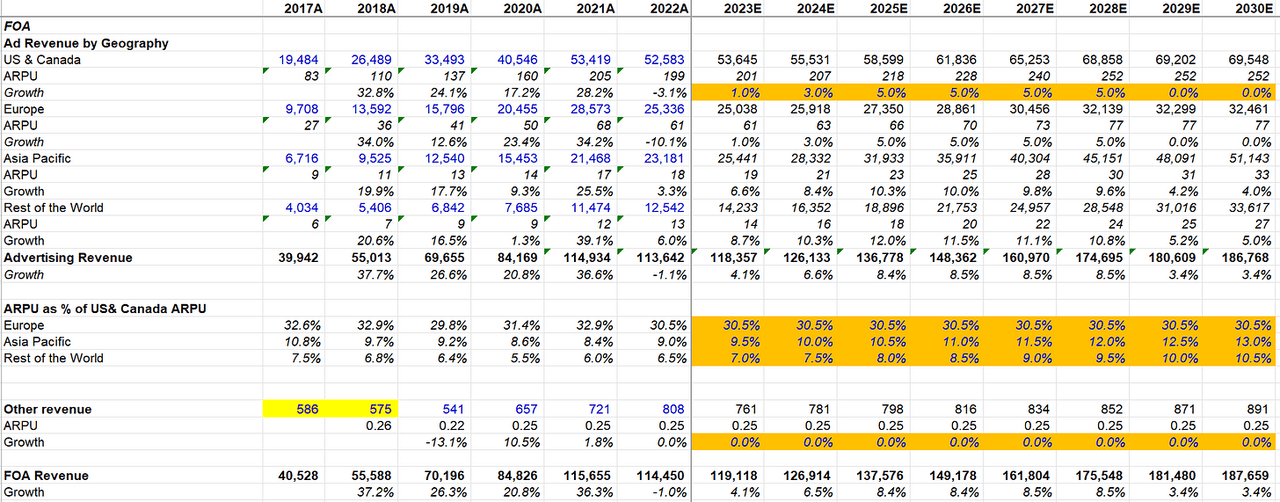
Let’s talk about margins now. First, I want to touch on whether Meta may opt to share revenue with Reels creators, which will obviously have profound gross margin implications.
In its 3Q’22 call, Meta mentioned there are 140 billion Reels played across Facebook and Instagram each day. While they didn’t disclose this number in 4Q’22, let’s assume the number increased to 150 Bn per day in 4Q’22. In the 4Q’22 call, Alphabet disclosed that YouTube Shorts was watched 50 Bn times per day, i.e., one-third of Reels watched per day. Of course, the market leader in short-form video is TikTok, which is a private company and hence doesn’t provide much disclosure.
Several media/analyst reports seem to indicate that people spend ~90 minutes per day on TikTok. In September 2021, TikTok disclosed that they had reached 1 Bn MAU. Let’s assume that today they have 1 Bn DAU and people on TikTok watch 3 videos per minute. That would lead to 270 Bn videos per day.
If we add it all up, market share in short-form video in terms of daily views among these companies is as follows: TikTok 57%, Meta 32%, and YouTube 11%.
YouTube, being the distant third player in this market, is doing the “right” thing. They’re causing a headache for the leaders in this space with a disruptive revenue sharing model. They can afford to do that because YouTube’s core value proposition for Alphabet is to support Google’s broader moat and not necessarily to build compelling economics on a standalone basis.
The question is whether Meta should follow YouTube. The answer should be, at least temporarily, no. Let me explain.
Reels was launched in ~50 countries in August 2020, and YouTube Shorts (beta) was launched the following month. Shorts was then globally released in July 2021. It’s perhaps too early to figure out what the end state looks like. But here’s how I’m currently thinking about this.
At scale, aggregating demand is much more important than aggregating supply. If you have 100 Mn users and 1 Mn content creators, it is more important to increase users to 200 Mn than to increase content creators to 2 Mn. At some point, your marginal content creators bring very little or negligible value to the overall network. But your network value keeps increasing non-linearly with more and more users.
Given Instagram MAU is already ~2 Bn, they have aggregated massive demand. The suppliers have no alternative but to supply content for the platform, especially because the marginal cost to post is close to zero. But the opportunity cost for a content creator not being active on a platform where there is 2 Bn MAU is significantly higher than zero.
TikTok and Meta as current market leaders have strong incentive not to follow the third player here. By following YouTube, they’ll destroy economics and gain effectively almost nothing. If everyone goes for the revenue share model, we are back to the drawing board of aggregating demand. Imagine if short-form video is a $100 Bn gross revenue market in 5-10 years and YouTube eventually gains 30% market share, it will keep only somewhere between $8-16 Bn. If Meta keeps even 20% market share (down from 32% now) in short-form video views, it will make $20 Bn (assuming similar monetization effectiveness across the board). Hence, it may make more sense to let YouTube gain market share than to follow their economic model.
There is another interesting dynamic that may arise due to YouTube’s decision to opt for a revenue share model. Such a decision will effectively cap the number of players to three. TikTok has the largest audience for short-form video, Meta has a superior ad infra to help creators monetize their following, and YouTube has a compelling revenue share model to incentivize creators. How can the 4th, 5th… 100th short-form video players entice the market? Those up-and-coming players are yet to aggregate demand, won’t have good ad infra thanks to ATT, and will therefore be forced to play along with YouTube’s overly generous economic model.
Given this scenario, Meta should primarily focus on gaining market share in short-form video net revenue dollars and should not lose sleep over the allure of time spent and gross revenue market share.
What if TikTok opts for a revenue sharing model? In that case, Meta may indeed have to opt for revenue sharing as well. I don’t consider it likely that TikTok will pursue such a monetization plan, as ByteDance (TikTok’s parent company) allegedly posted only ~56% gross margin in 2021; it seems very unlikely that they are in a position to be generous with the content creators. While many understandably feel content creators deserve direct payment for their work from the platforms themselves, that mostly sounds like a moral plea, and the economic rationale to do so seems quite fragile.
While FOA enjoyed ~87% gross margin in 2017, it is fair to say we may never see such margin ever going forward. Since content has shifted from text to images to video, there is a double whammy for Meta here: just as its monetization has been going through a headwind from ATT, its cost of revenue was increasing due to rising computing intensity to serve increasingly video-dominated feed/surface on the app. Now that Reels itself will go through a multi-year journey in a post-ATT world and Reels is likely to gain share in overall time spent on the platform, gross margin may shrink further from the 2022 level. There can also be potential headwinds from tougher negotiation from music labels to license their music to be used in Reels. I modeled ~150 bps gross margin compression over time from 2023.
I’ll touch on R&D and capex together in the next section. On S&M and G&A, there’s no compelling reason why Meta won’t enjoy some scale benefit over time. In any case, for 2030 I modeled S&M and G&A as a % of sales closer to where it was in the 2017-18 period.
If this plays out as modeled, FOA operating margins will gradually increase from ~41% in 2022 to ~47% in 2030 (vs. peak margins of ~52% in 2017). Moreover, while FOA added ~$15 Bn incremental revenue each year in 2018-2020 and a whopping $30 Bn in 2021 before posting declining revenue in 2022, I didn’t model $15 Bn incremental revenue growth for FOA in any of the next 8 years. If Meta can find its efficiency religion just in FOA business, it may generate an aggregate ~$550 Bn operating profit in 2023-2030. Meta’s current Enterprise Value is ~$425 Bn.
Perhaps the two biggest threats to FOA are: a) regulatory whims specifically directed at FOA business (Europe seems particularly intent on enacting regulations that can affect Meta’s business), and b) perhaps more importantly: TikTok. I expect TikTok to make a concerted effort in integrating more and more social features to create network effects to lower the CAC burden. It remains to be seen how successful they will be in such efforts, but TikTok remains a key risk for FOA’s path to continued domination. Then there are, of course, owners of current mobile computing platform, i.e., Apple. While it appears the worst is behind Meta when it comes to ATT, it is always possible there may be more tricks in Apple’s bags waiting to be revealed over time, creating a persistent overhang on Meta’s core business.
Company Filings, MBI Deep Dives, Daloopa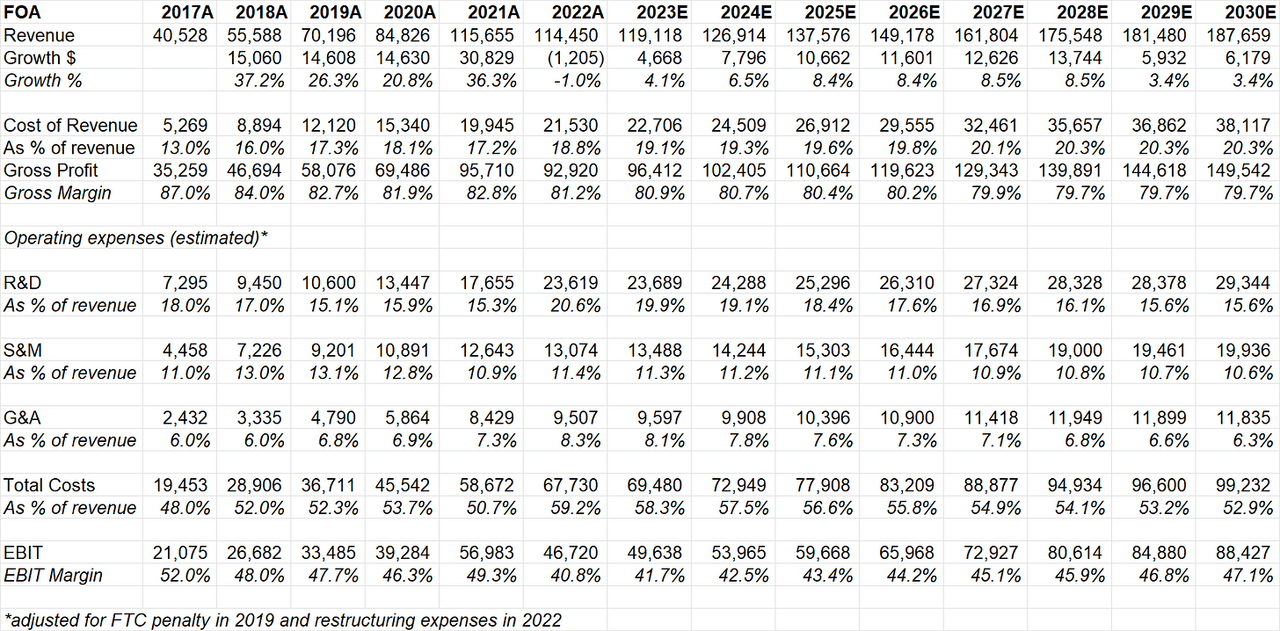
Section 4: Valuation/Model Assumptions
Since I already discussed the estimates for FOA and Reality Labs, the one major assumption I want to focus on in this section is capital expenditures, or capex.
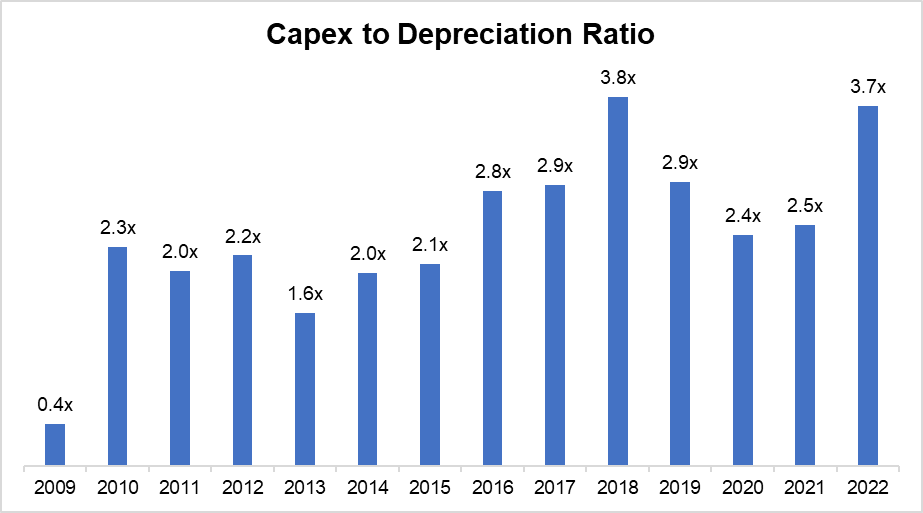
First, some history on Meta’s capex. If you look at the past, Meta went through a couple of capex cycles: a) 2010-2012 period highlights their shift to mobile, and capex as a % of sales peaked at 24% and then gradually declined to 14% in 2016, b) Meta started shifting more from text to images and videos, which made the business more capital-intensive given the increasing computing/storage intensity. During the more recent capex cycle (2018-ongoing), revenue growth maintained a healthy clip in 2018-2021. Therefore, while absolute capex dollars increased from ~$7 Bn in 2017 to ~$19 Bn in 2021, capex as a % of sales continued to decline. However, in 2022, Meta experienced its first-ever revenue decline, while simultaneously increasing capex from $19 Bn in 2021 to $31 Bn in 2022. Moreover, they guided capex $30-33 Bn in 2023 as they make more investments in AI, advertising infra, and expect Reels to be an increasingly greater percentage of time spent on the platform. The Street estimates $30-33 Bn ongoing capex as far as 2027 (estimates not available beyond 2027). What the maintenance capex is for Meta in the long term is one of the key question on valuation, and I think the long-term maintenance capex is potentially $5-10 Bn lower than what the Street may think. Let me explain why.
Company Filings, MBI Deep Dives, Tikr Company Filings, MBI Deep Dives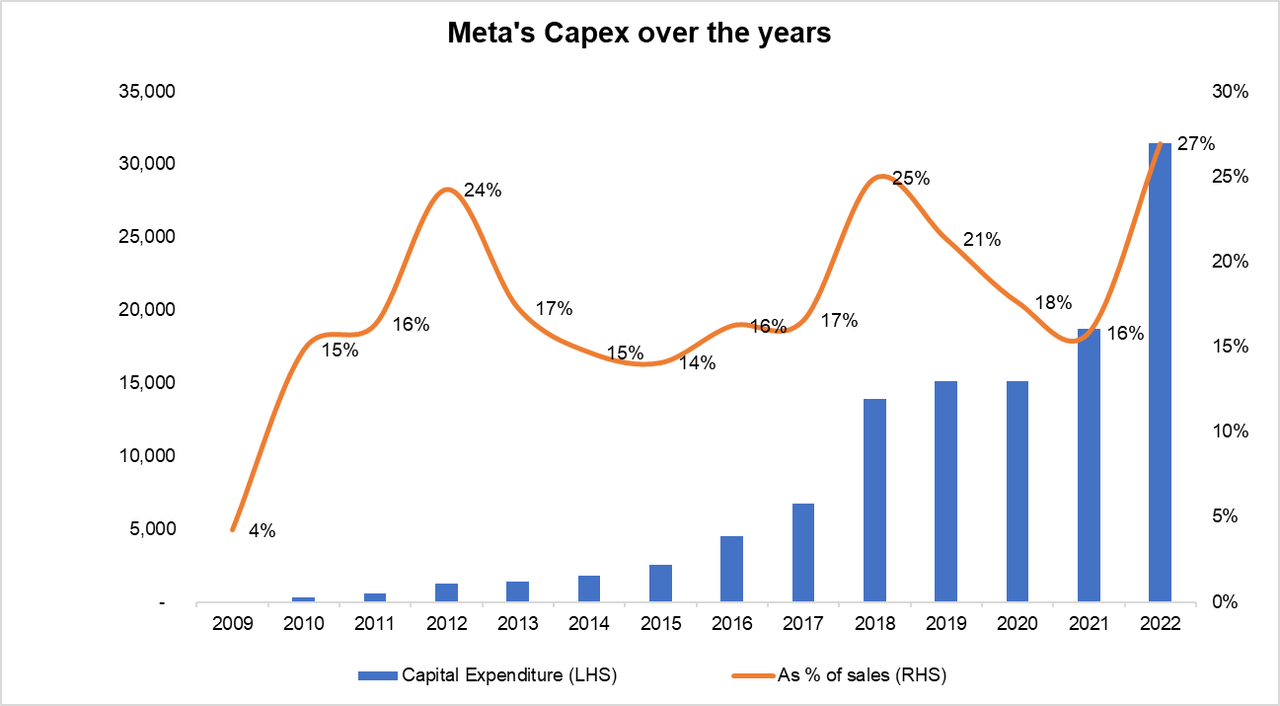
Meta’s Gross PP&E increased by ~$86 Bn in 2022 compared to its 2017 balance. But ~$28 Bn of it is quite discretionary and remnants of the bygone era (Buildings and equipment increased by $23 Bn and $5 Bn respectively during this period). As we enter a very different era for Meta, it is fair to say we are unlikely to see $30 Bn incremental spending on building and office equipment in the next 10 years (let alone 5 years). The much less discretionary expenses are servers and network assets, which Meta continues to ramp up to cater to the increasing computing intensity of users’ consumption.
Company Filings, MBI Deep Dives, Daloopa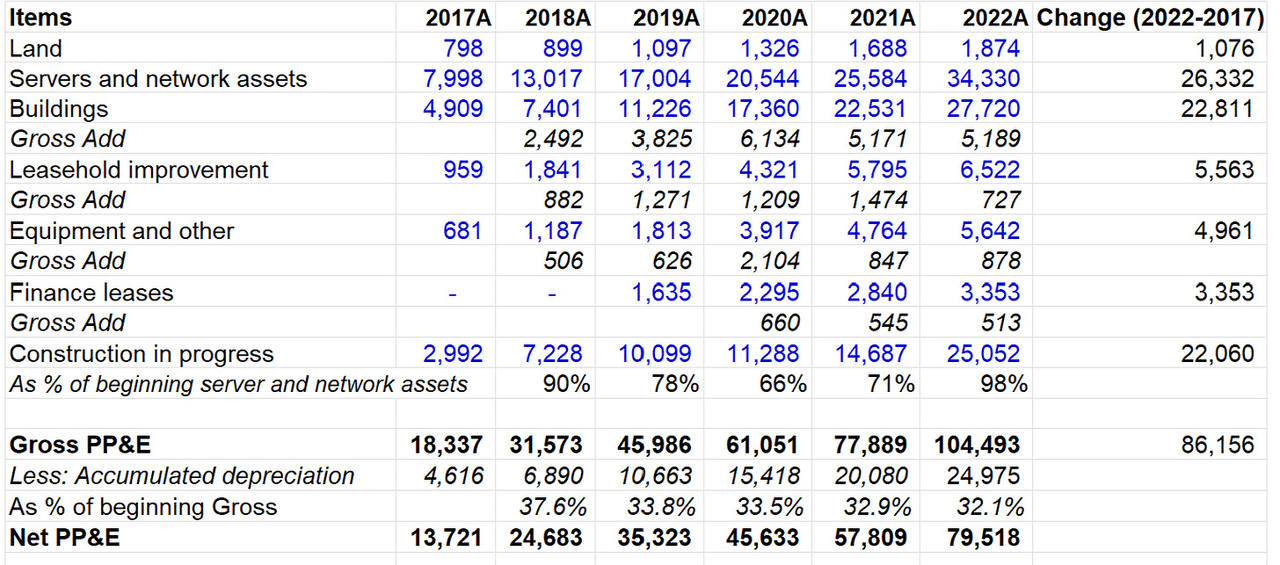
In 2022, Meta had ~$34 Bn servers and network assets, which translated to $9.4 per MAP (Monthly Active People). If Meta adds another ~1.2 Bn MAP in the next 8 years (vs. ~1.4 Bn add in last 5 years) and we keep the assumption that server/network asset per MAP will keep going up (see below), Meta may have ~$87 Bn servers and network assets in 2030. It’s fair to say Meta’s capex is likely to be closer to maintenance capex in 2030, so I’ll focus on that to understand the long-term capex intensity of this business. While Meta used to amortize these assets over 4 years, in the 2022 10-K they increased the useful life to “four to five years”. I am optimistic that they’ll realize similar benefits as Amazon, Alphabet, and Microsoft did, and will learn to lengthen the useful life to 5-6 years. Assuming 5 years’ useful life, depreciation for these assets is ~$17 Bn per year ($87 Bn*20%). If Meta becomes prudent in keeping their discretionary expenditure in check, depreciation for the rest of PP&E could easily be ~$3-5 Bn.
So, we may be looking at $20-25 Bn maintenance capex once the current capex cycle normalizes.
Company Filings, MBI Deep Dives
A natural question may arise on whether the computing cost intensity will be even higher than I assumed. I modeled almost doubling of computing cost intensity per user in 2030 (vs. 2022). Could it be a 150% increase? 200%? While I don’t think anyone really knows the correct answer here, that seems unlikely to me. Not only may computing cost just get a lot cheaper, but also there may be some interesting implication if computing intensity is indeed materially higher than modeled here. ARPU for Rest of the World (RoW), i.e., ex North America, Europe, APAC, was just $13 in 2022. Therefore, if computing intensity keeps rising materially faster, it may be financially unfeasible for companies to serve those users. In such a case, it may even be possible that Meta may not make certain features such as Reels available (or may limit usage or provide max time limit) in these cost-prohibitive countries.
It is more likely that we are closer to the end of this current capex cycle (than in the middle), and capex may possibly peak in 2023 and may start towards more long-term maintenance capex over time. Of course, companies do investment through balance sheet (capex) and income statement (mostly R&D). It’s perhaps more relevant to look at both R&D and capex together to get a sense of investment made by the company. The sum of capex and R&D was ~$34 Bn even in 2020, which increased to $43 Bn in 2021 and $67 Bn in 2022, so it effectively doubled in just two years. Analysts can understandably feel nervous about lowering capex estimates when it simply has never gone down in Meta’s history. However, looking at the past to extrapolate the future may prove to be wrong once this capex cycle normalizes.
Company Filings, MBI Deep Dives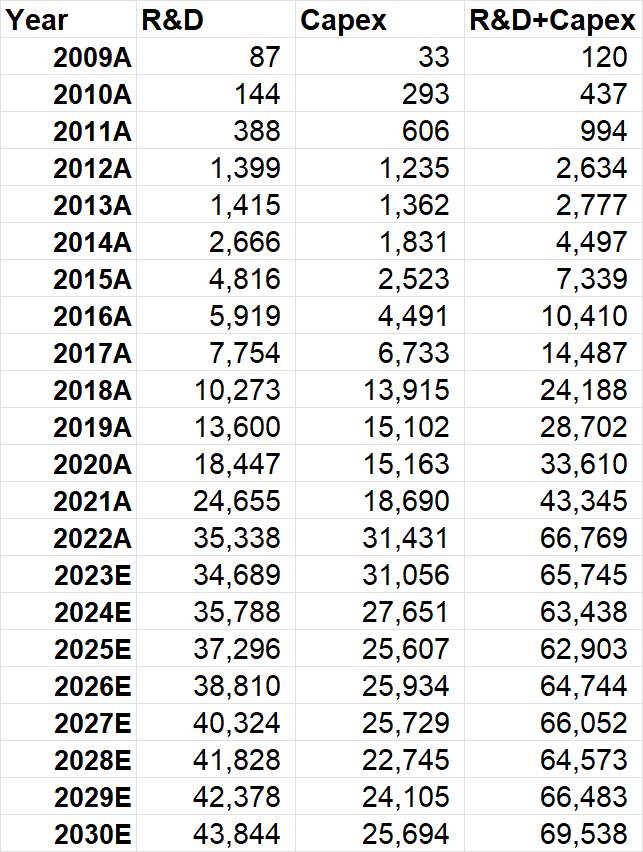
Looking at other big tech (admittedly there are some notable exclusions here), it is hard not to infer that Mark Zuckerberg wants to go above and beyond to compete with other big tech even though other big techs’ Enterprise Value (EV) is 2.5x-5x larger than Meta. Of course, just spending on capex and R&D doesn’t mean much; what matters is the efficiency of the spend. If Metaverse proves to be nothing, all of your billions of capex + R&D spent on Reality Labs (mostly R&D) may not be worth much either. Therefore, I would caution in inferring too much from the table below, but it does underscore that Meta’s spending on R&D and capex is already staggering, and assuming ever-increasing spending going forward implies a depth of ineptitude in the management team at the helm. Time will tell whether my capex and R&D assumptions are in the right ballpark.
MBI Deep Dives
One concern investors may have is, since I am assuming $115 Bn losses in 2023-2030 period for Reality Labs and mostly maintaining the current capex + R&D spent, what does ROIC look like in such a scenario? Meta’s ROIC dropped precipitously from the mid-20s in 2018-2021 to the mid-teens in 2022, and despite my Reality Labs losses and capex + R&D assumptions, ROIC may still revert back to the 20s over time. As we all know, the longer it goes, the more likely it is that shareholders’ return will get closer and closer to ROIC. While return in a particular year may be volatile based on numerous factors, long-term (think decades, not years) return will certainly have a close resemblance to the company’s ROIC.
Company Filings, MBI Deep Dives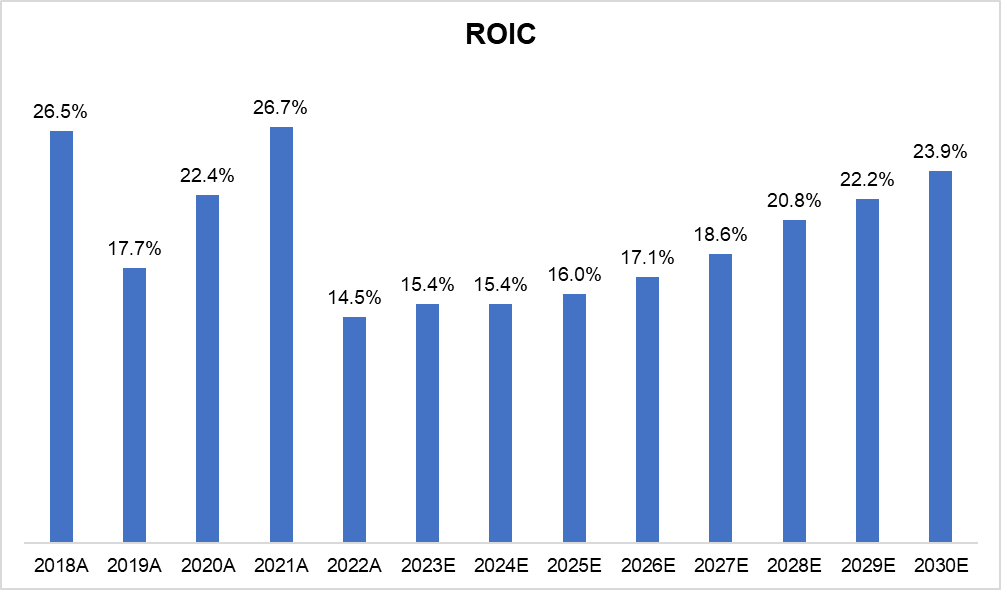
Valuation: If these assumptions prove to be ballpark right, I need to assume just a 12x terminal FCF (fully burdened for SBC in terminal year, which is why 2030 FCF dropped versus 2029; in the interim years, dilution is modeled and no SBC is deducted) multiple to generate 10% IRR. Since this is consolidated FCF, it includes $9 Bn losses assumed for Reality Labs in 2030. What it means is I am capitalizing the losses of Reality Labs by exit multiple, which bulls might think it to be a bit draconian assumption. I tend to agree, but it is hard to do SOTP until and unless we know the kind of milestones Meta may have internally to decide how they want to manage their investments in Reality Labs. However, the closer Reality Labs gets to be a real business and gets closer to breakeven, investors may rethink their valuation approach and may want to value FOA and Reality Labs using SOTP. In such case, 12x consolidated terminal FCF would prove to be quite a conservative assumption.
If terminal consolidated FCF is 18x, IRR would be ~15%; at 25x, IRR would improve to be ~19%. (Again, remember I’m still capitalizing Reality Labs losses here, since these are all consolidated numbers; therefore, the higher the multiple, Reality Labs is valued even more negatively, which is a bit nonsensical. So, in reality you may not need to assume 25x FCF multiple to generate ~20% IRR here.) I also assumed Meta’s net cash to decrease from ~$31 Bn in 2022 to ~$2 Bn in 2030, as Meta started issuing debts recently and expressed its interest in accessing debt market more over time. All the FCF is assumed to be used to buy back stocks, while the stock price is modeled to increase at an IRR rate over the projected period. Similarly, to keep things consistent, SBC was assumed to be issued at the same stock price the shares are implied to be repurchased each year.
Section 5: Final words
If you notice my assumptions carefully, I am not modeling Meta to be extremely fit overnight (that can only happen in spreadsheets but not in reality). I am, however, indeed expecting Meta to recognize the lack of discipline shown in the last 12-18 months. While media reports may make it seem like Meta has been a hot mess for quite some time (most companies indeed are), the numbers tell us it was one of the most wonderfully scaled businesses in the history of capitalism up until 2021. Should we put more weight on 2022 or should we consider the 2004-2021 period a better reflection of how Mark Zuckerberg wants to run this company? The next couple of years may give us a more clear answer. The best companies are not efficiently run for any particular year; efficiency is usually their modus operandi. It is perhaps very likely that following the “Year of Efficiency”, Zuckerberg may prefer such a year much more than what he and Meta experienced in 2022. “The Year of Efficiency” needs to last a decade for Meta to be the kind of company Zuckerberg likely wishes Meta to be.
Even though some investors think Zuckerberg may simply choose to not care about shareholders, I do not think that is a viable option for him. His employees are paid in stocks, and if their stocks continue to dwindle when other Big Tech reaches new heights, he will have hard time attracting top talent.
Personally, I am willing to give a a lot of rope for once-in-a-generation founders such as Zuckerberg. Of course, that rope’s length is not infinite.
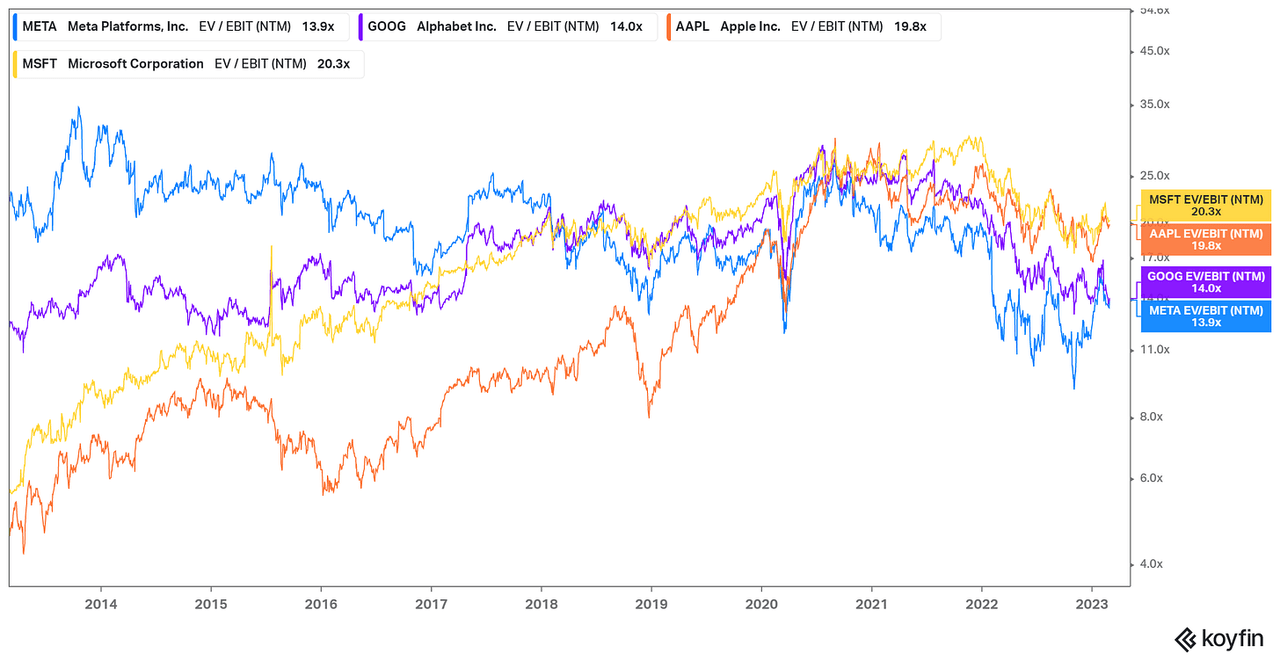
One final thing I would like to highlight in this update is how incredibly challenging it can be to assess the moat even for some of the most widely followed companies such as Big Tech. The following chart is a humble reminder to me (and also for readers) that sentiment can change rapidly in unforeseen ways in the Big Tech land. 10 years ago, Apple and Microsoft were in the doghouse in investors’ books, and it was Meta (then Facebook) and Alphabet (then Google) that were enjoying favorable sentiment from the Street. Today, the situation has been completely reversed.
It is quite challenging, for example, to predict with high conviction how generative AI may shape the tech landscape. Meta has been one of the most aggressive investors (through capex and R&D) in that space, and if AI indeed becomes the defining force 5-10 years from now in protecting moats, Meta may find itself one of the strongest companies in the world in 2030. We are, however, almost certainly not paying for such a rosy picture to unfold.
Disclosure: I own January 2025 Call Options and shares of Meta Platforms.
Editor’s Note: The summary bullets for this article were chosen by Seeking Alpha editors.

