Summary:
- Meta Platforms has excelled in AI execution, leading to solid revenue growth and cash flow, which will continue throughout 2024.
- While the valuation is still relatively low risk, it has climbed above its historical average, indicating a potential top in expectations.
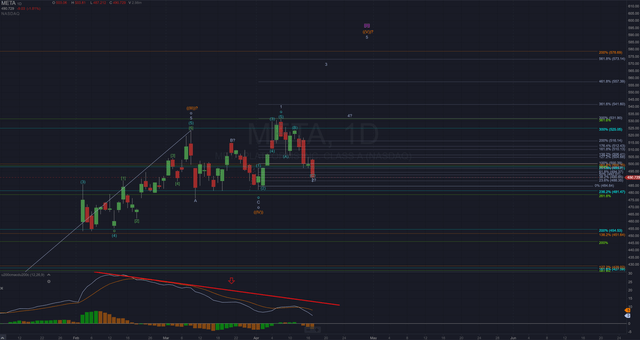
- However, chart analysis suggests there may be one final rally to about $600 following earnings before a larger correction consuming the rest of 2024 begins.
- With this in mind, I’m moving from a buy to a hold and will trim my long position further if it gets to $580-$600.
s-cphoto
If there’s been a company whose AI prospects and execution from a functional and product standpoint have been better than Meta Platforms (NASDAQ:META), I’m not aware of them. I’ve touted Meta as one of the leading AI “retail” companies, showcasing its ability to not only use AI to improve its user engagement but also its ad targeting and ad analytics systems. It has relegated itself as a true AI-across-the-board company in a way other companies at its level have yet to be able to hit with stride. Because of this superior AI execution, growth, and cash flow have never been better, and they can’t be much better looking ahead. The problem, however, is outside the walls of its executive suite. My concern lies not with the company’s growth prospects but its chart. After all, the stock price matters in the end for investors, and I see it approaching a top, leading to a retracement and consolidation, one that could last months or quarters.
I’ve pounded the table on Meta Platforms for the better part of 2023 and all of 2024 to this point. The returns have spoken for themselves, as I’m up about 73% since my August call touting Meta’s AI superiority. Moreover, in the new year, I emphasized the business is being underestimated and will see quite the upward estimate revisions as the quarters move into view. I still expect this to be the case, as analyst estimates of $20.02 in EPS lag my pre-Q4 earnings report estimate of $21.79.
But as my admittedly conservative share price target of $435 required one to wave as it went by, the stock in the low-to-mid $500s is knocking not only on a valuation shift, but perhaps a top in the chart’s expectations. This doesn’t mean the company’s Q1 earnings report for next week can’t give the stock another jolt toward the mid-to-upper $500 range, but it would become an area where I’d further trim my long position.
Great Fundamental Outlook
While a fantastic growth outlook for 2024 is very much on the table, and I’m confident in my estimates, the stock doesn’t necessarily have to be in lockstep with the fundamentals, and many times isn’t. Estimating a low 20% yearly revenue growth would do wonders for my EPS estimates, which I’ve bumped to $22.34 since January. You can see below where I stand vs. analysts on revenue this coming year.
Chart mine, data from Seeking Alpha and my estimates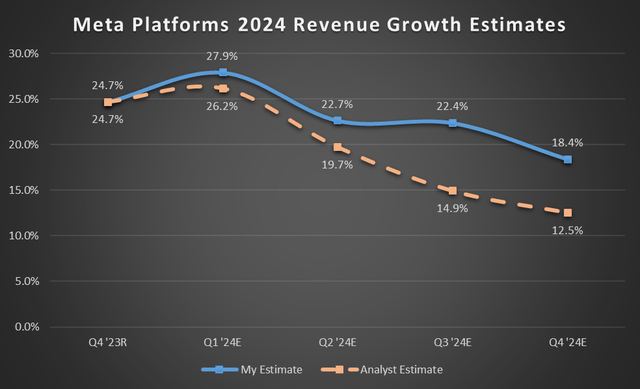
The bearish angle would see this as slowing growth after a nice acceleration in 2023 (shown below). From a fundamental perspective, this could entice some selling pressure.
Chart mine, data from Seeking Alpha and my estimates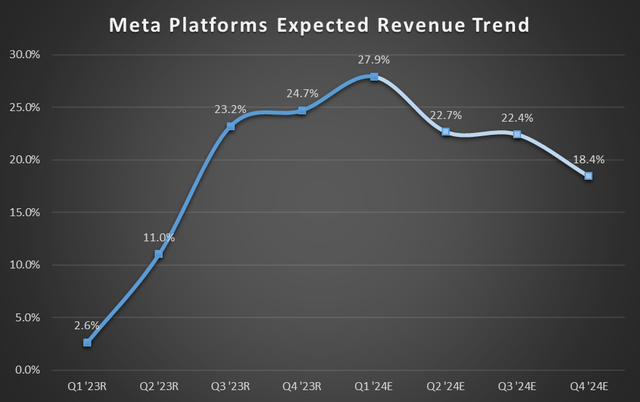
The company’s AI prospects I’ve touted over the last year are still very much in play, and the overall digital ad industry is gaining traction in 2024. As the company continues to put effort into getting Reels up to mature inventory levels and monetization, several tailwinds provide the upside confidence I have. It’s not unlikely I’ll have to revise my estimates higher after next week’s earnings report.
Very Fair Valuation
Fundamentals, check. Valuation now needs some attention.
And its valuation is still very much on the less risky end of investments in the tech industry, it has climbed back above its historical average of the last five years in the last two months.
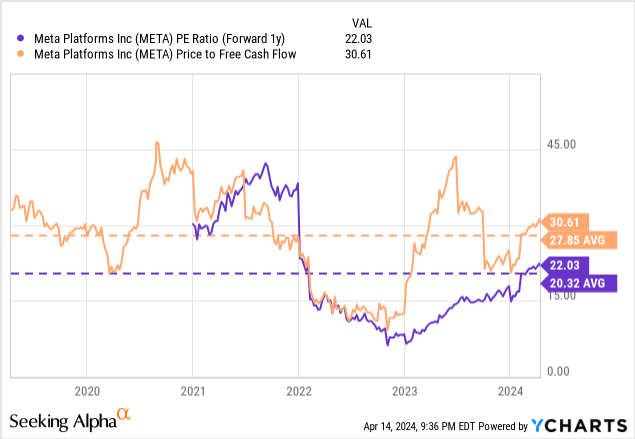
This isn’t a dire valuation situation, considering many other stocks have far less growth than Meta’s mid-20% topline growth. Case in point: Apple (AAPL), with its low single-digit growth but higher valuation.
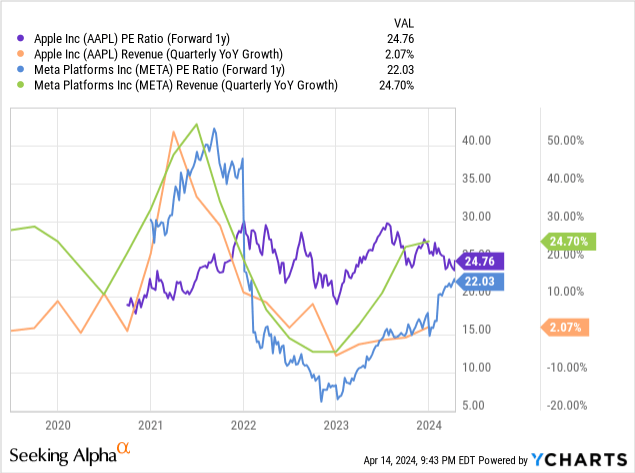
But Meta is now moving into a more historically fair valuation area, even with my calculated outperformance. Based on those estimates and valuation, I could make a case for $560-$600 over the coming weeks and months. Even at $600, the stock would be trading at a forward P/E of 27 using my latest EPS estimate, which is historically in line.
But The Chart Looks Less Certain Of Returns Into The Rest Of 2024
While the fundamentals look quite bullish, even though revenue growth may be decelerating, and the valuation is still relatively fair, the chart suggests bulls may be reaching a point of exhaustion. They appear to be losing steam, as the fundamentals aren’t improving over expectations nearly as much as they were in the latter half of last year.
This isn’t to say Meta can’t push a bit higher on the back of a great earnings report and improved outlook – because it very much can (and looks like it will) – but the chart is in the zone where a top may be forming. And this top may not be for just a few weeks or even a few months; it may be well into the end of the year. The upside is this prolonged correction should eventually give way to a setup capable of pushing deep into all-time highs later on – likely in 2025 and 2026.
In the near term (such as earnings next week and the following weeks), Meta is on track to still provide one more rally to $580-$600. With five waves up off the wave (IV) low and a corrective, three-wave pullback for wave 2 of (V) so far, the likelihood of seeing a rally post earnings is reasonably high. This would complete the entire wave I structure, as it would reach the expected 200% Fib extension based on the lower degree wave pattern.
Moreover, the MACD indicates the longer-term rally is coming to an end, as there’s bearish divergence on the MACD chart (indicated by my red line) starting before its topping in wave (III). It, therefore, adds credence this may be the last rally capable of pushing into all-time highs for much or all of 2024. And the more and more I look at the timing of earnings, the more it seems clear we may see it be a catalyst for wave 3 of (V).
So the path near-term looks to be up, but there’s nothing to say it hasn’t already topped, so be on guard. This is why I’ve been advising my subscribers to take profits as we’ve been climbing, slowly scaling out of long positions.
Using All My Tools And Methods
Before you think I’m bearish on Meta as a whole, I’m not. The company’s business and fundamentals look quite strong for the coming year. However, according to the charts, the rest of 2024 looks much less certain for upside, even though the fundamentals and valuation could certainly support something to $600. Taking the entire picture of fundamentals, valuation, and chart, I’m moving to a hold and will trim as it approaches $600.
If what I expect plays out longer term, I plan on re-entering my long positions at much lower levels later in 2024. It all depends on where we top, but a retracement of 40% to 50% of the rally off the November 2022 low isn’t unlikely.
Analyst’s Disclosure: I/we have a beneficial long position in the shares of META either through stock ownership, options, or other derivatives. I wrote this article myself, and it expresses my own opinions. I am not receiving compensation for it (other than from Seeking Alpha). I have no business relationship with any company whose stock is mentioned in this article.
Seeking Alpha’s Disclosure: Past performance is no guarantee of future results. No recommendation or advice is being given as to whether any investment is suitable for a particular investor. Any views or opinions expressed above may not reflect those of Seeking Alpha as a whole. Seeking Alpha is not a licensed securities dealer, broker or US investment adviser or investment bank. Our analysts are third party authors that include both professional investors and individual investors who may not be licensed or certified by any institute or regulatory body.
Join The Top AI And Tech Investing Group
Do two things to further your tech portfolio. First, click the ‘Follow’ button below next to my name. Then sign up to be a free member of my investing group Tech Cache. You’ll get more free content from me, no paywall, and no credit card. If you want the trading strategy and technical chart analysis of the article you just read, step up to being a paid subscriber with a two-week free trial and read it immediately.

