Summary:
- A bad year for Meta in 2022 has seen a rise in the share price as the year closed out and into 2023.
- We will examine what could have caused the steep decline last year and any adjustments the company has made moving forward.
- Switching to the charts, we will go through the bullish three wave pattern that has just formed and outline the next target price region.
Khanchit Khirisutchalual
Last year Meta (NASDAQ:META) grabbed the record for the biggest single day share valuation drop in US history seeing $237 Billion wiped off its value overnight. February 2022 saw a steep decline in Meta’s share price, from $326 to $190 to be precise. So why was this? Well 2021 Q4 earnings came in below expectations, also inflation and supply chain issues were impacting advertisers budgets and another first and perhaps most worrying, DAUs or daily active users had declined slightly, the first quarterly decline on DAU’s record. Also concerns over transition to the metaverse were confirmed in October after Meta’s, Horizion Worlds launch in August, less than 200,000 people had signed up, far less than expected.
But this year, Meta clearly has plans to implement some cost saving cut backs along with the intention to grow the Metaverse and with Mark Zuckerberg looking to see over a Billion users if the plan realizes itself, it could be a lucrative bet given that users will be able to purchase virtual goods and services with Meta positioned at the forefront.
November saw an 11,000 employee layoff with the CEO also announcing Meta would be reducing its real estate footprint and cutting back on some employee perks.
So with some adjustments coming from Meta along with a fresh calendar year to attempt to grow the transition over to the Metaverse combined with the share price touching the $80 region? Could investors be spotting a future opportunity at a reasonable price and has Meta bottomed? Potentially….
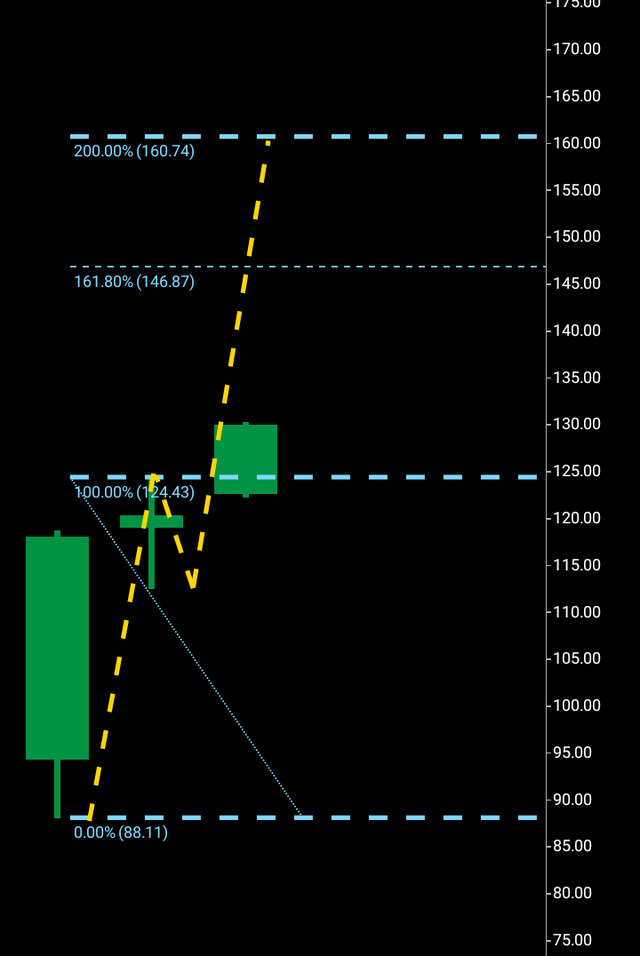
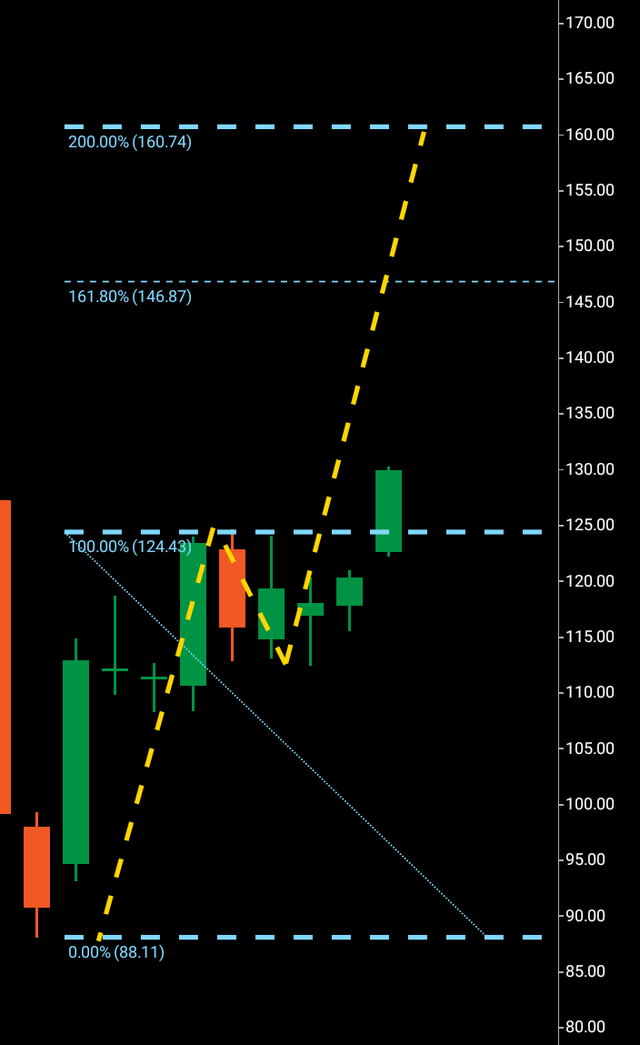
In June of last year I issued a sell signal circa $160 with an $81 target to be exact. So far Meta has touched the $88 price region and has now shown a turn around three wave bullish pattern on the weekly chart. Unlike other leading equities that are still in technical limbo, Meta has actually seen a protracted period of stable buying in contrast.
Now we can move to the charts to examine the bullish wave pattern and where Meta is due to land next.
We can see on the left of the screen the bearish candle touch off the late $80 price region before shares encountered four additional weeks of positive territory, the red bearish candle rejected off $124 confirms the wave one and two and the following break above the rejected area of $124 confirming the third wave.
$146 should be a direct next stop with $160 the overall target for a numerical copy of the wave one.
Now moving to the monthly, it is interesting to see where a potential three wave pattern may form here, it is when an equity reaches and forms a three wave pattern on the monthly that the ultimate timeframe bullish or bearish pattern has been cemented and we can see from this monthly chart there has been no rejection candle yet, it is possible the rejection could come at $146 or $160 we will not know until the price reaches there if it does so.
Meta monthly chart (C Trader )
To finalize, it is possible that Meta has bottomed and will continue to $160 while forming a three wave pattern on the monthly chart which in that case would lend greater probability that this equity has seen a bottoming pattern. It is also possible Meta will see some continued buying before dropping and seeing a new low below $88. I would expect Meta to arrive at $160 relatively quickly and am issuing a buy signal while also waiting for potential bullish three wave pattern on the monthly chart to form which could lead this equity to further highs, should a pattern form on the monthly I will be e publishing a follow up article with Seeking Alpha. I expect Meta to achieve its $160 target in 30-90 days.
About the Three Wave Theory
The three wave theory was designed to be able to identify exact probable price action of a financial instrument. A financial market cannot navigate it’s way significantly higher or lower without making waves. Waves are essentially a mismatch between buyers and sellers and print a picture of a probable direction and target for a financial instrument. When waves one and two have been formed, it is the point of higher high/lower low that gives the technical indication of the future direction. A wave one will continue from a low to a high point before it finds significant enough rejection to then form the wave two. When a third wave breaks into a higher high/lower low the only probable numerical target bearing available on a financial chart is the equivalent of the wave one low to high point. It is highly probable that the wave three will look to numerically replicate wave one before it makes its future directional decision. It may continue past its third wave target but it is only the wave one evidence that a price was able to continue before rejection that is available to look to as a probable target for a third wave.
Disclosure: I/we have no stock, option or similar derivative position in any of the companies mentioned, and no plans to initiate any such positions within the next 72 hours. I wrote this article myself, and it expresses my own opinions. I am not receiving compensation for it (other than from Seeking Alpha). I have no business relationship with any company whose stock is mentioned in this article.

