Summary:
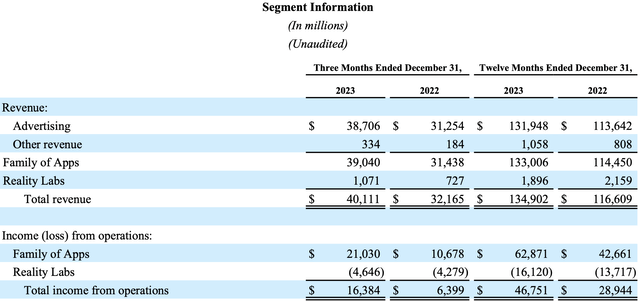
- Meta has improved its financial condition since Q3 2023, mainly by cost cuts and a 15.9% surge on its family of apps revenue.
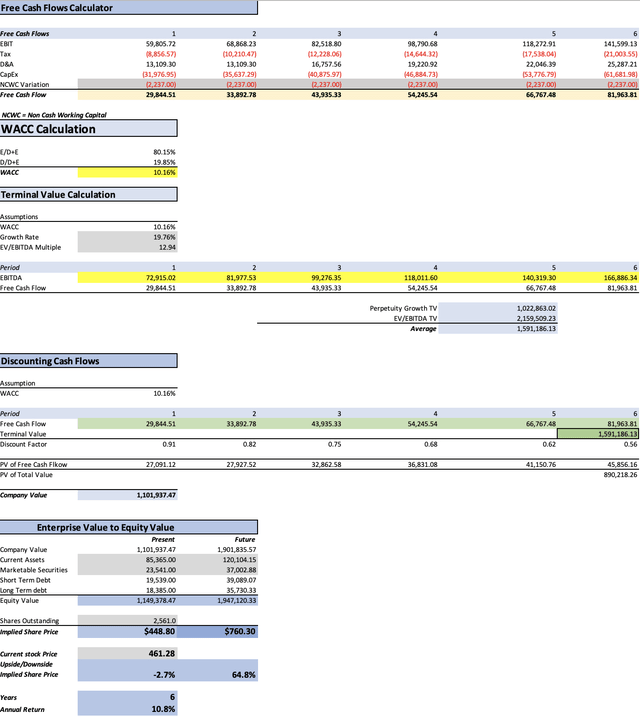
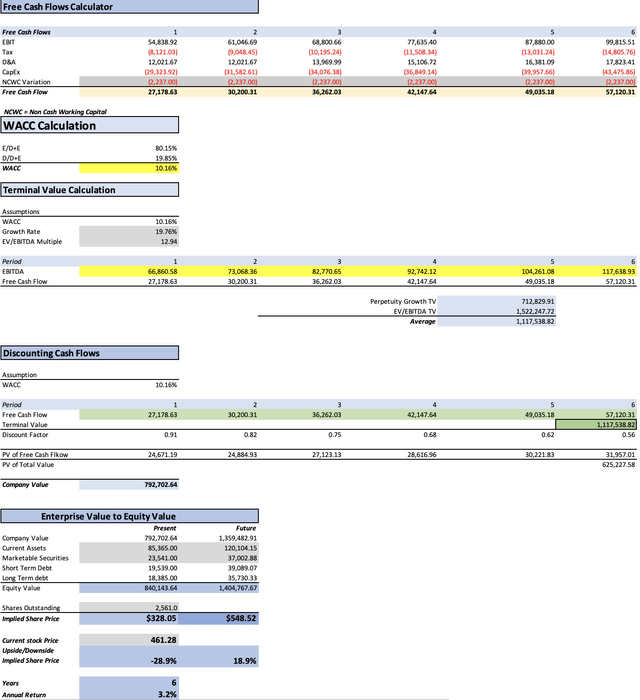
- Analysts’ estimates suggest a fair price of $448.80 for META stock, with a future price of $760.30. However, alternative estimates indicate a fair price of $328.05.
- For the Company to deliver a 28% upside, it would need its advertising business to grow by 18% annually, and its reality labs by 75% annually.
- Since high growth rates are needed in order to Meta hugely undervalued, I am reiterating my hold rating.
JOSH EDELSON/AFP via Getty Images
Thesis
In my previous article about Meta Platforms, Inc. (NASDAQ:META) (released in Q3 2023), I assigned a fair stock price of $336.8 and a future stock price of $545.5. Since then, the stock has rallied by 55%.
In this article, I will reevaluate Meta based on the Q4 2023 earnings. After using two valuation models, I have concluded that the fair stock price is $448.80 and the future stock price is $760.30. This means that Meta stock is slightly overvalued.
Upon examining why my previous model didn’t predict the 55% rally of Meta’s stock, I have arrived at the conclusion that the reason was a mix of factors, including the adjustment to valuation that stock underwent during the transition to another year, and that I completely disregarded the possibility of Meta achieving the high estimates proposed by the third model in my previous article.
For these reasons, I am maintaining my rating on Meta’s stock at a “hold”.
Seeking Alpha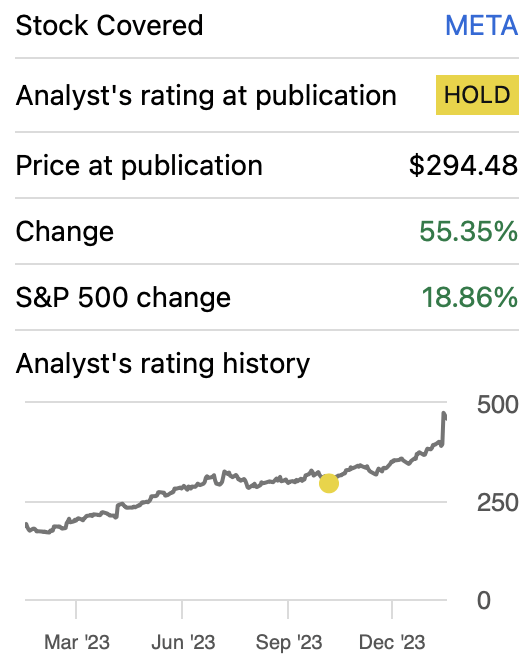
Overview
Meta rose 15% on Q4 2023 earnings after it beat on EPS by $0.39 ($998.79 million), and in revenue by $940 million. Furthermore, the company declared a quarterly $0.50 per share dividend for class A and B shares. This dividend would be $2 annually if it’s maintained.
Then it also raised its Q1 2024 outlook over the consensus of $33.87 billion, now it stands at the range of $34.5 billion to $37 billion.
As it’s widely known, Meta’s revenue is primarily derived from advertisements since their family of apps (Instagram, Facebook, etc.) are for most of the users, free. The worldwide digital advertising market is expected to grow at a CAGR of 6.94%.
The segment with the most growth potential is, undoubtedly, the reality labs. The metaverse market is expected to grow at a rate of 36.8% from 2023 to 2030. If Meta can sustain this growth, the metaverse segment has the potential to generate $10.6 billion by 2028.
Author’s Calculations based on Statista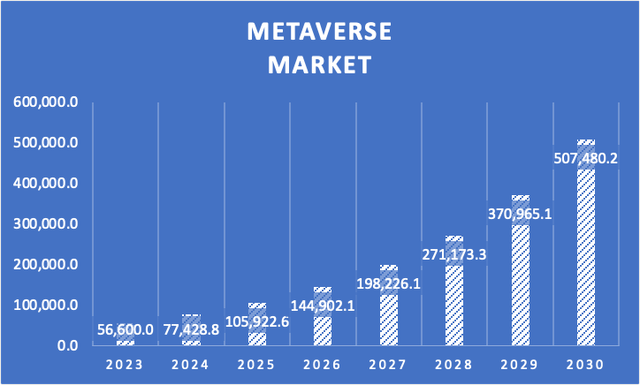
Financials
Meta’s revenue has been increasing at a rate of 38.6% annually. Operating income has grown slower at a 23.8% annually. Net income has grown slightly faster than operating income at a 24.2%.
Since my previous article, which was released in Q3 2023, revenue has increased by 6.30%, operating income by a decent 13%, and net income by a massive 31%.
Operating margin has increased, from 34.11% to 36.33%. Meanwhile, net income margin has increased from 23.42% to 28.98%.
Author’s Calculations Author’s Calculations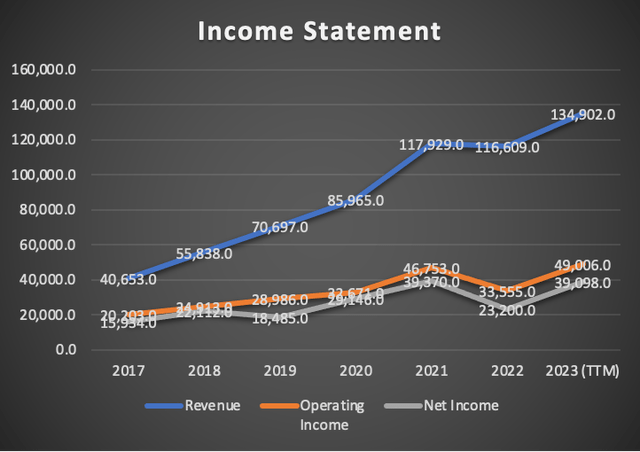
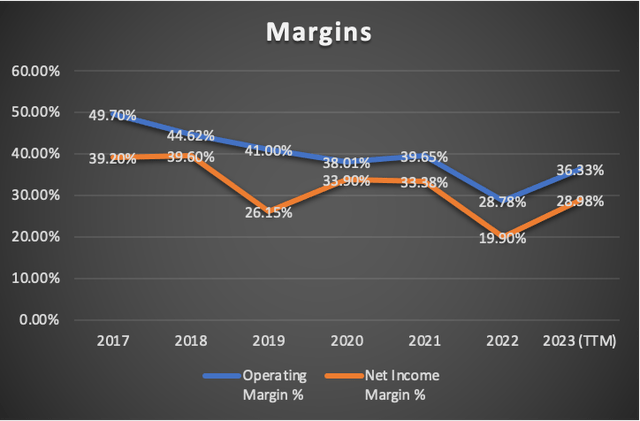
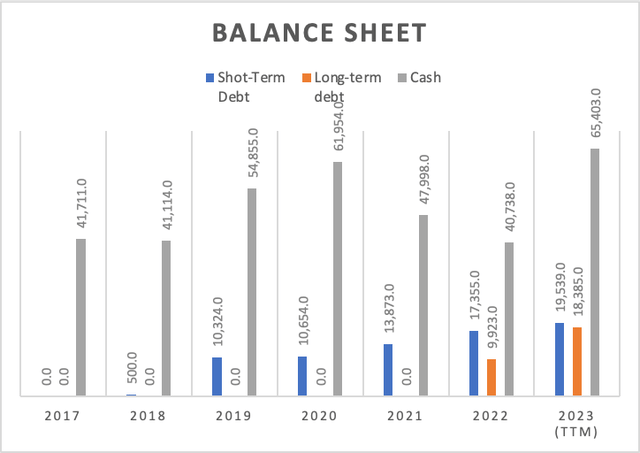
Cash reserves have increased from $61.1 billion to $65.4 billion. Long-term debt has stayed the same: $18.38 billion. However short-term debt increased slightly from $18.5 billion to $19.5 billion. Nevertheless, the balance sheet is in excellent condition.
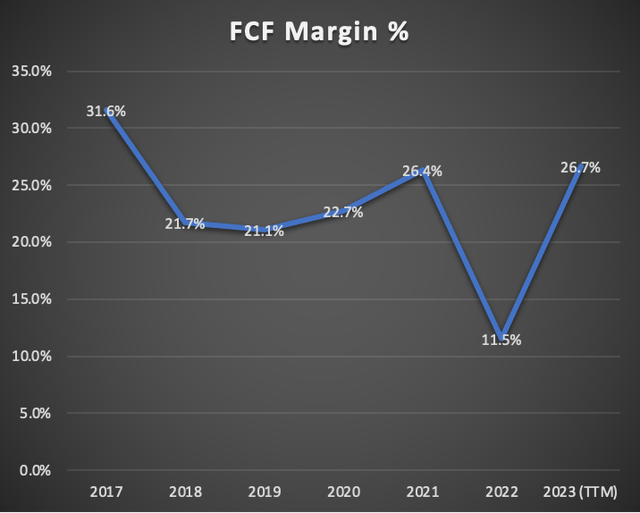
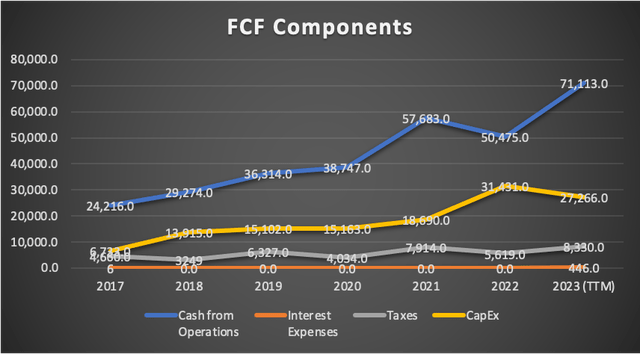
Free cash flow has displayed a huge improvement. In Q3 2023, It stranded at $27.3 billion and now it stands at $35.9 billion. This of course is reflected in the FCF margin, which was 21.5%, and now it stands at 26.7%. The main driver in FCF growth has been cash from operations, which increased from $66.2 billion to $71.1 billion.
Author’s Calculations Author’s Calculations Author’s Calculations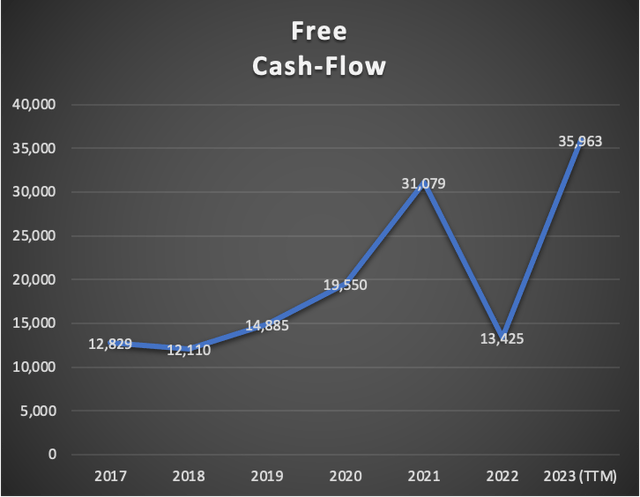
Valuation
In this valuation, I will perform two DCF models, the first one will be based on analysts’ estimates and the second one will be rooted in the current market trends for all the segments in which Meta operates.
The table below contains all the current information on Meta. CapEx, Interest and D&A will be projected using a margin tied to revenue. The WACC will be calculated with the already-known formula taking the variables from the table below.
| TABLE OF ASSUMPTIONS | |
| (Current data) | |
| Assumptions Part 1 | |
| Equity Value | 153,168.00 |
| Debt Value | 37,924.00 |
| Cost of Debt | 1.18% |
| Tax Rate | 17.56% |
| 10y Treasury | 4.16% |
| Beta | 1.3 |
| Market Return | 10.50% |
| Cost of Equity | 12.40% |
| Assumptions Part 2 | |
| CapEx | 27,266.00 |
| Capex Margin | 20.21% |
| Net Income | 39,098.00 |
| Interest | 446.00 |
| Tax | 8,330.00 |
| D&A | 11,178.00 |
| EBITDA | 59,052.00 |
| D&A Margin | 8.29% |
| Interest Expense Margin | 0.33% |
| Revenue | 134,902.0 |
Analysts’ Estimates
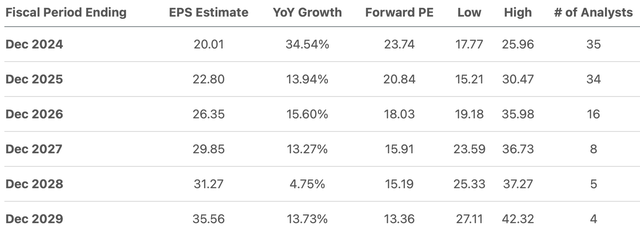
As previously said, this first model will be made from available analysts’ estimates. EPS is estimated to grow by 34.54% in 2024, this means that it’s expected that Meta’s cost cuts from last year will further increase its EPS.
For 2024, analysts are expecting an EPS of around $20.01, which is a net income of around $50.4 billion. For 2025, analysts are expecting an EPS of $22.80 which is a net income of around $58.13 billion.
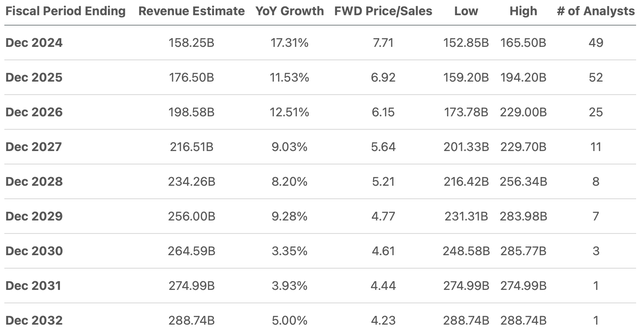
Revenue is expected to increase by 17.31% in 2024. For this year the expected revenue stands at $158.2 billion and for 2025, the expected revenue is $176.5 billion. As you can see the revenue is expected to fall in the low single digits after 2030.
For revenue and net income beyond 2025, I will use the forward revenue growth rate of 14.7% and the 3-5y long-term EPS growth rate of 19.76%. Both figures are available at Seeking Alpha.
| Revenue | Net Income | Plus Taxes | Plus D&A | Plus Interest | |
| 2024 | $158,210.0 | $50,426.09 | $59,282.66 | $72,391.96 | $72,915.02 |
| 2025 | $176,320.0 | $58,134.70 | $68,345.17 | $81,454.47 | $81,977.53 |
| 2026 | $202,239.0 | $69,622.12 | $81,850.17 | $98,607.73 | $99,276.35 |
| 2027 | $231,968.2 | $83,379.45 | $98,023.77 | $117,244.68 | $118,011.60 |
| 2028 | $266,067.5 | $99,855.23 | $117,393.26 | $139,439.66 | $140,319.30 |
| 2029 | $305,179.4 | $119,586.62 | $140,590.17 | $165,877.38 | $166,886.34 |
| ^Final EBITA^ |
As you can see, the fair price suggested by this model is $448.80 which is a 2.7% downside from the current stock price. The future price (in case the elements that compose equity continue to evolve at the same pace described in the financial section) is $760.30 which translates into annual returns of 10.8%.
Additionally, I made a model with the highest available estimates on Seeking Alpha and the fair price came out at $483.92 and the future price at $804.11. This means that Meta is 4.9% undervalued and that the stock can deliver annual returns of 12.4% throughout 2029.
Estimates based on Market Trends
For this second model, I will calculate Meta’s fair price and future price based on the current market trends. The first step is to make family of apps (which mainly consists of advertising) grow at a rate of 6.94%, and reality labs at a rate of 36.8%. The “other” category will grow at the rate displayed from 2022 to 2023, which is around 30.9%.
| Family of Apps | Other | Reality Labs | |
| 2023 | 131,948.00 | 1,058.00 | 1,896.00 |
| 2024 | 141,105.19 | 1,384.92 | 2,593.73 |
| 2025 | 150,897.89 | 1,812.86 | 3,548.22 |
| 2026 | 161,370.21 | 2,373.04 | 4,853.96 |
| 2027 | 172,569.30 | 3,106.31 | 6,640.22 |
| 2028 | 184,545.61 | 4,066.15 | 9,083.83 |
| 2029 | 197,353.07 | 5,322.60 | 12,426.67 |
For net income, I will use the net income margins derived from the previous models.
| Net Income Margins % | |
| 2024 | 31.87% |
| 2025 | 32.97% |
| 2026 | 34.43% |
| 2027 | 35.94% |
| 2028 | 37.53% |
| 2029 | 39.19% |
| Revenue | Net Income | Plus Taxes | Plus D&A | Plus Interest | |
| 2024 | $145,083.8 | $46,238.22 | $54,359.25 | $66,380.92 | $66,860.58 |
| 2025 | $156,259.0 | $51,518.58 | $60,567.03 | $72,588.70 | $73,068.36 |
| 2026 | $168,597.2 | $58,048.02 | $68,243.26 | $82,213.25 | $82,770.65 |
| 2027 | $182,315.8 | $65,524.31 | $77,032.65 | $92,139.36 | $92,742.12 |
| 2028 | $197,695.6 | $74,195.15 | $87,226.39 | $103,607.48 | $104,261.08 |
| 2029 | $215,102.3 | $84,298.61 | $99,104.36 | $116,927.78 | $117,638.93 |
| ^Final EBITA^ |
Finally, the result yielded by this model is a huge downside of 28.9%, suggesting that the fair price is $328.05. The future stock price stands at $548.52 which implies annual returns of 3.2%.
Now, what does Meta need in order to achieve a 28% upside? It needs to grow its advertising business by 18% annually (something possible when observing FY 2023 results) and its “reality labs” segment by 75% annually. This would mean that the EPS for 2024 needs to be $19.96 and for 2025 $24.63, and for 2026 $30.83, all within the range of estimates, nevertheless, the gap widens beyond that period. In the table below, you can see the complete results.
| Revenue | Net Income | EPS | Plus Taxes | Plus D&A | Plus Interest | |
| 2024 | $160,401.6 | $51,119.98 | 19.96 | $60,098.42 | $73,389.31 | $73,919.62 |
| 2025 | $191,343.8 | $63,086.04 | 24.63 | $74,166.13 | $87,457.03 | $87,987.33 |
| 2026 | $229,329.2 | $78,958.04 | 30.83 | $92,825.81 | $111,828.06 | $112,586.25 |
| 2027 | $276,706.6 | $99,448.34 | 38.83 | $116,914.91 | $139,842.86 | $140,757.68 |
| 2028 | $337,050.4 | $126,495.02 | 49.39 | $148,711.93 | $176,639.98 | $177,754.31 |
| 2029 | $415,982.0 | $163,023.34 | 63.66 | $191,655.89 | $226,124.22 | $227,499.50 |
| ^Final EBITA^ |
Why I missed to predict the 55% rally on Meta’s stock
Meta beat Q3 2023 earnings, and because of that the stock price continued its rally and rose by an additional 36.91%. Then, in Q4 2023 Meta delivered stellar earnings and declared dividend payments, which increased the stock price further by around 15.8%.
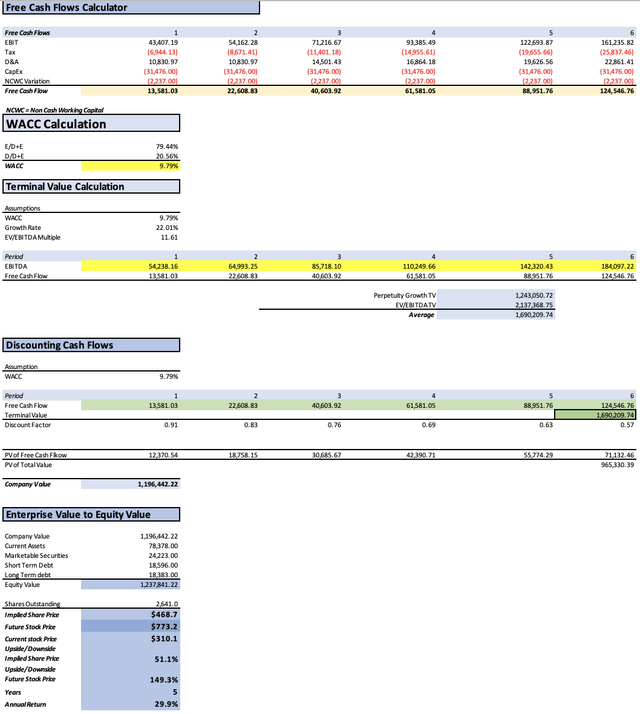
In my previous article, the available analysts’ estimates implied a fair price of $336.8. However my third (and last) model in that article, labeled “the most optimistic scenario”, suggested a fair price of $468.70, in other words, a 51.1% upside, close to the 55% displayed by Meta since my first article. Nevertheless, my skepticism made me disregard this model in favor of the others which in my opinion were more “credible”.
The reason can be resumed as: I didn’t believe Meta could achieve the high estimates of the third model in my previous article. You can see that model below.
Risks to Thesis
The main risk to this thesis is that Meta continues to beat on earnings and revenue. This is of course difficult for a company to do, for an extended period of time and by a wide margin, because at some point estimates will be too optimistic and the company will miss.
The second risk is that Meta achieves the growth rates necessary to make it undervalued which as previously said, Advertisement would need to grow at a 20% rate and the reality labs at 75%, these are very high growth rates that widely surpass that one of the markets in which Meta operates.
I predict the fair price to stay mostly stable throughout the year. Nevertheless, when next year is approaching, a decent adjustment will always come because I will need to take out the past year and add the coming year to the projection, which increases the overall amount of cash flows in the model, therefore increasing the fair price of the stock.
Conclusion
In conclusion, while Meta has delivered a substantial upside since Q3 2023 earnings, according to my models, the potential for a continued rally seems to have diminished. The fair price implied by the average estimates is $448.80 and the future price is $760.30. Taking into account the highest estimates available, Meta’s upside will only be around 4.9%. Furthermore, in order to make Meta hugely undervalued, the reality lab business would need to grow at a sustained 75% and advertisements at 18% annually.
These results have led me to the conclusion of reiterating my hold rating on Meta due to the limited upside and the fact that it has never been advisable to buy a stock based on how it can surprise investors.
Analyst’s Disclosure: I/we have no stock, option or similar derivative position in any of the companies mentioned, but may initiate a beneficial Long position through a purchase of the stock, or the purchase of call options or similar derivatives in META over the next 72 hours. I wrote this article myself, and it expresses my own opinions. I am not receiving compensation for it (other than from Seeking Alpha). I have no business relationship with any company whose stock is mentioned in this article.
Seeking Alpha’s Disclosure: Past performance is no guarantee of future results. No recommendation or advice is being given as to whether any investment is suitable for a particular investor. Any views or opinions expressed above may not reflect those of Seeking Alpha as a whole. Seeking Alpha is not a licensed securities dealer, broker or US investment adviser or investment bank. Our analysts are third party authors that include both professional investors and individual investors who may not be licensed or certified by any institute or regulatory body.

