Summary:
- Meta Platforms has shown phenomenal growth and its business model of connecting people and businesses is still strong.
- Facebook continues to grow, especially in the Asia-Pacific and Rest of the World regions.
- Despite challenges like Apple’s ATT policy, Meta remains profitable and has reined in its costs and expenses. However, the share price is overvalued by 89%.
Leon Neal
Meta Platforms (NASDAQ:META) has shown itself to be one of the great businesses. It is a growth giant whose revenue has compounded by nearly 35% since 2010, the business model remains phenomenally strong despite the usual doubts, the much-derided Facebook keeps growing, digital advertising remains a vital part of the global economy, its expenses have been brought to heel, and profitability has roared back to life. Despite external and internal shocks, results over the last year have shown just how strong the business is. It is arguable that Apple’s attApp Tracking Transparency (ATT) policy has been a plus for Meta in the long run, entrenching its dominance in digital advertising. There are concerns, however, about Mark Zuckerberg’s commitment to capital allocation, and, as our analysis will show, the share price is 89% more than its intrinsic value, suggesting that the market’s usual manic-depressive attitude towards Meta has led to wild overvaluation.
The Business Model is Still Phenomenal
Few businesses have been able to grow as fast as Meta has, for as long as Meta has, and at the scale Meta has. Since it went public, Meta’s revenue has compounded at 34.64%, compared to 3.92% for the world’s collective gross domestic product (GDP).
Source: Meta Platforms Filings and Author Calculations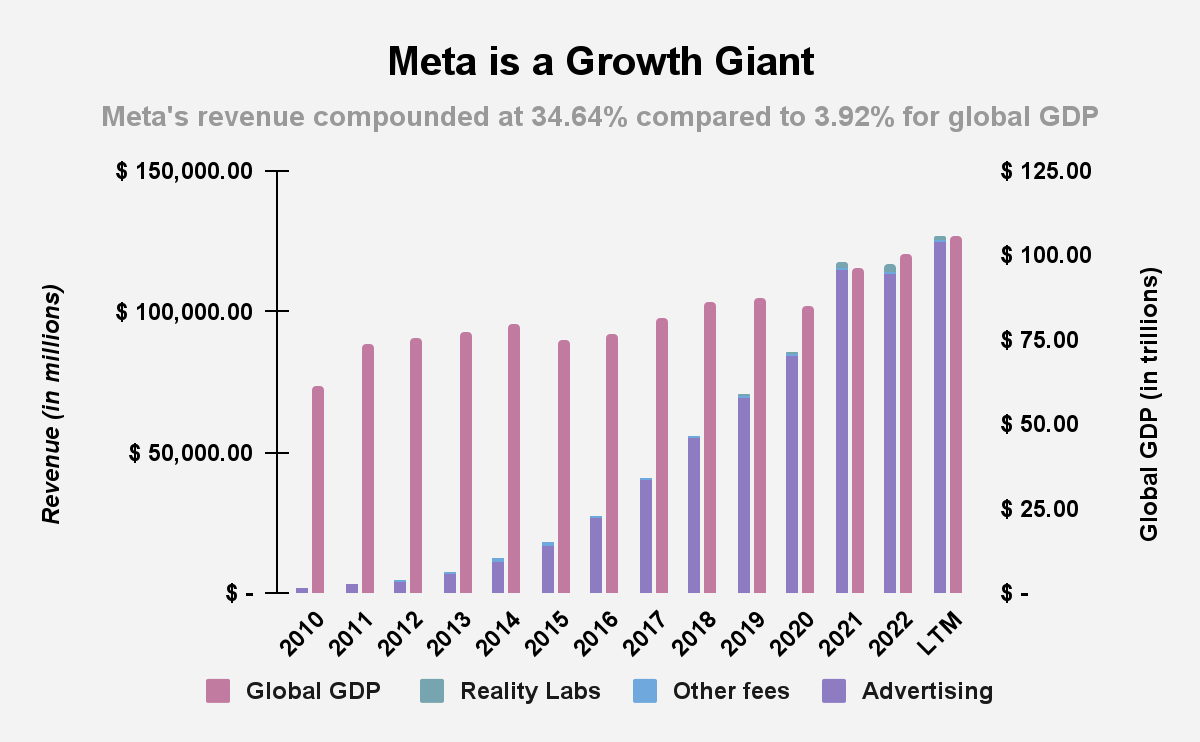
At the heart of this growth is Meta’s ability to connect people to other people, and to connect people and businesses from anyone looking to find the nearest coffee shop to those seeking Cancun Airport Transportation. Connection is a vital human activity and will always be so. As the number of users grows, so too does the value of the network, as investors in platform companies have by now understood. So, even if growth may slow down, absolute growth will continue until something seismic happens in the way that people communicate. Until then, outside of China and North Korea, there is a cost for businesses who are not on Facebook, Instagram, or WhatsApp, and outside of China and North Korea, there is a cost to not being on Facebook, Instagram, or WhatsApp. The bigger the platforms, the greater the pull, the greater the costs of exclusion. This is what explains the business’ phenomenal growth.
If platforms are to be valued by how strong their network effects are, and if, as more users are added to networks, the value of those networks, and therefore, of the platforms, grows, then, it stands to reason that Meta’s network effects have never been stronger. Moreover, as the business with the largest platforms on the planet, competition hurts Meta less than it hurts its rivals. Without fundamental change in the way people connect, that will remain so. Merely starting a new platform, even one as good as ByteDance’s TikTok, isn’t enough to be an existential threat to Meta.
Facebook Keeps Growing
Facebook is bedeviled by many prejudices: analysts often think of it as a dying platform populated by old people and bleeding users to fresher platforms, and yet, the data shows that Facebook continues to grow. What is true is that, given its scale, Facebook is no longer growing at high relative rates, but in terms of absolute numbers, its growth is still massive. Consider that in the third quarter, Facebook added 19 million daily active users (DAU), which is nearly a tenth of Twitter’s daily users. These analysts have been too Western-focused in their analyses. Yes, Europe has been flat since the beginning of the year, and growth in the United States and Canada has been tepid, but, in the Asia-Pacific and the Rest of the World, Facebook continues to grow, because there is simply no room to grow in the United States, Canada and Europe.
Source: Meta Platforms Filings and Author Calculations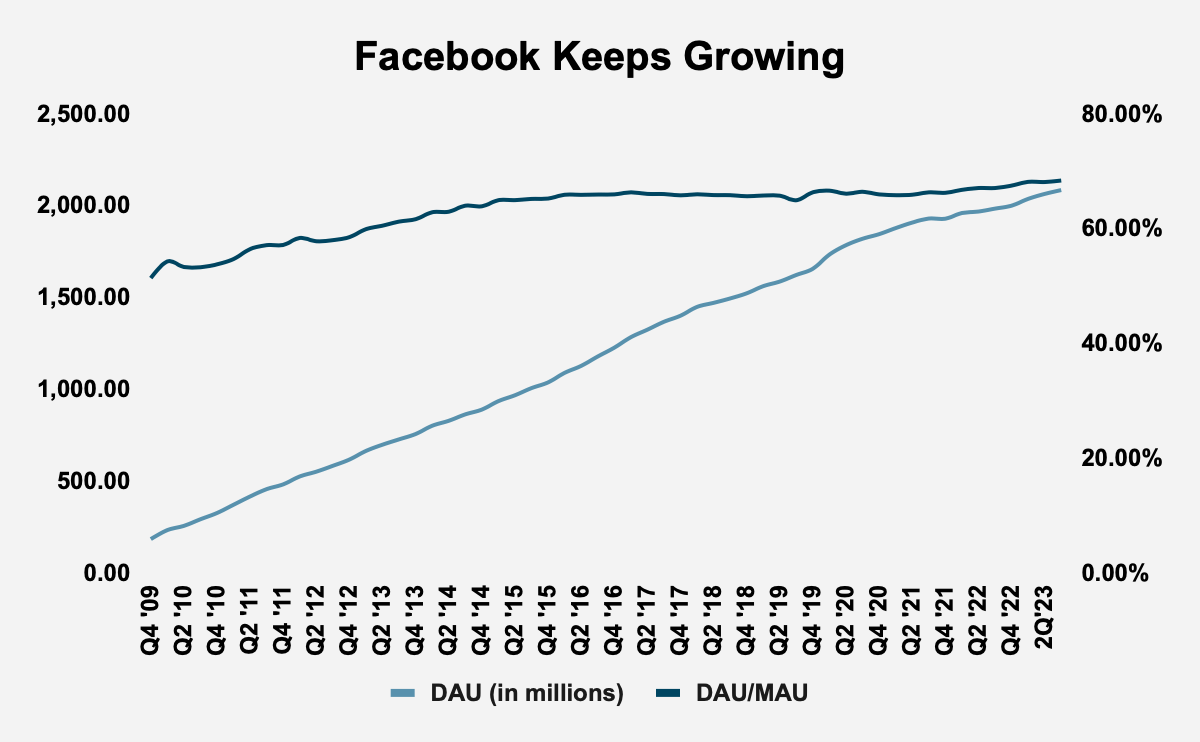
Advertising Still Matters
Meta was severely impacted by Apple’s decision to launch ATT. There were many existential warnings given about the business, with many analysts believing Meta could not recover and had entered an era of permanent decline. This was absurd, for a very simple reason. Yes, ATT meant that Meta could not provide the granular information about its users that had for so long made it an attractive place to place ads, given the certainty advertisers had about the returns they would earn. Meta wasn’t the only firm affected by ATT, with Eric Seufert referring to the App Tracking Transparency Recession. However, firms still need to deploy digital ads, and Meta remains, along with Google, the biggest market for ads in the world. If digital ads die, these two companies will sell the very last digital ads. Their reach is global, touching virtually everyone in the world outside of China and North Korea, and many businesses have been built on top of the Meta platform, businesses that had nowhere else to go. So, even though advertisers face more uncertain returns, that is true of every single platform offering space for digital ads. What Meta has is enormous scale across its social media platforms. So, an advertiser may refrain from putting ads in, say, Twitter, Meta is non-negotiable, they have to put ads on a Meta platform.
Profitability is on the Way Up
John Malone once said that then-Facebook was the “best business model that’s ever been created”. It has the characteristics of a legacy media company, providing content to its billions of users, while earning advertising revenue from the many businesses who want to reach Meta’s users. It should also be pointed out that Zuckerberg was very prescient in his letter of intent in 2012 in highlighting the fact that many small businesses would be built on top of the Facebook platform, businesses that would not be able to exist without it. What made Malone so impressed by the business is that all this content is gifted to Meta. This obviously leads to a business that is built for massive profitability. In its entire history, Meta has earned an average gross profit margin of 80.78%, and since 2013, the firm has earned an average net operating profit after tax (NOPAT) margin of 29.09%. The company’s returns on invested capital (ROIC) have historically always been elite-level, with an average ROIC of nearly 29% from 2011 to the LTM. Between 2022 and the LTM, ROIC has risen modestly, from over 25% to nearly 26%.
Source: Meta Platforms Filings and Author Calculations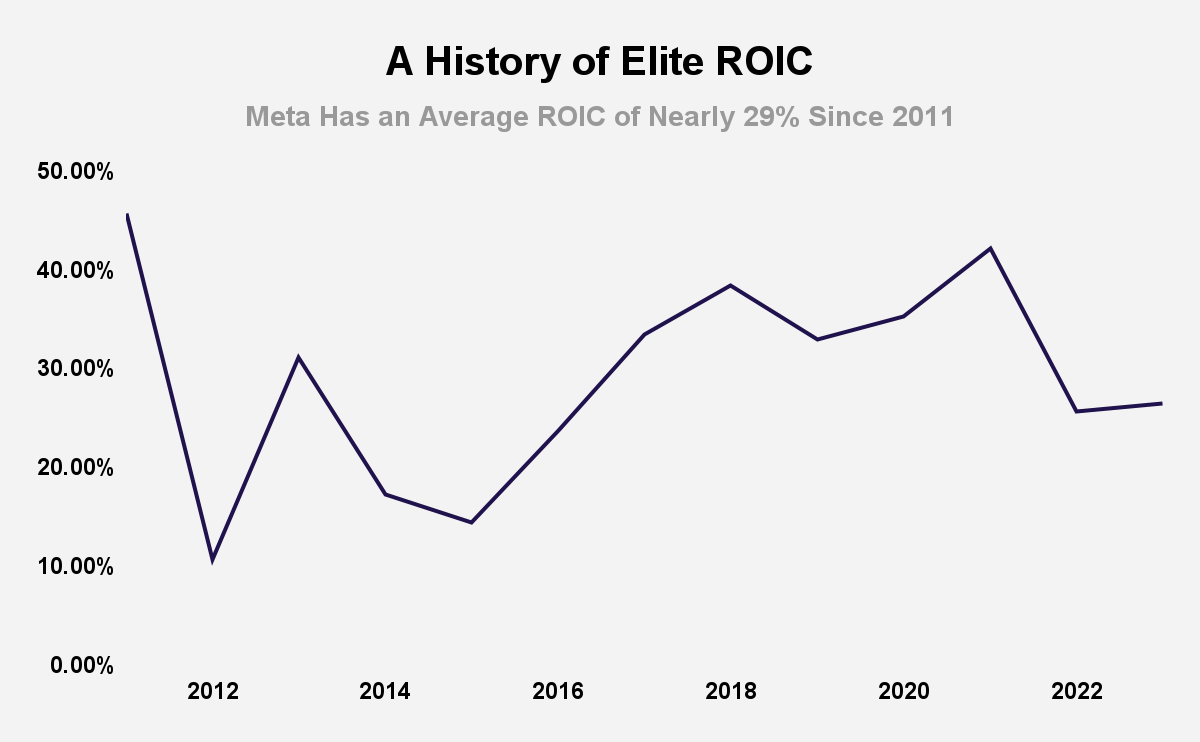
Meta’s profitability took an enormous hit when Mark Zuckerberg took the decision in 2021 to pivot to the metaverse, and as a result of the impact of Apple’s (AAPL) App Tracking Transparency initiative. In response, the share price tanked, and a doomsday narrative unfolded, as often happens with Meta. That narrative undersold just how strong the business model is, and the benefits that come with being founder-led, namely, an ability to be aggressive and flexible in ways that Meta’s non-founder-led peers, such as Alphabet (GOOGL), and Apple cannot. Zuckerberg initiated a series of reforms to improve the business, including restructuring initiatives. Those initiatives have paid off.
If we strip away non-recurring and non-core components of Meta’s GAAP earnings, such as the $6.5 billion in restructuring costs that the company has absorbed over the last twelve months (LTM), we see a business that has strongly rebounded from the relative nadir of 2022, with Meta enjoying its second highest core earnings in its history.
|
Reconciliation of GAAP Net Income to NOPAT |
|||||||||||||
|
Economic Category (Values in millions except per share amounts) |
2011 |
2012 |
2013 |
2014 |
2015 |
2016 |
2017 |
2018 |
2019 |
2020 |
2021 |
2022 |
LTM |
|
GAAP Net Income |
$ 668.00 |
$ 32.00 |
$ 1,491.00 |
$ 2,925.00 |
$ 3,669.00 |
$ 10,188.00 |
$ 15,920.00 |
$ 22,111.00 |
$ 18,485.00 |
$ 29,146.00 |
$ 39,370.00 |
$ 23,200.00 |
$ 29,732.00 |
|
Total Hidden Non-Operating Expense, Net |
$ 4.00 |
$ 23.00 |
$ 173.00 |
$ (9.00) |
$ 69.00 |
$ 66.00 |
$ – |
$ – |
$ 5,000.00 |
$ – |
$ – |
$ 5,336.00 |
$ 6,501.00 |
|
Reported Non-Operating Expense, Net |
$ 61.00 |
$ 44.00 |
$ 50.00 |
$ 84.00 |
$ 31.00 |
$ (91.00) |
$ (391.00) |
$ (448.00) |
$ (826.00) |
$ (509.00) |
$ (531.00) |
$ 125.00 |
$ (3.00) |
|
Reported Derivative Related Expenses, Net |
$ – |
$ – |
$ – |
$ – |
$ – |
$ – |
$ – |
$ – |
$ – |
$ – |
$ – |
$ – |
$ – |
|
Reported Other Financing Expenses, Net |
$ – |
$ – |
$ – |
$ – |
$ – |
$ – |
$ – |
$ – |
$ – |
$ – |
$ – |
$ – |
$ – |
|
Reported Company Defined Other Non-Operating Expenses, Net |
$ 19.00 |
$ (7.00) |
$ (6.00) |
$ 88.00 |
$ 60.00 |
$ 75.00 |
$ 1.00 |
$ 204.00 |
$ 78.00 |
$ 163.00 |
$ (70.00) |
$ 401.00 |
$ – |
|
Reported Acquisition and Merger Expenses, Net |
$ – |
$ – |
$ – |
$ – |
$ – |
$ – |
$ – |
$ – |
$ – |
$ – |
$ – |
$ – |
$ – |
|
Reported Legal, Regulatory, and Insurance Related Expenses, Net |
$ – |
$ – |
$ – |
$ – |
$ – |
$ – |
$ – |
$ – |
$ – |
$ – |
$ – |
$ – |
$ – |
|
Reported Interest Expense/(Income), Net |
$ 42.00 |
$ 51.00 |
$ 56.00 |
$ (4.00) |
$ (29.00) |
$ (166.00) |
$ (392.00) |
$ (652.00) |
$ (904.00) |
$ (672.00) |
$ (461.00) |
$ (276.00) |
$ (3.00) |
|
Reported Expenses/(Income) from Discontinued Operations, Net |
$ – |
$ – |
$ – |
$ – |
$ – |
$ – |
$ – |
$ – |
$ – |
$ – |
$ – |
$ – |
$ – |
|
Reported Losses/(Income) from Unconsolidated Subsidiaries, Net |
$ – |
$ – |
$ – |
$ – |
$ – |
$ – |
$ – |
$ – |
$ – |
$ – |
$ – |
$ – |
$ – |
|
Reported Foreign Currency Expenses, Net |
$ – |
$ – |
$ – |
$ – |
$ – |
$ – |
$ – |
$ – |
$ – |
$ – |
$ – |
$ – |
$ – |
|
Reported Non-Operating Other Real Estate Owned Expense/(Income), Net |
$ – |
$ – |
$ – |
$ – |
$ – |
$ – |
$ – |
$ – |
$ – |
$ – |
$ – |
$ – |
$ – |
|
Reported Other Non-Operating Expense/(Income), Net |
$ – |
$ – |
$ – |
$ – |
$ – |
$ – |
$ – |
$ – |
|||||
|
Reported Write-Downs (Non-Operating), Net |
$ – |
$ – |
$ – |
$ – |
$ – |
$ – |
$ – |
$ – |
$ – |
$ – |
$ – |
$ – |
$ – |
|
Reported Restructuring Expenses, Net |
$ – |
$ – |
$ – |
$ – |
$ – |
$ – |
$ – |
$ – |
$ – |
$ – |
$ – |
$ – |
$ – |
|
Reported Other Non-Recurring Expense/(Income), Net |
$ – |
$ – |
$ – |
$ – |
$ – |
$ – |
$ – |
$ – |
$ – |
$ – |
$ – |
$ – |
$ – |
|
Total Derived Data for the Net Income to NOPAT Reconciliation |
$ 61.17 |
$ 127.49 |
$ 190.06 |
$ (70.73) |
$ 186.96 |
$ (2,154.74) |
$ (2,251.38) |
$ (1,478.47) |
$ (897.72) |
$ (1,115.70) |
$ 1,285.56 |
$ 1,160.12 |
$ 969.39 |
|
Change in Total Reserves |
$ – |
$ – |
$ – |
$ – |
$ – |
$ – |
$ – |
$ – |
$ – |
$ – |
$ – |
$ – |
$ – |
|
Goodwill Amortization Expense, Net |
$ – |
$ – |
$ – |
$ – |
$ – |
$ – |
$ – |
$ – |
$ – |
$ – |
$ – |
$ – |
$ – |
|
ESO Expense (Employee Stock Options) |
$ – |
$ – |
$ – |
$ – |
$ – |
$ – |
$ – |
$ – |
$ – |
$ – |
$ – |
$ – |
$ – |
|
Interest for PV of Operating Leases |
$ 37.83 |
$ 33.96 |
$ 41.39 |
$ 46.14 |
$ 61.83 |
$ 80.26 |
$ 173.73 |
$ 504.26 |
$ 483.14 |
$ 452.52 |
$ 586.04 |
$ 710.47 |
$ 655.31 |
|
Classification Disclosure Adjustment |
$ – |
$ – |
$ – |
$ – |
$ – |
$ – |
$ – |
$ – |
$ – |
$ – |
$ – |
$ – |
$ – |
|
Non-Operating Tax Adjustment |
$ 23.34 |
$ 93.53 |
$ 148.66 |
$ (116.87) |
$ 125.14 |
$ (2,235.00) |
$ (2,425.11) |
$ (1,982.73) |
$ (1,380.86) |
$ (1,568.22) |
$ 699.52 |
$ 449.65 |
$ 314.08 |
|
Reported After-Tax Non-Operating Expense/(Income), Net |
$ 332.00 |
$ 21.00 |
$ 9.00 |
$ 15.00 |
$ 19.00 |
$ 29.00 |
$ 14.00 |
$ 1.00 |
$ – |
$ – |
$ – |
$ – |
$ – |
|
Reported Minority Interest Expense, Net |
$ – |
$ – |
$ – |
$ – |
$ – |
$ – |
$ – |
$ – |
$ – |
$ – |
$ – |
$ – |
$ – |
|
Reported Loss/(Gain) from Discontinued Operations After-Tax, Net |
$ – |
$ – |
$ – |
$ – |
$ – |
$ – |
$ – |
$ – |
$ – |
$ – |
$ – |
$ – |
$ – |
|
Reported Preferred Dividends, Net |
$ 332.00 |
$ 21.00 |
$ 9.00 |
$ 15.00 |
$ 19.00 |
$ 29.00 |
$ 14.00 |
$ 1.00 |
$ – |
$ – |
$ – |
$ – |
$ – |
|
Reported Dividends on Redeemable Preferred Stock, Net |
$ – |
$ – |
$ – |
$ – |
$ – |
$ – |
$ – |
$ – |
$ – |
$ – |
$ – |
$ – |
$ – |
|
Reported Other After-Tax Charges, Net |
$ – |
$ – |
$ – |
$ – |
$ – |
$ – |
$ – |
$ – |
$ – |
$ – |
$ – |
$ – |
$ – |
|
Net Operating Profit After Tax (NOPAT) |
$ 1,126.17 |
$ 247.49 |
$ 1,913.06 |
$ 2,944.27 |
$ 3,974.96 |
$ 8,037.26 |
$ 13,291.62 |
$ 20,185.53 |
$ 21,761.28 |
$ 27,521.30 |
$ 40,124.56 |
$ 29,821.12 |
$ 37,199.39 |
Source: Meta Platforms Filings and Author Calculations
The implication for such incredible profitability is that Meta has far more space to make mistakes, and to pursue speculative bets such as the metaverse, hiring new people, and investing in R&D, without that leading to anything near a loss. Meta literally has money to burn. Even when the company’s costs and expenses grew by nearly 34% in 2021 and over 23% in 2022, the firm was still able to remain profitable. The profits can be reinvested into data centers, acquisitions, and other things. Even so, the company continues to grow its cash war chest, which is $28.78 billion. The company’s free cash flow (FCF) has risen from -2 billion in 2012 to more than $28 billion in the LTM, after suffering a collapse in 2022, thanks to the firm’s restructuring efforts.
Source: Meta Platforms Filings and Author Calculations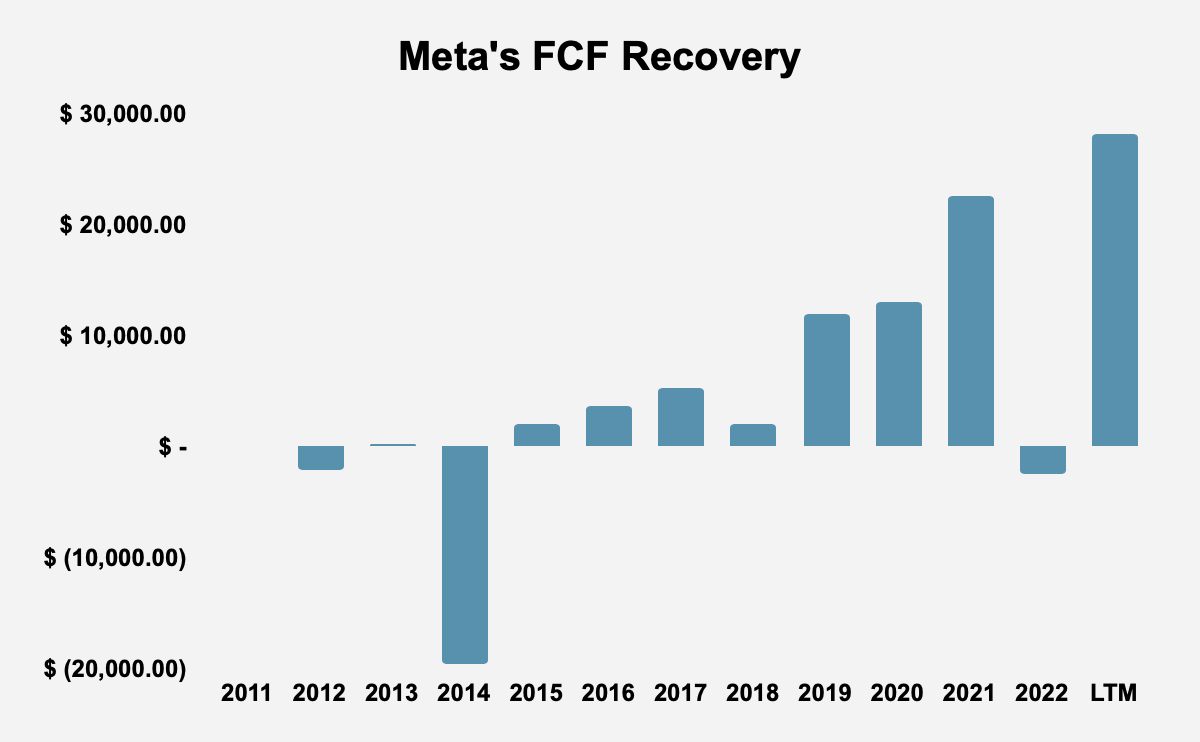
Meta Has Reined in Its Costs and Expenses
One of the biggest reasons that Meta’s share price tanked in the wake of the push toward the metaverse, is that the company’s costs and expenses seemed to spiral out of control, eating into profits. While costs and expenses grew, revenue declined, and in 2022, NOPAT declined for the first time since 2012. In the LTM, costs and expenses rose by just 2.88%.
Source: Meta Platforms Filings and Author Calculations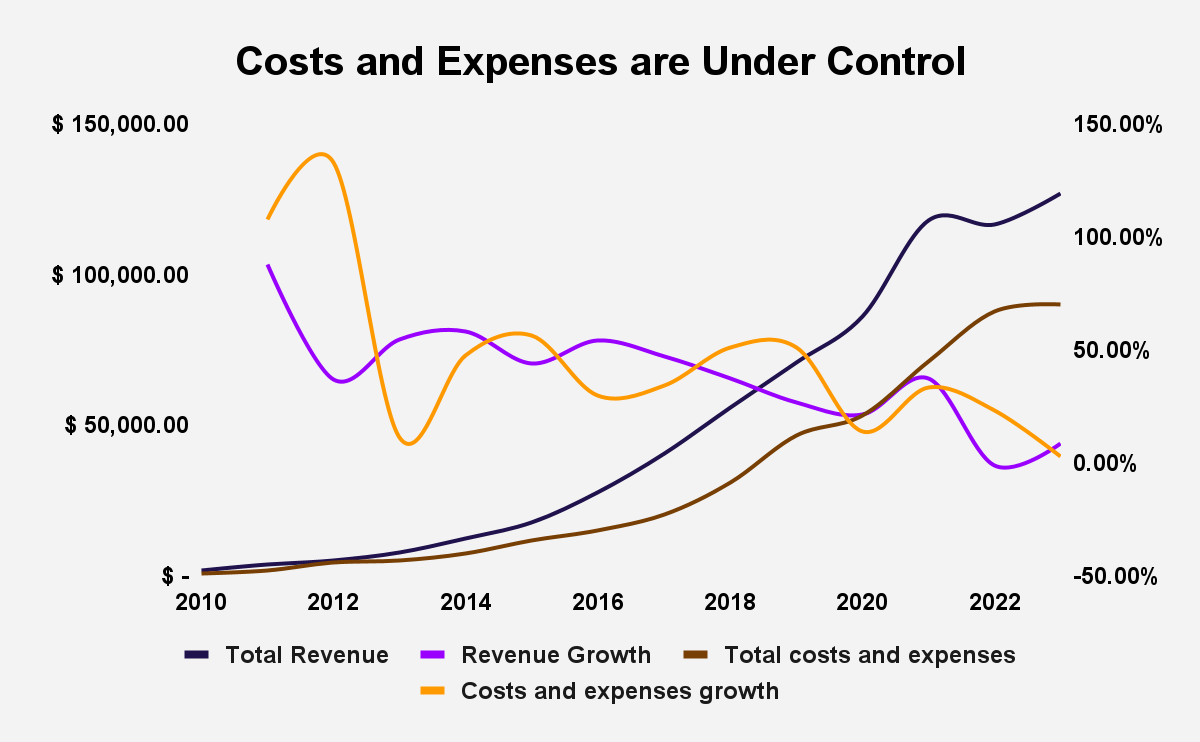
Capital Allocation Isn’t at the Heart of the Business
Zuckerberg opens his letter of intent with the extraordinary statement:
Facebook was not originally created to be a company. It was built to accomplish a social mission – to make the world more open and connected.”
That sentiment has been echoed in his 2017, and 2021 letters.
Today, it is the fashion for tech entrepreneurs to proclaim that they are pursuing some great mission for human civilization, but, this is an early theme that I think has to be treated seriously, and which is important in understanding how Zuckerberg sees his body of work. Businesses have become more purposeful over the last few decades, and certainly, purpose is an important determiner of profitability and provides a number of benefits such as creating strategic clarity. That said, by rejecting a commercial basis for his decision-making, Zuckerberg also rejects capital allocation as a guiding principle. In good times, investors have often ignored this, but the issue did come to light when Meta’s share price tanked in the wake of the metaverse investments. Investing in Meta means accepting that Zuckerberg is primarily concerned with its social mission, the services it is building, and the people who use it.
In an age of cynicism, it is easy to pass over that statement without comment. Nevertheless, that characterisation of how he saw the business should be taken on good faith. This may seem naive, but, even if he was a liar, those personal lies have built the company culture and certainly the people who work for him believe the message he has communicated. In that sense, it is irrelevant if he was talking tongue-in-cheek or with his heart on his sleeve. A principle to remember is that even if a leader is a sophisticated liar, it is virtually impossible to build an entire organization of sophisticated liars, so the words that that leader says are a reflection of the culture of the organization. Of course, the sense of purpose in an organization rises as one goes up the corporate ladder, so one should not imagine that everyone is as idealistic as the boss. Nevertheless, I think Zuckerberg was honest in his reflection on Facebook’s focus, that this has shaped the company’s culture, and that his philosophy and sense of history is an important link to the reason why he decided to shift the company’s focus to the metaverse, and why he decided to launch Threads. Zuckerberg is guided by a desire to build things. This creates some tension with the goals of his fellow shareholders who want a return on their investment. The economic engine exists to serve this desire, to make shareholders rich. In his own words, the greatest compliment that could ever be made of him, would be how he described the work of great business leaders, who have built “a strong company with a strong economic engine and strong growth”, aligning an army of people to solve vital problems. This meta-corporate vision of his role and Facebook’s mission, has always been clear: “we don’t build services to make money; we make money to build better services”.
Add that with the fact that he has been careful to maintain control of the company through his voting rights, and this stands as a warning to investors: investing in Meta means investing in a business in which you have no power, and where the primary goal is not your enrichment. it may work out, but you can’t complain when things go bad.
The AI Opportunity
Disruptive innovation isn’t just about market entrants introducing novel value propositions, value propositions which, in the near-term at least:
…underperform established products in mainstream markets. But they have other features that a few fringe (and generally new) customers value. Products based on disruptive technologies are typically cheaper, simpler, smaller, and, frequently, more convenient to use.”
Clayton Christensen, The Innovator’s Dilemma
Disruptive technologies can be brought to the fore by incumbents. Consider cloud computing, which is dominated, not by startups, but by incumbent tech giants such as Alphabet, Amazon (AMZN) and Microsoft (MSFT). Given the enormous investments needed in AI, it does not seem likely that a startup will dominate the space. Indeed, OpenAI works in partnership with Microsoft. The investments needed are simply too large for any but the existing tech giants to succeed.
Dave Wehner, Meta’s chief financial officer, said on the Q3 earnings call last year:
…we are significantly expanding our AI capacity. These investments are driving substantially all of our capital expenditure growth in 2023. There is some increased capital intensity that comes with moving more of our infrastructure to AI. It requires more expensive servers and networking equipment, and we are building new data centers specifically equipped to support next generation AI-hardware. We expect these investments to provide us a technology advantage and unlock meaningful improvements across many of our key initiatives, including Feed, Reels and ads. We are carefully evaluating the return we achieve from these investments, which will inform the scale of our AI investment beyond 2023.
These investments serve to increase Meta’s competitive advantage over rival social media platforms who, hurt by Apple’s ATT policy, do not have the resources to make similar investments to improve the statistical models driving ad targeting, and content recommendation, and to increase Reels growth. Much the way that regulation has the side-effect of entrenching incumbents, Apple’s policy has had the effect of entrenching Meta’s position, because only Meta and Alphabet have the capacity to make the investments necessary to survive in digital advertising. Indeed, this is at the heart of its success in the wake of ATT. While the investments are large, the maintenance capex should be manageable, and investors can bet on rising ROIC. Better ad targeting and better content recommendation will make advertisers even less likely to go outside the Meta-Alphabet digital advertising duopoly.
Valuation
To understand if Meta’s value is reasonable, we can use the convergence formula to figure out what the business would be worth if any growth did not add to shareholder value. We can call this the zero-growth value of the business. The analysis below shows that, because of the renewed attention to the strength of the business and its return to strong profitability and growth, investors have overreacted to Meta’s recent run of good results, and valued the firm at 89% of its zero-growth value. Quite simply, the share price is indefensible and there is no margin of safety. Investors should not invest in the business.
|
Zero-Growth Value |
2018 |
2019 |
2020 |
2021 |
2022 |
LTM |
|
NOPAT |
$ 20,185.53 |
$ 21,761.28 |
$ 27,521.30 |
$ 40,124.56 |
$ 29,821.12 |
$ 37,475.97 |
|
WACC |
7.43% |
6.64% |
5.21% |
5.77% |
7.39% |
8.39% |
|
Excess cash |
$ 39,997.24 |
$ 53,441.06 |
$ 60,234.70 |
$ 45,639.42 |
$ 38,405.82 |
$ 50,906.90 |
|
Net Assets from Discontinued Operations |
$ – |
$ – |
$ – |
$ – |
$ – |
$ – |
|
Net Deferred Tax Liability |
$ – |
$ – |
$ – |
$ – |
$ – |
$ – |
|
Net Deferred Compensation Assets |
$ – |
$ – |
$ – |
$ – |
$ – |
$ – |
|
Fair Value of Unconsolidated Subsidiary Assets (non-op) |
$ – |
$ – |
$ – |
$ – |
$ – |
$ – |
|
Fair Value of Total Debt |
$ 1,621.17 |
$ 3,701.76 |
$ 10,974.25 |
$ 10,711.74 |
$ 9,923.00 |
$ 18,380.00 |
|
Fair Value of Preferred Capital |
$ – |
$ – |
$ – |
$ – |
$ – |
$ – |
|
Fair Value of Minority Interests |
$ – |
$ – |
$ – |
$ – |
$ – |
$ – |
|
Value of Outstanding ESO After-Tax |
$ – |
$ – |
$ – |
$ – |
$ – |
$ – |
|
Pensions Net Funded Status |
$ – |
$ – |
$ – |
$ – |
$ – |
$ – |
|
Zero-Growth Book Value |
$ 310,052.09 |
$ 377,469.43 |
$ 577,500.46 |
$ 730,327.29 |
$ 432,016.18 |
$ 479,201.13 |
|
Outstanding Shares |
2,890 |
2,854 |
2,851 |
2,815 |
2,687 |
2756 |
|
Zero-Growth Book Value per Share |
$ 107.28 |
$ 132.26 |
$ 202.56 |
$ 259.44 |
$ 160.78 |
$ 173.88 |
Source: Meta Platforms Filings and Author Calculations
Conclusion
Meta Platforms is one of history’s great businesses. Despite suffering an external shock in the form of Apple’s ATT policy, and making a bad turn toward the metaverse, its initiatives since then have highlighted the strength of the business. Nevertheless, Meta is vastly overpriced, with a share price that is 89% greater than the value of the business under a pessimistic scenario where growth does not add to shareholder value. Investors cannot invest in the hope that growth will add value, and with the gulf between the share price and zero-growth value of the business so great, investors in Meta today would be investing in hope.
Analyst’s Disclosure: I/we have no stock, option or similar derivative position in any of the companies mentioned, and no plans to initiate any such positions within the next 72 hours. I wrote this article myself, and it expresses my own opinions. I am not receiving compensation for it (other than from Seeking Alpha). I have no business relationship with any company whose stock is mentioned in this article.
Seeking Alpha’s Disclosure: Past performance is no guarantee of future results. No recommendation or advice is being given as to whether any investment is suitable for a particular investor. Any views or opinions expressed above may not reflect those of Seeking Alpha as a whole. Seeking Alpha is not a licensed securities dealer, broker or US investment adviser or investment bank. Our analysts are third party authors that include both professional investors and individual investors who may not be licensed or certified by any institute or regulatory body.
