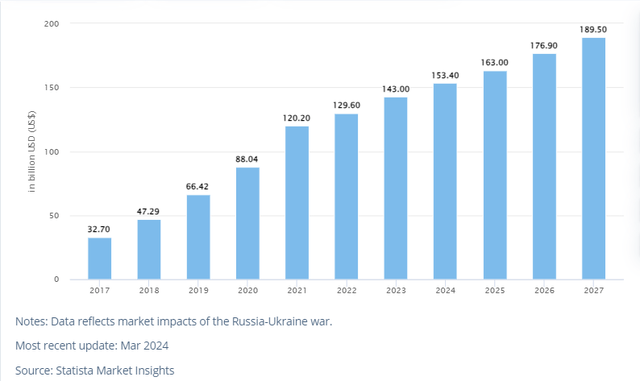
Summary:
- Since my previous coverage, the stock has gained about 1.75%, underperforming the S&P 500 by about 3%. In this updated article, I am empirically estimating the price target for 2027.
- Technical analysis shows strong upward momentum with no signs of reversal, supported by bullish crossovers and increasing on-balance volume.
- Regression analysis estimates a price target of $935 by 2027, indicating an 86.2% growth potential; the company’s growth levers include growing user base and innovative products.
Robert Way
Investment Thesis
Since my previous bullish thesis dated March 5th, 2024, on Meta Platforms Inc. (NASDAQ:META) the stock has gained about 1.75%, slightly underperforming the S&P 500 by about 3%. In my previous coverage, I was mostly focused on company-specific factors in estimating my price targets. In this updated article, I will blend a technical approach with a regression model to get a more comprehensive and empirically supported price target. With my statistical model, I will create a balance between company-specific growth factors and macro factors to have a balanced analysis.
In my new coverage, I am bullish on META both from a technical and fundamental standpoint. From a technical analysis, META is in a solid upward momentum with no signs of a reversal and based on a regression model analysis the stock has a strong upside potential. Its growth trajectory is backed by strong growth levers both micro and macro such as its growing user base which bodes well for its revenue generation, innovations such as threads, and the growing social networking industry. Given this background, I believe this stock is a good investment and rate it a buy.
Technical View
From a technical point of view, let’s evaluate the price movement and project what the future movement could be based on technical indicators. To begin with, META has been on an upward trajectory over the last year, as shown by the two blue trend lines in the chart below. Notably, the lower trend line serves as a major support zone, while the upper trend line serves as a resistance zone. The price has just bounced off the support zone, which presents a perfect entry point for potential investors.
Most importantly, let’s evaluate the strength of the trend and the possibility of a reversal by assessing several indicators. First off, the price is currently trading above its 50-day, 100-day, and 200-day moving averages, an indication that it is bullish in the short, medium, and long-term horizons. The MAs are exhibiting bullish crossovers, which are a confirmatory sign of a sustainable bullish phase. For instance, a golden cross occurred in November 2023 when the 50-day MA crossed over the 200-day MA. Currently, the 100-day MA is exhibiting a crossover with the 200-day MA, which is another bullish sustainability signal and an opportunity to buy. Simply, the stock is trading above the MAs, and it has exhibited bullish crossovers, signifying that the upward trajectory is very strong and sustainable.
Author Analysis On Market Screener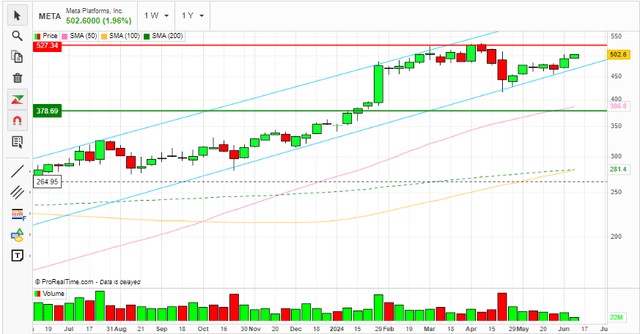
Looking at the oscillators, the RSI is at 62.6 and facing upwards. It is above the neutral point (50) and below the overbought region of 70. Being above 50 and facing upwards signifies an upward momentum, and being below 70 shows it has ample space to grow before entering the overbought region. Often, when the market is bullish, the RSI remains in the 40-90 range with 40-50 acting as a support zone. This implies that the recent RSI of 62.6 is in the middle of the bullish market and therefore the stock has a significant growth potential.
Author Analysis On Market Screener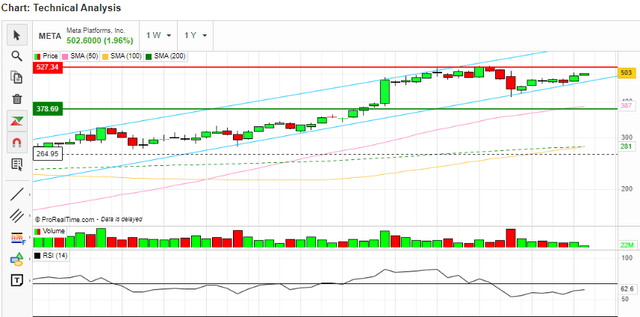
While trading volume is essential in estimating the potential price movement, let’s look at the on-balance volume indicator [OBV]. META OBV has been increasing consistently over the last year, although it declined slightly in April 2024, it has regained its momentum, and it appears to be consistently rising. I believe the slight decline in April is associated with the uncertainty that comes with quarterly performance releases. Generally, the trend is upward moving indicating increasing cumulative volume (demand) for the stock and this implies that the bulls are in control. Notably, the OBV is moving in the same direction as the stock price with no signs of divergence, and this implies that the trend is not likely to reverse. A divergence between the price and OBV is an indication of a trend reversal.
Author Analysis On Market Screener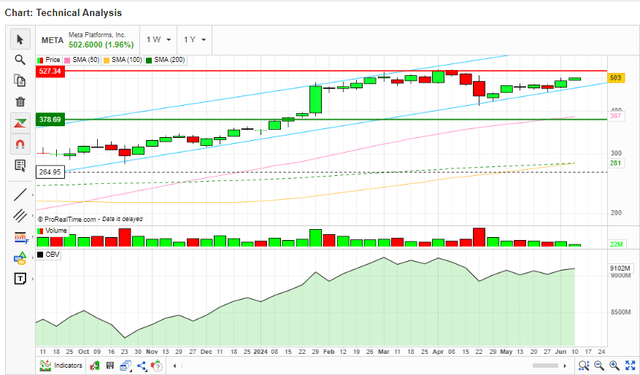
In summary, META is in a solid upward momentum with no signs of a reversal. The stock is likely to sustain its bullish momentum, especially given the golden cross-over and the absence of divergence between the OBV and stock price. Based on this analysis, I believe this stock is a buy.
As a conclusion, I will correlate the technical view with the company’s fundamentals. While I am relying on technical indicators in this section, the stock movement has been influenced by its fundamentals. To explain this, I will use two scenarios: A bearish and bullish case to show how technical indicators respond to fundamentals. For the fundamentals, I will focus on EPS because it has a strong positive correlation with the stock.
In the first case, I will refer to a dip that occurred between September 2021 and October 2022 as shown in the chart below.
Author Analysis On Market Screener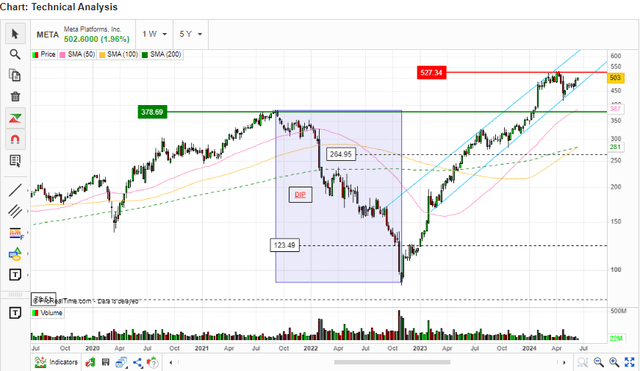
In this dip, the technical indicators particularly the MAs exhibited a bearish crossover and the price went below the MAs implying a strong bearish momentum. This was in line with the company fundamentals, given that its EPS dropped from $13.77 in 2021 to $8.59 in 2022. From this case, it is apparent that the stock price is very responsive to its fundamentals and so are the technical indicators. We can confirm this by looking at the solid upward stock growth in the last year where the MAs have exhibited bullish crossovers and the company has grown its EPS from $8.59 in 2022 to $14.87 in 2023.
Author Analysis On Market Screener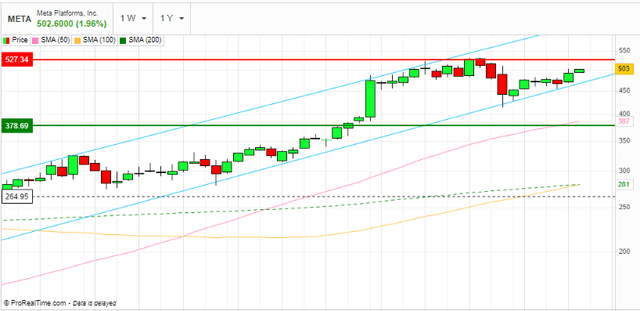
Based on this analysis, we can observe that the stock has been responsive to its fundamentals; mostly its EPS and the technical indicators have given the correct signals. Consequently, the current bullish signal from the technical indicators is reliable, especially considering the solid projected EPS growth in the future which, I believe, will be fueled by the growth levers I will discuss later in this analysis.
Seeking Alpha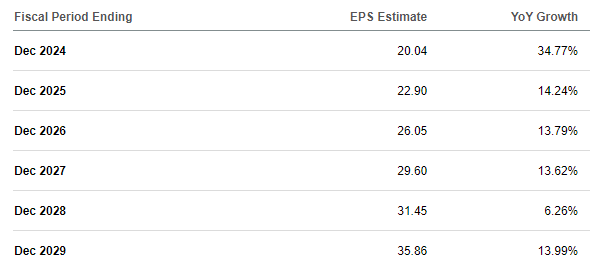
While I am bullish technically, walk with me in the section that follows as I statistically estimate my price targets.
Regression Analysis: Estimating Price Target
In my previous coverage, I didn’t do a model to estimate my price target, which is the main reason I am doing this follow-up coverage that incorporates a statistical approach which, I believe, is more comprehensive in scope and compliments the technical view perfectly. However, since the last article, the price has improved slightly to $505 from $495, although it dropped slightly in April due to the uncertainty related to earnings release.
In this section, I will do a regression analysis to estimate my price targets for this stock in the next three years. My model is rooted in fundamental analysis where my inputs, X variables or rather independent variables, are a balance between company-specific factors (revenue and EPS) and macro factors (market growth and interest rates). In my estimation, I will use the data for the last five years to run the model, after which I will use the output to calculate my price target. My assumptions are that there exists a linear relationship between the stock price and the independent variables and that the effect of the change in the X variable on the Y variable is consistent regardless of the values of other variables in the model.
For revenue and EPS, I used the available data from Seeking Alpha while for the social networking market growth, I used data from Statista. Market growth is a major growth catalyst that often influences a company’s growth potential and stock performance, hence the rationale of factoring it in his evaluation.
For the interest rates, I used the Fed funds rate. I used interest rates in my model because it affects the cost of borrowing which in turn influences investment returns affecting the stock prices.
Macrotrends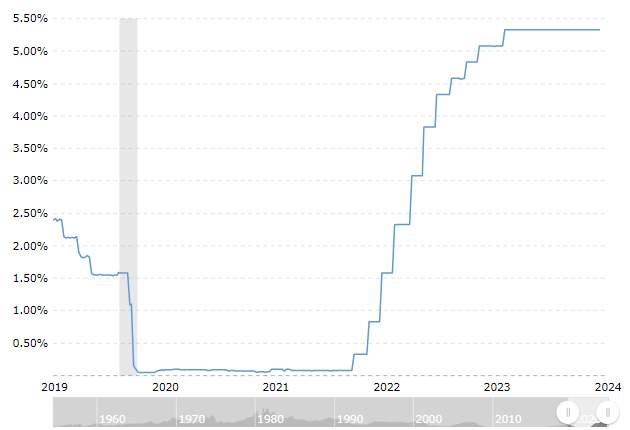
With these inputs, I ran a multiple regression model at a 95% confidence interval, and below is the output.
Author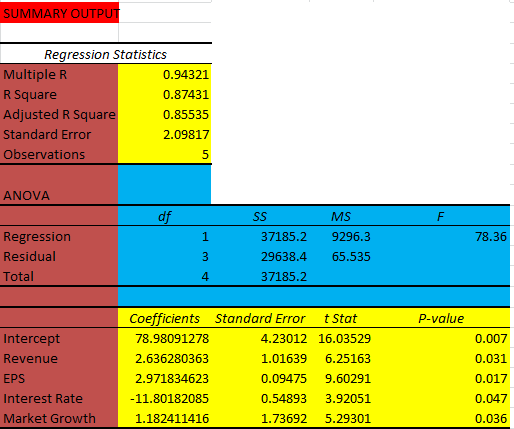
From the output, the model has an adjusted R Square of 0.855 which implies that it explains approximately 85.5% of the variability in the dependent variable, and therefore it is a good fit since a higher R Square indicates that the model explains a larger portion of the variance. In addition, the t-stat for all the variables is above 2 and the p values are below 0.05 which is the confidence interval, meaning that all the variables are statistically significant, and therefore they are valid predictors of the dependent variable.
Given this justification, the output further shows that revenue, EPS, and market growth have positive beta coefficients, meaning that any incremental unit in the three variables has an incremental effect on the stock price equivalent to their respective beta coefficients. On the contrary, the interest rate has a negative beta coefficient, meaning that any incremental unit has a negative impact on the stock price equivalent to its beta.
From these results, the overall model equation is Y=Bo+B1X1+B2X2-B3X3+B4X4+e
Where;
Y is the stock price, B0 is the intercept, B1 is the coefficient of revenue, X1 is revenue, B2 is the beta coefficient for EPS, X2 is EPS, B3 is the beta coefficient for interest rate and X3 is interest rate, B4 is the beta coefficient of market growth and X4 is market growth.
Using the equation above, we can estimate the price of this stock price in the next 3 years, which is the price target for 2027. To do this, I will use the estimated revenue, EPS, interest rate, and market size as of 2027.
The estimated revenue and EPS according to Seeking Alpha are $229.34 billion and $29.60 respectively. The market size according to the data from Statista above is 189.5 billion, and the fed fund rate as of 2027 is estimated at 2.90%. Plugging these values in the model equation, I arrive at a price target of $935.77 which translates to a growth potential of about 86.2%.
With this solid growth potential in the next three years backed by the strong bullish momentum shown by the technical indicators, I believe META is a buy. To make a solid investment case, l will discuss the growth levers that I believe will drive this company’s growth.
Potential Growth Catalyst
META has solid growth levers which I believe will fuel its stock to a sustainable long-term upward trajectory. First off, it has a diversified social media portfolio owning the most popular social media platforms such as WhatsApp, Facebook, Messenger, and Instagram. This diverse portfolio is a key pillar to the company’s growth because it forms the Family of Apps business segment, which accounts for more than 98% of its total revenue.
Market Screener
The family app is consistently attracting high usage monthly. As of the end of 2023, about 4 billion people were using the family Apps monthly. Notably, META is seeing tremendous growth in its active daily users, rising from 3.24 billion in Q1 2024 up 7% from 3.19 billion by the end of 2023. This rising user base is very critical to the company’s overall growth because it is the pillar of its revenue growth, which heavily relies on advertising. In Q1 2024, its ads revenue grew by about 27%, which is way above the 4% witnessed in the same quarter the previous year. This speaks volumes about the effects of the growing user base.
According to Statista, the social media networking industry is projected to grow by a CAGR of 7.3% by 2027. Given the company’s popular social media apps, I believe the company is well-positioned to exploit this projected market growth and keep its user base and consequently revenue base growing.
Another notable growth catalyst is the company’s innovation. Alongside its investment in AI, this company has been innovative, and one of its recent innovative apps, Threads which launched in July 2023 has proven to be successful, further cementing the company’s popularity in social media. Within one hour of its launch, the app saw more than 1 million users, and the number went to about 70 million users within two weeks. Currently, the Threads app is being used by more than 190 million users. The increasing user base shows that the company’s innovative products are attracting a vast user base, which is key for its ads revenue and overall growth.
Above all, META’s efficiency is improving, which will give its earnings a major boost. In the first quarter of 2024, its expenses grew by about 6% compared to a trailing 21% revenue growth. I believe the increasing efficiency is mostly due to the company’s cost-cutting measures, among them headcount reduction, which has seen headcount reduced by about 10% in about a year. Besides this effective cost management, the company is more than 40% more efficient than its peers in using its assets to generate revenue as shown by a high asset turnover ratio of 0.70x which is above the sector median of 0.5x.
In addition, its EPS growth will receive a major boost from the $50 billion share repurchase authorization. The aggressive share buyback will reduce the outstanding shares by about 5% which will be a major growth catalyst for EPS.
In summary, META’s growth catalyst is both company-specific initiatives backed by solid industry trends, which I believe will fuel the company’s growth trajectory in the long run. Considering the company’s main revenue generator is advertising, which accounts for more than 95% of its total revenue, I believe the projected growth in the digital advertising market will boost the company’s revenue growth, especially given the growing user base. According to KBV research, the digital ads market is projected to grow by a CAGR of 14.5% by 2030.
Risks
Although I am bullish on this stock, investing in META has its share of risks. One of the main risks of investing in this company is their metaverse investment. The Meta’s Reality lab segment, which includes this metaverse business, reported a loss of about $3.85 billion in Q1 2024. Its cumulative losses since 2020 have hit about $45 billion, which in my view, is now an ongoing concern for investors. Its future profitability is uncertain, and this could derail the company’s profitability and growth ambitions.
Conclusion
In conclusion, I rate META a buy given its strong upward momentum with a price target of about $935 by 2027 based on a regression analysis. Its outlook is bright, backed by solid growth levers which are company-specific as well as macro growth catalysts.
Analyst’s Disclosure: I/we have no stock, option or similar derivative position in any of the companies mentioned, and no plans to initiate any such positions within the next 72 hours. I wrote this article myself, and it expresses my own opinions. I am not receiving compensation for it (other than from Seeking Alpha). I have no business relationship with any company whose stock is mentioned in this article.
Seeking Alpha’s Disclosure: Past performance is no guarantee of future results. No recommendation or advice is being given as to whether any investment is suitable for a particular investor. Any views or opinions expressed above may not reflect those of Seeking Alpha as a whole. Seeking Alpha is not a licensed securities dealer, broker or US investment adviser or investment bank. Our analysts are third party authors that include both professional investors and individual investors who may not be licensed or certified by any institute or regulatory body.

