Summary:
- Meta is returning capital to shareholders by running the business in a manner which sets up FCF such that buybacks and dividends can be used effectively.
- The company has reduced its share count by 10% over a 3-year period through buybacks.
- Meta has announced its first-ever cash dividend program, paying $2.00 per share on an annual basis.
LIONEL BONAVENTURE/AFP via Getty Images
Introduction
Per my August article, Meta (NASDAQ:META) continues to increase efficiencies and 2023 did indeed turn out to be the year of efficiency. My thesis is that Meta is returning capital to shareholders in several ways. The first way is by running the business in a manner which ensures ample capital can be generated for years to come. Another way capital is being returned is through buybacks, but sometimes shareholders question the timing of repurchases. Per the 4Q23 release, capital is now being returned in yet another way – dividends. The dividend is starting out as 50 cents per quarter per share.
Running The Business The Right Way
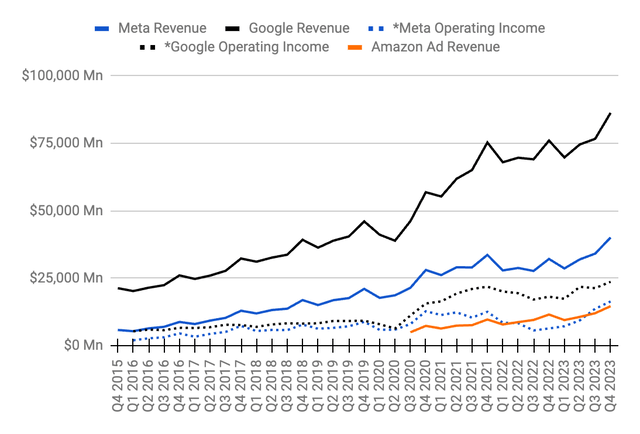
Companies with a large share of the digital ad market are in the right space. They are well positioned to return capital to shareholders for years to come. Three of the biggest companies in this space are Google (GOOG) (GOOGL), Meta and Amazon (AMZN). I expect management to continue running the business with a focus on digital ads:
Digital ad revenue (Author’s spreadsheet)
*The adjusted operating income above for Meta is higher than the GAAP numbers in 1Q19 and 2Q19 because legal expenses of $3 billion and $2 billion, respectively, are excluded.
*The adjusted operating income above for Google is higher than the GAAP numbers in 2Q17, 2Q18 and 1Q19 because fines of $2,736 billion, $5,071 billion and $1,697 billion, respectively, are excluded.
The employee count reached its apex of 87,317 in 3Q22:
|
Headcount |
|
|
1Q21 |
60,654 |
|
2Q21 |
63,404 |
|
3Q21 |
68,177 |
|
4Q21 |
71,970 |
|
1Q22 |
77,805 |
|
2Q22 |
83,553 |
|
3Q22 |
87,314 |
|
4Q22 |
86,482 |
|
1Q23 |
77,114 |
|
2Q23 |
71,469 |
|
3Q23 |
66,185 |
|
4Q23 |
67,317 |
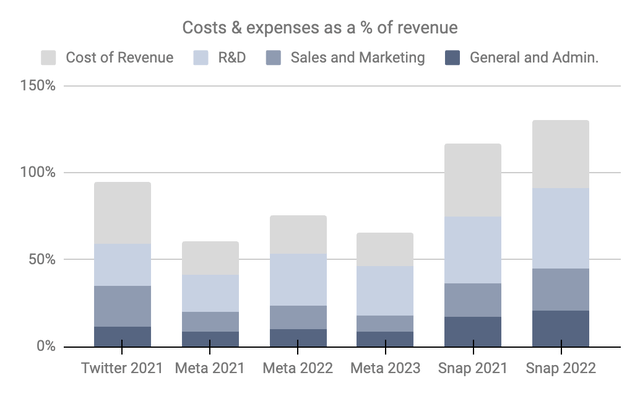
Given the large number of employees in 2022, costs and expenses were elevated for the year, but they were still good relative to the numbers at Snap (SNAP) and Twitter/X at the time. Meta management brought costs and expenses back under control in 2023:
Costs & expenses (Author’s spreadsheet)
Buybacks
The 2023 statement of equity shows 2,849 million shares outstanding as of December 2020. Repurchases helped bring this count down to 2,741 million shares in December 2021, 2,614 million shares in December 2022 and 2,561 million shares in December 2023. In other words, the share count decreased by 10% in the 3-year period from December 2020 to December 2023 such that long-term shareholders from 2020 now own a bigger piece of the pie. The 2023 cash flow statement shows the cash amount of these buybacks was $44.5 billion in 2021, $28 billion in 2022 and $19.8 billion in 2023.
Dividend
Meta is now returning capital to shareholders in the form of a dividend. The 2023 10-K explains the specifics (emphasis added):
Prior to 2024, we had never declared or paid any cash dividend on our common stock. On February 1, 2024 we announced the initiation of our first ever cash dividend program. This cash dividend of $0.50 per share of Class A common stock and Class B common stock (together, the “common stock”) is equivalent to$2.00 per share on an annual basis. The first cash dividend will be paid on March 26, 2024 to all holders of record of common stock at the close of business on February 22, 2024.
There are 2,549,405,106 shares outstanding as of January 26th so the dividend works out to about $5 billion per year based on the current share count. The yearly dollar amount will likely end up being less as it’s a good bet that buybacks will continue lowering the share count. This dividend makes a lot of sense and it aligns with the thesis from my November 2022 article (emphasis added):
My thesis is that Meta should appease investors who are concerned about capital allocation by committing to a small annual dividend – perhaps $4 billion or about 10% of the TTM buybacks.
Valuation
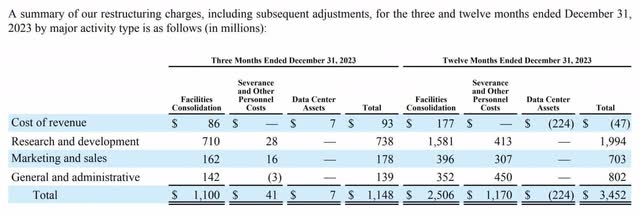
Per the 4Q23 release, restructuring charges of 3.5 billion hurt the 2023 figures:
Meta restructuring (4Q23 release)
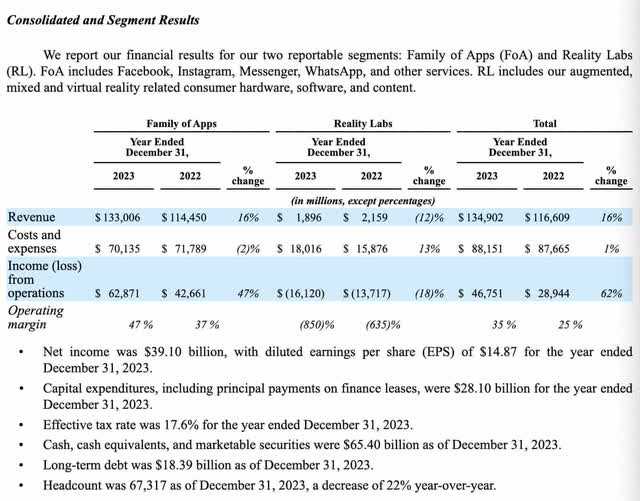
Meta’s operating income would have been billions of dollars higher in 2022 and 2023 if they didn’t have the Reality Labs segment which had an operating loss of nearly $14 billion in 2022 and about $16 billion in 2023:
FCF improved immensely in 2023. Share-based compensation (“SBC”) is not included in this calculation below and the cash flow statement shows SBC was $9.2 billion in 2021, $12 billion in 2022 and $14 billion in 2023:
In one sense, my adjusted FCF figure is lower than the numbers above because I treat SBC as a cash expense. However, my adjusted FCF figure is higher than the numbers above because management isn’t intransigent and I don’t think they’ll lose more than $10 billion per year indefinitely in the Reality Labs segment. Another factor raising the FCF figure above is the consideration that some of the capex is for growth.
2021 operating income was $46,753 million on revenue of $117,929 million. Expenses grew out of control in 2022 as revenue slightly declined, such that operating income for the year was just $28,944 million on revenue of $116,609 million. Things got back on track in 2023 with operating income of $46,751 million on revenue of $134,902 million. In the past I’ve used a multiple of 15 to 20x the high-water operating income level from 2021. Now that we’re close to matching that level, and we have some positive momentum, I think it’s time to use a different framework.
Per CFO Susan Li in the 4Q23 call, management expects 1Q24 revenue to be in the range of $34.5 to $37 billion, which is a nice improvement from the $28.6 billion figure for 1Q23. CFO Li was asked a question about the conviction in accelerating revenue growth during the 4Q23 follow-up call, and she answered as follows:
What we’re really seeing in Q1 so far has been a reflection of the generally strong and broad-based advertiser demand that we saw in Q4, and that was spread across verticals, but particularly within online commerce and gaming for us.
Costs and expenses were 59% of revenue in 3Q23 and 4Q23. If this continues in 1Q24 and we use the midpoint of revenue guidance of $35.75 billion, then we can estimate a 1Q24 operating income figure of $14.2 billion. This means trailing twelve month (“TTM”) operating income through 1Q24 should be about $53.8 billion or $14.2 billion + $46.8 billion – $7.2 billion. Using a multiple of 20 to 23x and rounding to the nearest $5 billion implies a valuation range of 1,075 to $1,240 billion.
The 2023 10-K shows 2,200,048,907 A shares plus 349,356,199 B shares for a total consideration of 2,549,405,106 shares as of January 26th. Multiplying this by the February 2nd share price of $474.99 gives us a market cap of $1,211 billion.
The market cap is near the high end of my valuation range. I mainly think of the stock as a hold, although I’m trimming my position a little bit here at all-time highs. I think the stock will be a buy again if it goes back to the levels we saw before the 4Q23 release. In other words, if it goes back to the February 1st closing price of $429.69 price again then I think it is a buy.
Disclaimer: Any material in this article should not be relied on as a formal investment recommendation. Never buy a stock without doing your own thorough research.
Analyst’s Disclosure: I/we have a beneficial long position in the shares of META, AAPL, AMZN, GOOG, GOOGL, VOO either through stock ownership, options, or other derivatives. I wrote this article myself, and it expresses my own opinions. I am not receiving compensation for it (other than from Seeking Alpha). I have no business relationship with any company whose stock is mentioned in this article.
Seeking Alpha’s Disclosure: Past performance is no guarantee of future results. No recommendation or advice is being given as to whether any investment is suitable for a particular investor. Any views or opinions expressed above may not reflect those of Seeking Alpha as a whole. Seeking Alpha is not a licensed securities dealer, broker or US investment adviser or investment bank. Our analysts are third party authors that include both professional investors and individual investors who may not be licensed or certified by any institute or regulatory body.


