Summary:
- Shares of Meta continued a massive YTD streak after posting very strong Q2 results.
- The company yet again boosted its capex spending outlook for the year and noted that depreciation and amortization costs will be elevated in FY25.
- Still, tremendous top line growth is offsetting higher spending, as Meta not only continues to add active users, but is also growing ad pricing.
- Even after the YTD rally, the stock trades at a reasonable ~21x P/E. I’m reiterating my buy rating with a $600 price target (~17% upside).
J Studios
It has been a fairly bleak earnings season for the stock market, including and especially for the tech stocks that have powered this year’s sharp rally. Yet amid carnage, one of the few bright spots this quarter is Meta (NASDAQ:META), the social media company.
Earlier this year, Meta faced pressure as it increased its spending outlook for the year, citing a desire to get ahead of the AI investment curve (which, by the way, is an important driver to be bullish on other companies in the infrastructure ecosystem, such as memory ship vendors and networking providers). Investors have seemingly gotten over Meta’s spending plans and focused on its growth rates, which are vastly outstripping its boosts in spending. Year to date, Meta has hung onto a ~50% year to date gain:
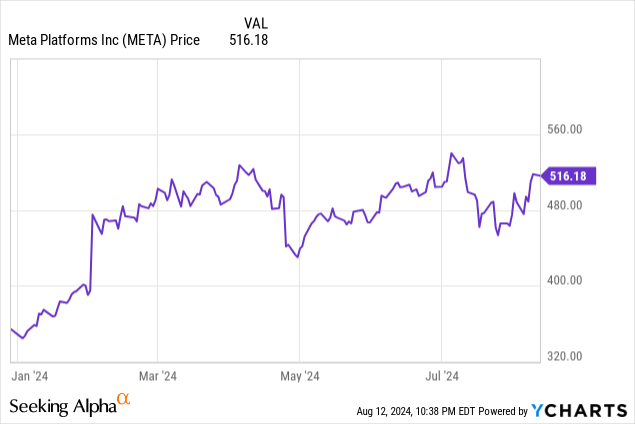
I last wrote a bullish note on Meta in May, when the stock was trading in the mid-$470s. Since then, the stock has crept up further alongside a strong Q2 earnings print. I am reiterating my buy position for Meta, though the jittery stock market (and the fact that Meta’s appeal vis-a-vis other falling tech stocks has fallen in relative terms) has me on the lookout for a near-term exit point.
Meta is raising its capex outlook… yet again
The first point to note alongside Meta’s Q2 earnings print: the company updated its outlook yet again for factor in greater planned spending on capex.
Meta outlook commentary (Meta Q2 earnings release)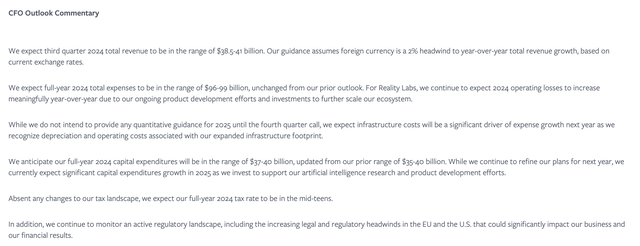
While it comes as a small relief that the company held its full-year opex (largely headcount expense) outlook at $96-$99 billion, it yet again boosted its capex spending plan to $37-$40 billion, which is $2 billion above the low end of the company’s prior $35-$40 billion range, and well above the first outlook it gave at the end of Q4’23 of $30-$37 billion in capex spending.
All of this is driving increased infrastructure investments to support AI features. Moreover, the company warned that while it’s not providing any concrete figures yet, it’s expecting FY25 opex levels to expand substantially driven by larger depreciation and amortization costs from this year’s capitalized investments into infrastructure.
But as I argued in my prior article on Meta, investors should be willing to forgive Meta’s higher spending on account of its top-line growth rates – to which excitement over AI features have contributed. Now, across the company’s portfolio of applications, the search bar functions automatically default to a Meta AI query. Since rolling these features out, Meta has continued to see daily active users climb alongside ad impressions – so it’s safe to say that Meta’s spending is yielding fruit and establishing its position as a leading AI engine.
Growth across all metrics in Q2
Meta’s Q2 results amply justify why the stock rallied in the wake of broad-based weakness among other tech peers. Take a look at the Q2 results below:
Meta Q2 results (Meta Q2 earnings release)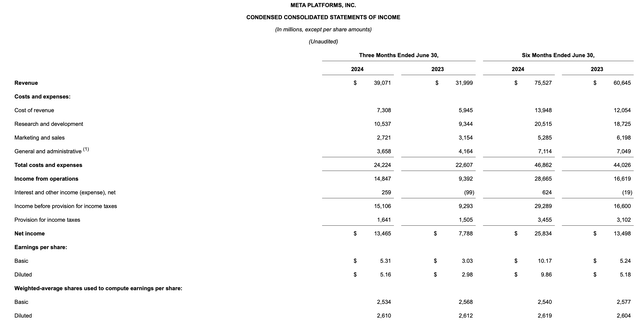
Revenue grew 22% y/y to $39.07 billion, blasting past Wall Street’s expectations of $38.31 billion (+20% y/y). We do note that revenue growth did decelerate slightly from 27% y/y growth, which was driven in part by a deceleration in ad impressions served – a metric we’ll have to watch closely in the coming quarters.
We’d think that across the world, the Meta “Family of Apps” (as the company calls it) has reached a near-saturation point, and yet the company continues to add daily active users each quarter.
Meta Family DAPs (Meta Q2 earnings release)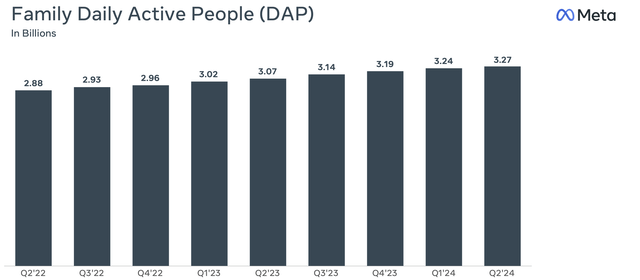
As shown in the chart above, Family DAPs reached a record of 3.27 billion, adding 30 million net-new daily active people within the quarter.
Where we will have to watch receding trends, however, is in ad impressions: which slowed from 20% growth in Q1 to 10% y/y growth in Q2. This deceleration was felt globally, with the company’s largest revenue-generating region (the U.S. and Canada) seeing impression growth rates cut in half to 8% versus Q1, and similar trends playing out in Europe, Asia, and the rest of the world.
Meta ad impressions (Meta Q2 earnings release)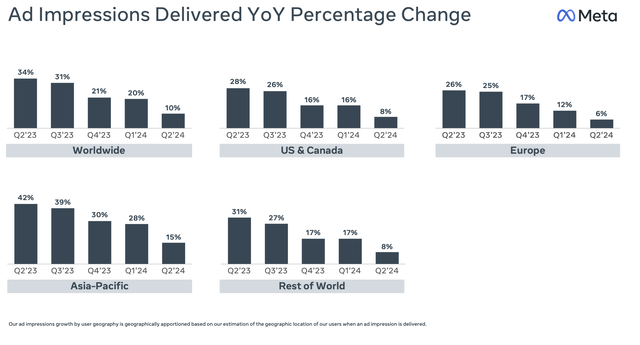
We do note that at least in the U.S., there will be a positive catalyst in the back half of the year in the form of U.S. election-based traffic, which tends to drive both increased online activity and more vigorous advertising from campaigns.
But even in the early innings of election-based messaging, Meta is benefiting from boosted ad pricing. Globally, average price per ad impression grew 10% y/y, accelerating from 6% growth in Q1 and helping to blunt the impacts from softer ad impressions growth.
Meta ad pricing trends (Meta Q2 earnings release)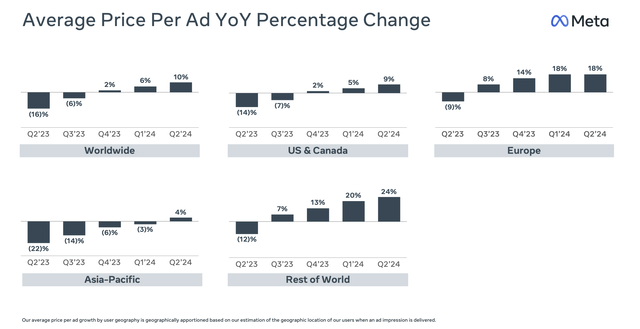
We particularly like the fact that Asia has reversed several quarters of weaker ad pricing and returned to 4% y/y growth, while the Rest of World led the pack with 24% y/y growth: an important metric as this segment has the lowest ARPU among all of Meta’s geographic segments.
Also important to note: CEO Mark Zuckerberg noted on the Q2 earnings call that the company is noticing increased traction with young adults, which it defines as the 18-29 age bucket. As this segment will continue to drive the lion’s share of advertising dollars as they age, this is a very positive long-term trend for Meta:
We estimate that there are now more than 3.2 billion people using at least one of our apps each day. The growth we’re seeing here in the US has especially been a bright spot. WhatsApp now serves more than 100 million monthly actives in the US, and we’re seeing good year-over-year growth across Facebook, Instagram, and Threads as well, both in the US, and globally.
I’m particularly pleased with the progress that we’re making with young adults on Facebook. The numbers we are seeing, especially in the US, really go against the public narrative around who’s using the app. A couple of years ago, we started focusing our apps more on 18 to 29 year olds and it’s good to see that those efforts are driving good results. Another bright spot is Threads which is about to hit 200 million monthly actives. We’re making steady progress towards building what looks like it’s going to be another major social app. And we are seeing deeper engagement, and I’m quite pleased with the trajectory here.”
We note as well that Meta continues to see generous gains in profitability:
Meta trended margins (Meta Q2 earnings release)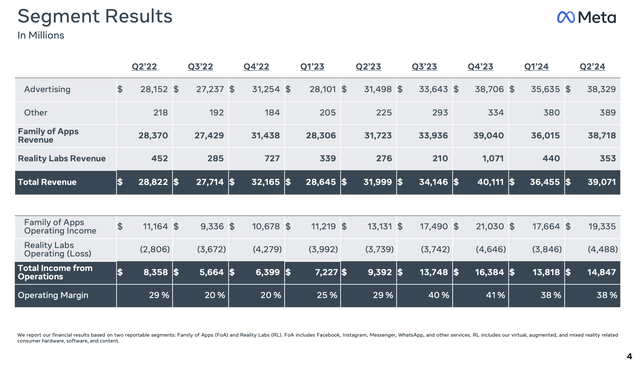
As shown in the chart above, operating income dollars leaped 58% y/y to $14.8 billion, while operating margins saw nine points of y/y improvement to 38%. Capex spending year to date has grown “only” 13% y/y, which is more than justified by Meta’s much larger corresponding increases in profits.
Valuation and key takeaways
It may come as a surprise to many investors that even after this year’s sharp rally, Meta still trades at reasonable valuations. For next year FY25, Wall Street analysts are expecting Meta to generate $183.8 billion in revenue (+14% y/y) and $24.14 in pro forma EPS (also +14% y/y).
At current share prices near $515, the stock trades at a 21.3x FY25 P/E (or 20.6x P/E on an ex-cash basis, adjusting for the company’s $45.8 billion of net cash on its most recent balance sheet). Meta is in-line with the broader S&P 500, despite its superior growth rates.
Still, I’d be ready to cash in on recent gains (with an eye to re-buy at a lower price) if the stock hits a 24x FY25 ex-cash P/E, indicating a price target of $600 for the company and ~17% upside from further levels. Until then, stay long on this stock but keep a close eye on further gains.
Analyst’s Disclosure: I/we have a beneficial long position in the shares of META either through stock ownership, options, or other derivatives. I wrote this article myself, and it expresses my own opinions. I am not receiving compensation for it (other than from Seeking Alpha). I have no business relationship with any company whose stock is mentioned in this article.
Seeking Alpha’s Disclosure: Past performance is no guarantee of future results. No recommendation or advice is being given as to whether any investment is suitable for a particular investor. Any views or opinions expressed above may not reflect those of Seeking Alpha as a whole. Seeking Alpha is not a licensed securities dealer, broker or US investment adviser or investment bank. Our analysts are third party authors that include both professional investors and individual investors who may not be licensed or certified by any institute or regulatory body.
