Summary:
- Microsoft’s strong economic moat and growth, driven by Azure, Microsoft 365, and Dynamics, make it a compelling long-term investment despite short-term market fluctuations.
- With a very high EBITDA margin, Microsoft passes the Rule of 60.
- The stock appears fairly valued based on relative valuation and a DCF model, with a Fair Value of $431.1.
- A Bull Put Spread strategy offers leverage and profitability in various market scenarios, outperforming simple stock ownership.
Justin Sullivan/Getty Images News
Investment Thesis
I have been a Microsoft (NASDAQ:MSFT) fan for quite a few years, since it came under Satya Nadella’s magic wand. Or at least since it became clear that the focus on Azure Cloud was a smart move that steers the ship on the right track. Other blockbusters followed: especially Office 365, but also LinkedIn or, more recently, the investment in ChatGPT.
But the stock price journey was not exactly smooth, but with some ups and downs generated by the market’s focus on short-term problems with different occasions.
My strategy is twofold: a small to medium stock position just for the long-term, built on undervalued moments (I wished I had bought more two years ago at $215), and another (usually) small position with options, which is naturally limited in time, opened on moments of weakness but not necessarily undervaluation; due to the power of options, we can win either way, with the price up, flat, even a little down.
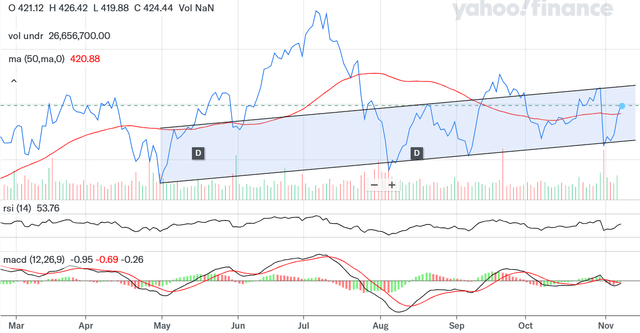
I don’t use technical analysis very much. I use it only after my conclusion through fundamental analysis is clear and only after assessing various option strategies, so just to see that I don’t buy on a local maximum, or when the stock seems overbought. However, I can’t help but notice that Microsoft had a strong support around $400 throughout the year, or it’s even in a slightly up channel.
Let’s see then if the stock is undervalued or if there is a winning strategy even if it’s fairly valued.
Business Segments: Weight and Economic Moat
Results by segment (Microsoft 10-Q)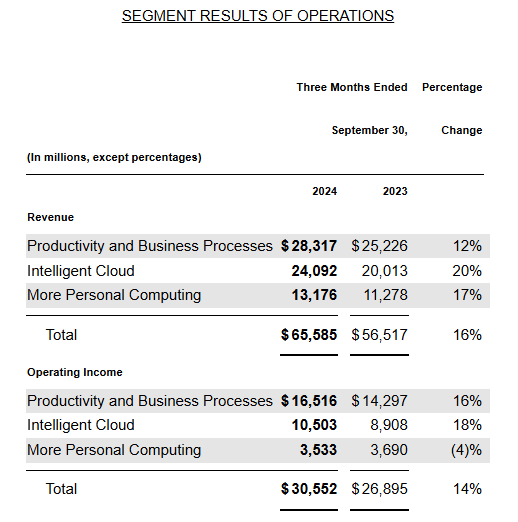
It’s not my intention to describe in detail the business segments for a behemoth like Microsoft, but I do want to briefly go through the main products to assess their economic moat and to see how sustainable the growth is.
Productivity and Business Processes
With 43% of total revenues, it had 12.5% revenue growth YoY in the last quarter, and an outstanding operating margin of about 58%. Their main products are:
- Microsoft 365 (either Commercial or Consumer) and Cloud Services – counting for almost 80% of this segment. We can clearly see a strong economic moat based on Office quasi-monopoly, on a huge, dedicated ecosystem, and on switching costs with Office integrated in countless other applications
- LinkedIn (about 15% of the segment) – I think we can speak of a narrow economic moat based on natural network effects for a two-sided marketplace
- Dynamics (6-7% of the segment) – I think it’s close to a strong moat, an ERP is a complex system with high switching costs, and Dynamics has an important and growing market share
Overall, a strong economic moat and a growth in low teens for the largest and most profitable business segment.
Intelligent Cloud
Counting close to 37% of total revenues, it’s the fastest growing segment (20% YoY last quarter) with a slightly lower, but still impressive, operating margin of 43-44%. The main products here are:
- Azure Cloud and other cloud services (about two thirds of this segment) – Azure market share reached 24% of the global cloud market in 2024 and is still growing at about 30%. It has a strong economic moat based on high switching costs (the more complex a system, the higher the switching costs) and on an ecosystem which makes easier the use of hybrid cloud, for example.
- Server products like Windows Server, SQL Server, Visual Studio – Another strong economic moat coming from high switching costs: for development tools it’s a very high cost to change an existing application, never mind the easiness of implementation with Visual Studio; for servers, data and security protection is essential. We can add to these the powerful ecosystem mentioned above.
- Enterprise and Partner Services: I think this also has at least a weak moat, if not more; it’s very difficult for an organization with managed services from Microsoft to either change providers, or to start implementing in-house solutions.
Overall, a (very) strong economic moat for the fastest growing segment, even if Azure growth will moderate a bit with time passing.
More Personal Computing
With about 20% of total revenues, the segment had a growth YoY of 17%, but this was mostly driven by the Activision Blizzard acquisition, the organic growth being low single digit. The operating margin of 26-27% is also the lowest. The main products found here are:
- Gaming (42-43% of this segment) – I always saw Gaming as marginal for Microsoft, but that changed with the Activision Blizzard acquisition. I see a narrow economic moat based on a powerful franchise which can trigger new updates, ads, or in-game items.
- Windows and Devices (about 33% of the segment) – While Windows has a strong moat based on its ecosystem and on network effects with new users and applications rolling a snowball, I don’t think there is any moat for Devices (but this is a minuscule sub-segment)
- Search and News Advertising (about 25% of the segment) – I find the hardest to say about this, I think there is no economic moat, at least not for now. Bing market share is still very low, let’s see if ChatGPT can move the needle. However, this sub-segment is only about 5% of total revenues, so without a significant impact on the overall strong moat.
A Financial Fortress and the Rule of 60
An AAA rated company. About $80B cash and equivalents. Huge amounts of free cash flow. Can’t find many ideas about meaningful developments in-house? Let’s go shopping: LinkedIn, Nuance, OpenAI, Activision Blizzard. Can’t find anything on the market? Share buybacks are always on the table (on top of significant dividend growth).
According to the Rule of 40, a healthy SaaS company has a combined revenue growth and free cash flow (or EBITDA) margin of at least 40. A new paradigm aroused in the last years: the Rule of 60, created for leaders in different areas. Well, for Microsoft, if we take EBITDA margin, there could be a Rule of 70.
Let’s see the estimates for the two parts of the equation. For revenues, consensus estimates are:
Consensus revenue estimates (Seeking Alpha)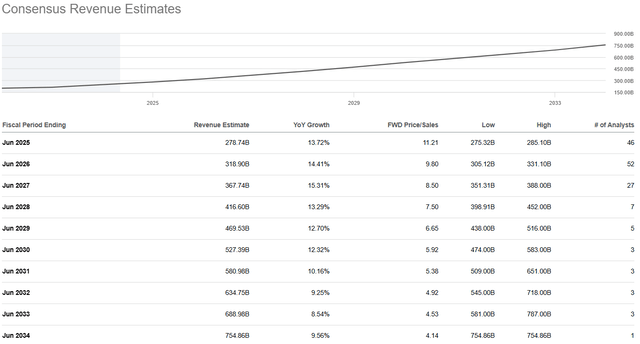
I only look at the next five years because after that, the picture is more blurred. Based on the above business segments weight and growth, I tend to agree with these estimates. Not 100% clear why those estimates for the slight growth acceleration in 2027 specifically, perhaps the analysts think (or hope) that AI investments will bear some fruits.
On the profitability side, there is a normal margin increase from scaling. On the other side, some margin pressures, like this year “from the Activision acquisition as well as from investments in cloud engineering”. I expect investments in AI and cloud to continue, so maybe just a slight improvement in margin in next five years.
Fair Value
I find irrelevant a comparison with the IT sector median, there are very different companies. Even if we narrowed to industry (software) median, I would still find it mostly irrelevant…how many companies easily surpass the Rule of 60, with a strong accent on profitability? I think Oracle (ORCL) is the closest to a competitor, maybe Alphabet (GOOGL), but that’s too little for a comparison.
However, I do find relevant a comparison with the last five years, Microsoft was not much affected either by the pandemic, or by the high-interest rates:
MSFT Valuation (Seeking Alpha)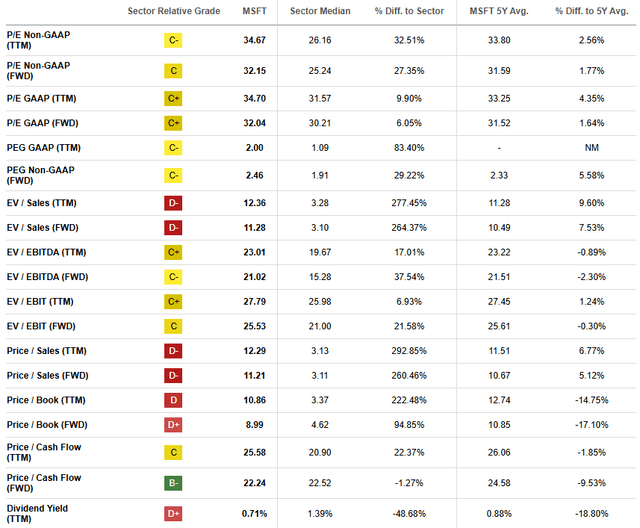
It’s remarkable how practically every multiple (PEG, EV/Sales, EB/EBITDA, Price/Cash Flow) is very close to 5Y average, which likely indicates the stock is fairly valued.
For an absolute valuation, I use a DCF (Discounted Cash Flow) model in three stages:
For stage I, from 2024 to 2028:
- I took consensus revenue estimates through 2028
- I model a gradual increase in operating margin by 1 bps per year to 49% in 2028
For stage II, from 2029 to 2033:
- I model a gradual moderation in growth from 10% in 2029 to 5% in 2033
- I keep the same operating margin at 49%
For stage III, I model 3.1% growth in perpetuity (4% for Intelligent Cloud, 3% for Productivity and Business, 1% for More Personal Computing).
For WACC I use 8.7%, based on a 9% Cost of Equity, which is in line with Microsoft’s beta. Another way to come at this is starting from SaaS average of about 11%, then subtracting about 1% for a strong economic moat, 0.5% for a strong cash position, 0.5% for huge profitability.
The resulted Fair Value = 439.1, once again very close to the current price. I also do a sensitivity analysis varying WACC and Growth in Perpetuity (I usually work with 5 values for each for very volatile stocks, but for Microsoft, I took only 3):
|
Fair Value |
WACC=8.2% |
WACC=8.7% |
WACC=9.2% |
|
Growth=2.6% |
446.03 |
410.23 |
379.70 |
|
Growth=3.1% |
481.07 |
439.11 |
403.86 |
|
Growth=3.6% |
523.71 |
473.65 |
432.34 |
We observe that the differences are not modest, so I think a better margin of safety is necessary to start a stock position (under that $379.70 would be great), although I tend to favor a great company at a fair price.
But in this case, I prefer to look at options. Among several possible strategies, I think there is one which is a win-win either the stock price stays flat or advances (after all, even if it’s fairly valued, we could expect the price to advance once with the EPS), or…even if the price declines a bit.
A Strategy for the Stock Price Up, Flat, Or Even Slightly Down
One of my favorite strategies for this setup (a great company with higher-than-average growth and which is fairly valued) is a Bull Put Spread, so we sell a Put option, and we buy another Put option at a lower strike. Even if this strategy brings leverage with limited risk, for beginners unfamiliar with the strategy I recommend testing it first about one year on a demo account.
Every strategy can be implemented differently from case to case. As I said in the introduction, I see a strong support for the stock price around $400, that’s why I would sell a 395 Put and buy a 385 Put, or a 395/385 Put Spread. That brings a lower profit than a 430/420 Put Spread, but the probability of profit is considerably higher.
As for the expiration date, while I usually chose around 6 months for volatile stocks, Microsoft does not have such a high Implied Volatility, so I would choose about nine months, in order to increase the collected premium.
We can sell a MSFT 395/385 Put Spread expiring Aug’25 for about $300. Total cost is 1000 (the spread between the Puts, which is the maximum cash that I need to pay at expiration if both Puts finish In-The-Money) – 300 (difference between premiums that I collected) = about $700.
The maximum profit at expiration would be about $300 for stock price above $395, meaning about 43%, or 57% annualized. The break-even is at about $392, and maximum loss is the total cost for stock price under $385.
MSFT Bull Put Spread P&L (optioncharts)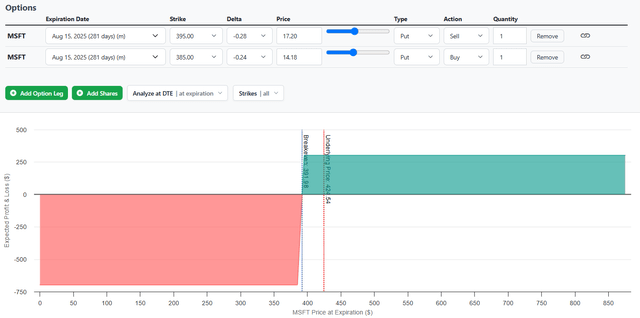
But by handling the position before expiration and rolling it, we can profit even at lower prices:
Scenario 1…Stock price above $395:
Let the position collect the maximum profit, that could be ~57% annualized at expiration or even higher if we close it before. For example, if we could close the position in May 2025 for $25, it’s not worth it to keep it more (we avoid a possible price reversal), and we can gather a profit of (300 – 25) / 700 = about 39%, or 78% annualized.
This is a very powerful strategy: it brings leverage (very hard to believe we could see 39% return simply by a stock position until May) and, at the same time, wins in 3 directions: price up, flat, or even slightly down! Then, of course, we can just roll on the position (unless the stock becomes overvalued).
Scenario 2…Stock price retreats at $390-395, then it stays there or comes back up:
I prefer to close the position when the price is in this range ($390-935), to avoid bigger losses.
In a second iteration, we could open a similar Put Spread at lower strikes, short 360 Put, long 350 Put, for another 9 months:
|
Date |
Stock price |
Op. |
Position |
Pos. price |
Funds needed |
Profit |
|
Nov ‘24 |
424.5 |
Open |
-1 395/385 Put Spr Aug’25 |
300 |
700 |
|
|
Feb ‘25 |
390 |
Close |
-1 395/385 Put Spr Aug’25 |
460 |
-160 |
|
|
Feb ‘25 |
390 |
Open |
-1 360/350 Put Spr Nov’25 |
300 |
700+160 |
|
|
Nov ‘25 |
365 |
Close |
-1 360/350 Put Spr Nov’25 |
0 |
300 |
|
|
860 |
140 |
In this scenario, the total cost (maximum funds needed to be set aside) is a bit higher since we need extra funds after the loss in the first iteration in order to open the second iteration, but in about one year we will still have a return of about 140/860 = 16%, and that even if the stock price falls to ~$365!
Scenario 3…The stock keeps rolling down:
I think you got the idea; you can continue to roll down the position, this time perhaps increasing the spread width (the wider the spread, the higher the collected premium):
|
Date |
Stock price |
Op. |
Position |
Pos. price |
Funds needed |
Profit |
|
Nov ‘24 |
424.5 |
Open |
-1 395/385 Put Spr Aug’25 |
300 |
700 |
|
|
Feb ‘25 |
390 |
Close |
-1 395/385 Put Spr Aug’25 |
460 |
-160 |
|
|
Feb ‘25 |
390 |
Open |
-1 360/350 Put Spr Nov’25 |
300 |
700+160 |
|
|
May ‘25 |
355 |
Close |
-1 360/350 Put Spr Nov’25 |
460 |
-160 |
|
|
May ’25 |
355 |
Open |
-1 325/310 Put Spr Jan’26 |
450 |
1050+320 |
|
|
Jan’26 |
330 |
Close |
-1 325/310 Put Spr Jan’26 |
0 |
450 |
|
|
1370 |
130 |
Even in this scenario, with the stock falling to $330 until January ’26, we still have a positive return of 130/1370 = ~9.4%! Of course, we needed to add some extra funds, we started with $700, in total we needed $1370, that’s why it’s important to start with a more modest position in the first iteration (like when you buy shares, if it’s fairly valued you start with a more modest position).
Risks
The short-term risk of a pullback in case of a recession is well covered by our Bull Put strategy, as we can see above (in one or more iterations).
Azure has today both high growth and a high market share, and I modeled 4% growth in perpetuity, so higher than GDP growth. If Azure growth were in line with GDP (due perhaps to competition), then Fair Value would be $410 (corresponding to a 2.6% growth in perpetuity).
I also modeled slightly increasing margins until 2029. If operating margins stayed at today’s level (for example because of heavy investments in AI), then Fair Value would be $394.
A very rare, but possible problem in Scenarios 2 and 3 described above for the Bull Put Spread strategy is if there is a sudden big drop in price exactly when it’s near the strike price of $395. For example, the price goes in a single day from $400 to $360, and we must close the iteration at $360 instead of $390 incurring a higher loss that can vary from $400 to the maximum of $700 (depending on how close to expiration we are). But a profit can still be achieved by rolling down the position and increasing the spread width like presented in Scenario 3, or by choosing the spread more aggressively (for a fatter premium) if we believe the stock is undervalued: for example, with the stock price at $360, we could choose either a 325/310, or a 365/355 Put Spread in the next iteration.
Finally, even in a very unlikely catastrophic scenario when the price collapses due to existential fundamental problems, the Bull Put Spread strategy has always a limited maximum loss ($700 in our example), while the losses from holding shares can be higher.
Takeaway
From a technical analysis point of view, Microsoft had a strong support around $400 throughout this year, or it’s even in a slightly up channel. With the stock price last days close to this support level, I became interested (again) in such a great company, with a powerful economic moat in about 90% of its business segments.
With revenue growth in low-to-mid teens (driven especially by Azure, Microsoft 365, Dynamics) and huge profitability, Microsoft easily passes not only the Rule of 40, but also the Rule of 60 (if we take EBITDA margin).
The stock seems fairly valued based both on a relative valuation, and on a DCF model with 8.7% WACC and 3.1% growth in perpetuity (which gives a Fair Value = $431.1).
A Bull Put Spread strategy is more powerful than simply owning the stock in any realistic scenario:
- It brings leverage when the stock price is up, flat or slightly down
- When the stock price keeps climbing down, a profit can still be made by rolling down the position and eventually increasing the spread width
Analyst’s Disclosure: I/we have a beneficial long position in the shares of MSFT either through stock ownership, options, or other derivatives. I wrote this article myself, and it expresses my own opinions. I am not receiving compensation for it (other than from Seeking Alpha). I have no business relationship with any company whose stock is mentioned in this article.
Seeking Alpha’s Disclosure: Past performance is no guarantee of future results. No recommendation or advice is being given as to whether any investment is suitable for a particular investor. Any views or opinions expressed above may not reflect those of Seeking Alpha as a whole. Seeking Alpha is not a licensed securities dealer, broker or US investment adviser or investment bank. Our analysts are third party authors that include both professional investors and individual investors who may not be licensed or certified by any institute or regulatory body.

