Summary:
- Microsoft has shown strong quarterly earnings with 16% revenue growth and $3.30 EPS, surpassing consensus estimates, justifying an upgrade to a “buy” rating.
- Despite short-term bearish trends, Microsoft’s long-term price history remains bullish, with major support near $385 and potential for another uptrend.
- Microsoft’s valuation metrics are competitive within the MAG-7 group, with a forward P/E ratio of 31.69x and attractive price-book metrics.
- Risks include recent lower highs and a break below key Fibonacci retracement levels, but strong earnings and support zones suggest potential for recovery.
Jean-Luc Ichard
Introduction
When I last covered Microsoft Corp. (NASDAQ:MSFT) (NEOE:MSFT:CA) on October 17th, 2024, with my article “Microsoft: It’s Time To Look Elsewhere” the stock was attempting to stabilize after falling quite sharply from its all-time high of $468.35 (which was posted during the July 5th, 2024 trading session). In my article, I downgraded the stock to a “hold” rating while I presented the argument that more stock choices could be found within the technology sector. Essentially, this argument rested on the assertion that Microsoft has a history of weak stock performances following earnings reports, relatively lofty forward valuation metrics, and bearish chart patterns that suggested stalling price action. Since then, the stock has continued to trade in the sideways (to downward), direction and share prices have underperformed the S&P 500 (with losses of -1.74%).
Earnings Review
Microsoft: Quarterly Earnings Figures (Microsoft: Quarterly Earnings Presentation)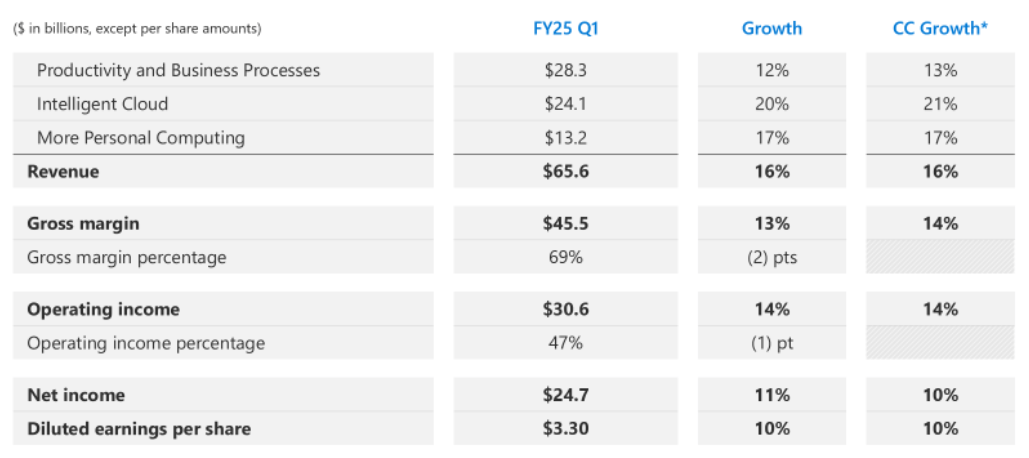
In the trading periods that have followed, Microsoft has seen major updates and released earnings results for the fiscal first-quarter, which revealed revenue growth of 16% on an annualized basis. Per-share earnings figures came in at $3.30 (beating consensus estimates by more than 6.45%) and the quarterly revenue figure came in at $65.59 billion, which surpassed consensus estimates by a smaller margin (1.67%). Net income figures increased to $24.67 billion (which indicates annualized gains of 11% for the period) and Microsoft’s guidance figures suggest revenues will post within a $68.1-69.1 billion range for the fiscal second-quarter period. At the midpoint, this would imply annualized revenue growth rates of 10.6% for the quarter.
Comparative Valuations
Microsoft: Comparative Forward Price to Earnings Valuations (YCharts)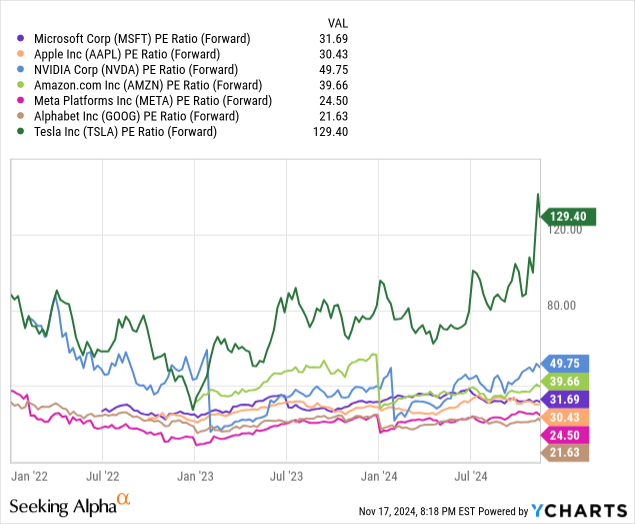
Data by YCharts
When considering new long positions in MSFT stock, I will generally compare its prospects with the other options available within the MAG-7 peer group. At the moment, Microsoft’s forward price-earnings ratio of 31.69x is right in the middle of the cohort in terms of relative valuations. On the downside, Apple Inc. (AAPL) has a forward price-earnings ratio of 30.43x, while Meta Platforms, Inc. (META) and Alphabet Inc. (GOOG) are trading at even cheaper valuations (at 24.5x and 21.73x, respectively). On the other direction, Amazon.com, Inc. (AMZN) is trading at slightly higher valuations (at 39.66x) and NVIDIA Corp. (NVDA) is quite a bit more expensive right now (at 49.75x). However, all of these stocks are trading at relatively inexpensive valuations when compared to Tesla, Inc. (TSLA), which is the outlier in this group and is currently trading with an astronomical forward price-earning ratio of 129.4x.
Microsoft: Comparative Forward Price to Sales Valuations (YCharts)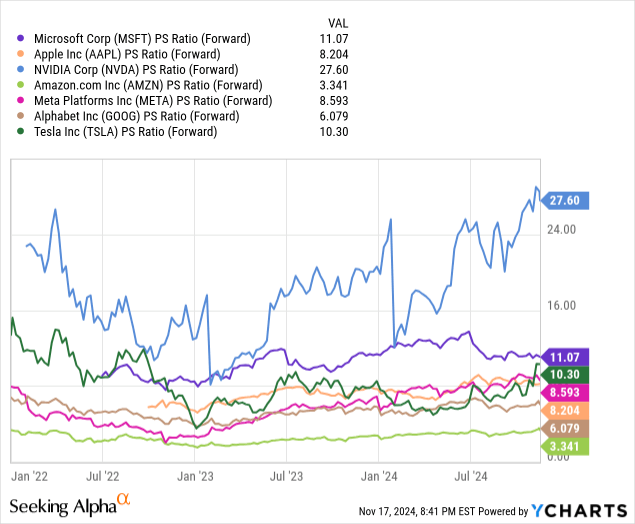
Data by YCharts
If we change the valuation perspective a bit, and instead use the forward price-sales metric, Microsoft starts to look quite a bit more expensive (at 11.07x). In this case, only Nvidia is currently trading at more expensive levels (at 27.6x). On the downside, we have several MAG-7 options that are trading at cheaper valuations right now. Next in line would be Tesla (at 10.3x) and roughly similar valuations can be found in Meta Platforms (at 8.593x) and Apple (at 8.204x). However, we can still find cheaper alternatives within this grouping because Alphabet currently trades at 6.079x forward sales, and Amazon is looking quite cheap at the moment (with a ratio of 3.341x).
Microsoft: Comparative Forward Price to Price Valuations (YCharts)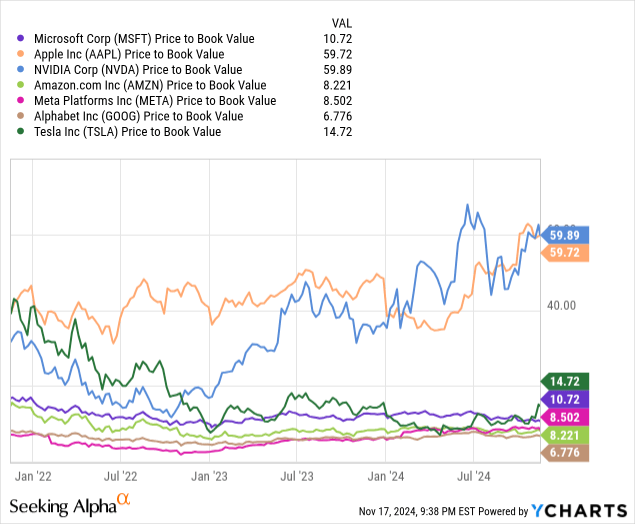
Data by YCharts
Last, we will take a bit of a broader view and assess this peer grouping on the basis of its comparative price-book metrics. Here, the most expensive stocks in the cohort can be seen with Nvidia (at 59.89x) and Apple (at 59.72x). From there, we can see a sizable drop-off in valuation levels because Tesla is currently trading at much lower levels (with a ratio of just 14.72x). Below here, Microsoft is trading at 10.72x book value while Amazon trades with a ratio of 8.221x and Meta Platforms trades with a ratio of 8.502x. Using this metric, the cheapest stock in the group is Alphabet (which trades at just 6.776x book value). Based on each of these readings, I think it is fair to say that there are no significant warning flags in terms of Microsoft’s current valuation metrics which might suggest that the stock is in danger of encountering major declines near-term. Microsoft’s forward price-sales ratio puts the stock in its best light, but the other two important metrics show that MSFT is trading roughly near the middle of the pack.
Technical Analysis
Microsoft: Key Daily Support Levels (Income Generator via TradingView)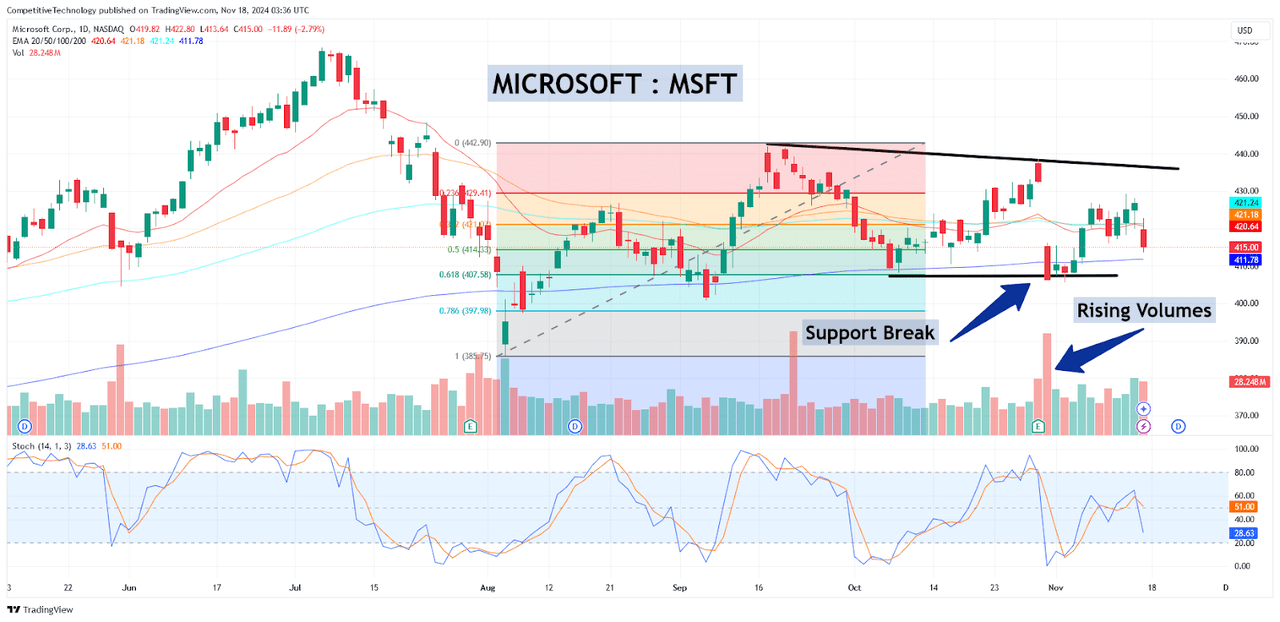
When considering potential risks for MSFT long positions, one glaringly obvious factor is the stock’s price action itself. Specifically, we have been seeing a series of lower highs ever since the stock posted its record high of $468.35 during the July 5th, 2024 trading session. In addition to this, the stock fell below the 61.8% Fibonacci retracement of the short-term rally from the August 5th, 2024 lows of $385.58 to the September 17th, 2024 highs of 441.85 (which is located near $407.60). As we can see, there is a daily closing bar below this price level and the downside break was accompanied by rising trading volumes (both of which are signals that strengthen the validity of the downside price break). Stochastic indicator readings on the daily time frames are not yet oversold and this ultimately suggests that the stock could fall further before reaching bearish valuations that would be considered to be over-extended (or unsustainable).
Microsoft: Key Weekly Support Levels (Income Generator via TradingView)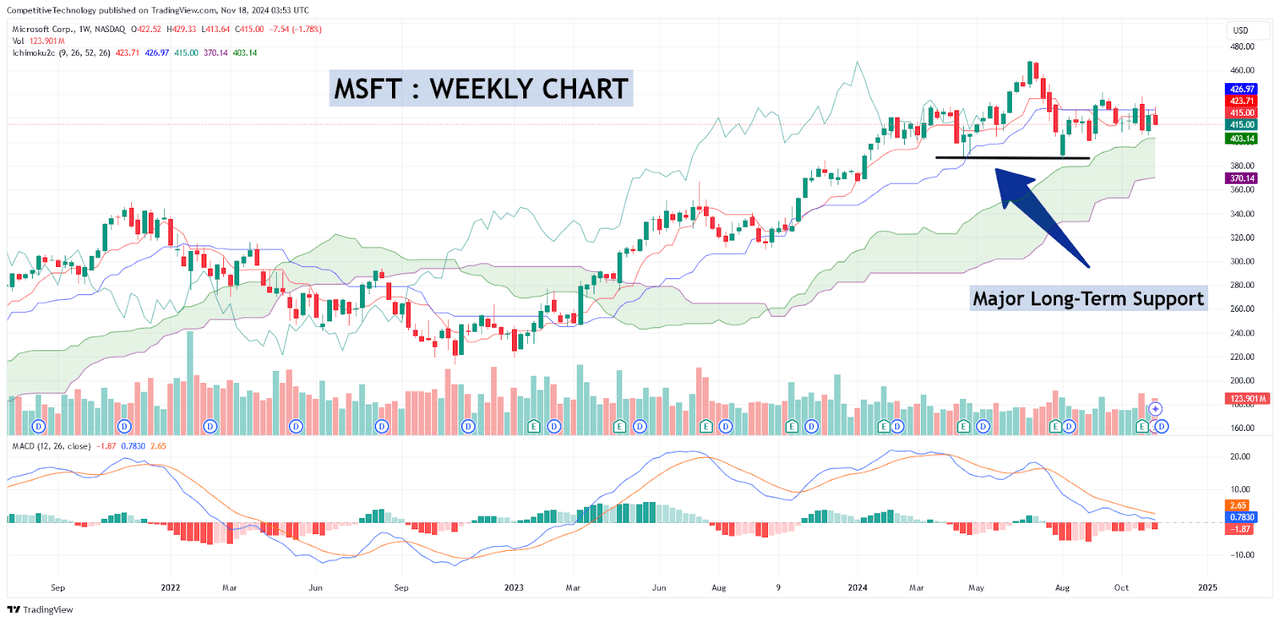
Fortunately, the stock is still looking quite strong when we view its price history from a longer-term perspective. On the weekly time frame, major support zones can still be found near the double-bottom formation that has been generated by the April 22nd, 2024 lows and the aforementioned lows from August 5th, 2024 (both of which are found just above the $385 level). As long as this support zone remains intact, the structure of the long-term price history remains bullish, even with the shorter-term bearish declines that occurred near the end of October. If we are viewing these brief declines as the formation of a consolidative base, a resumption of the broader uptrend could conceivably result in another break above the $460 level as we head into next year. However, it is important to also be prepared with a strategy in the event that substantial selling pressure unfolds within the broader markets and MSFT share prices continue trading in the downward direction. In this case, I plan to exit my long position if Microsoft stock falls below the aforementioned support zone near $385 because a decline this forceful might cause losses to accelerate and target a re-test of the December 2023 lows of $374.46 and create a more prolonged period of sideways consolidation.
Conclusion
Ultimately, I found Microsoft’s quarterly earnings performances (in areas such as Azure Cloud, which posted annualized growth rates of 33%) to be strong enough to support the growth outlook and justify an increase in my stock rating. Comparative price-book valuations show that the company is trading with far more attractive metrics when compared to companies like Nvidia and Apple, and broad stabilization within MSFT price action suggests that we might be basing for another run higher. As a result of all of these factors, I am maintaining my current long position and raising my outlook rating to a “buy” for this classic tech giant.
Analyst’s Disclosure: I/we have a beneficial long position in the shares of MSFT, AMZN, NVDA either through stock ownership, options, or other derivatives. I wrote this article myself, and it expresses my own opinions. I am not receiving compensation for it (other than from Seeking Alpha). I have no business relationship with any company whose stock is mentioned in this article.
Seeking Alpha’s Disclosure: Past performance is no guarantee of future results. No recommendation or advice is being given as to whether any investment is suitable for a particular investor. Any views or opinions expressed above may not reflect those of Seeking Alpha as a whole. Seeking Alpha is not a licensed securities dealer, broker or US investment adviser or investment bank. Our analysts are third party authors that include both professional investors and individual investors who may not be licensed or certified by any institute or regulatory body.
