Summary:
- Microsoft’s valuation is upgraded from “hold” to “buy” with a near-term target of $417.30 and a 2033 target of $1,099.90, implying 14.6% annual returns.
- The Company’s growth is driven by its cloud business (Azure), and acquisitions like Activision-Blizzard.
- MSFT holds a 24% cloud market share (second to Amazon’s 31%) and dominates with a 72.17% share in the PC OS market.
- Microsoft’s TAM is expected to grow from $754.1B in 2024 to $1.70T by 2029, with the cloud segment driving most of the growth.
- The valuation (which uses a DCF model) suggests 14.6% annual returns throughout 2033 (and could be higher if Azure grows faster than expected).
InnaFelker
Thesis
In my previous article on Microsoft Corporation (NASDAQ:MSFT), I downgraded the stock from “buy” to “hold”, explaining that according to my models, Microsoft had reached a fair valuation when it was trading at $425.52 (which was 6.6% higher than my fair stock price estimate of $397.49). Furthermore, I suggested that the stock could reach a price of $701.68, translating into 10.50% annual returns throughout 2024-2029.
Microsoft released Q3 2024 earnings on April 25. For that quarter, Microsoft reported an EPS of $2.94 (3.8% higher than estimated) and revenues of $61.9B (1.65% higher than estimated).
After revising my valuation on Microsoft, I arrived at a near-term stock price target of $417.30, and a 2033 target of $1,099.90. The first number implies a 6.5% downside from the current stock price of $446.34, and the former, is 14.6% annual returns throughout 2024-2033 (which already sets Microsoft as an outperformer), furthermore, if Azure grows faster than the growth rate I used, Microsoft could become undervalued. Because of these reasons, I upgrade the stock from “hold” to “buy”.
Overview
Growth Plan
Microsoft’s recent growth primarily comes from its cloud business Azure. Microsoft has been doting Azure of AI capabilities by establishing new Data Centers, for instance, Microsoft is one of Nvidia Corporation’s (NVDA) major clients.
Microsoft also acquires businesses related to its already established segments, such as when it bought Activision Blizzard, which owns games such as the Call of Duty franchise, Diablo, and Overwatch 2. This acquisition brought up a lot of scrutiny from regulators (particularly from the UK) since it helped Microsoft to create a network effect with its Xbox platform (which dominates the gaming consoles market along with the PlayStation and the Nintendo Switch).
How does Microsoft Compare Against Peers?
Since Microsoft has too many segments, I will focus on the ones providing the most revenue: Cloud, Office Products and Licenses, and Windows OS.
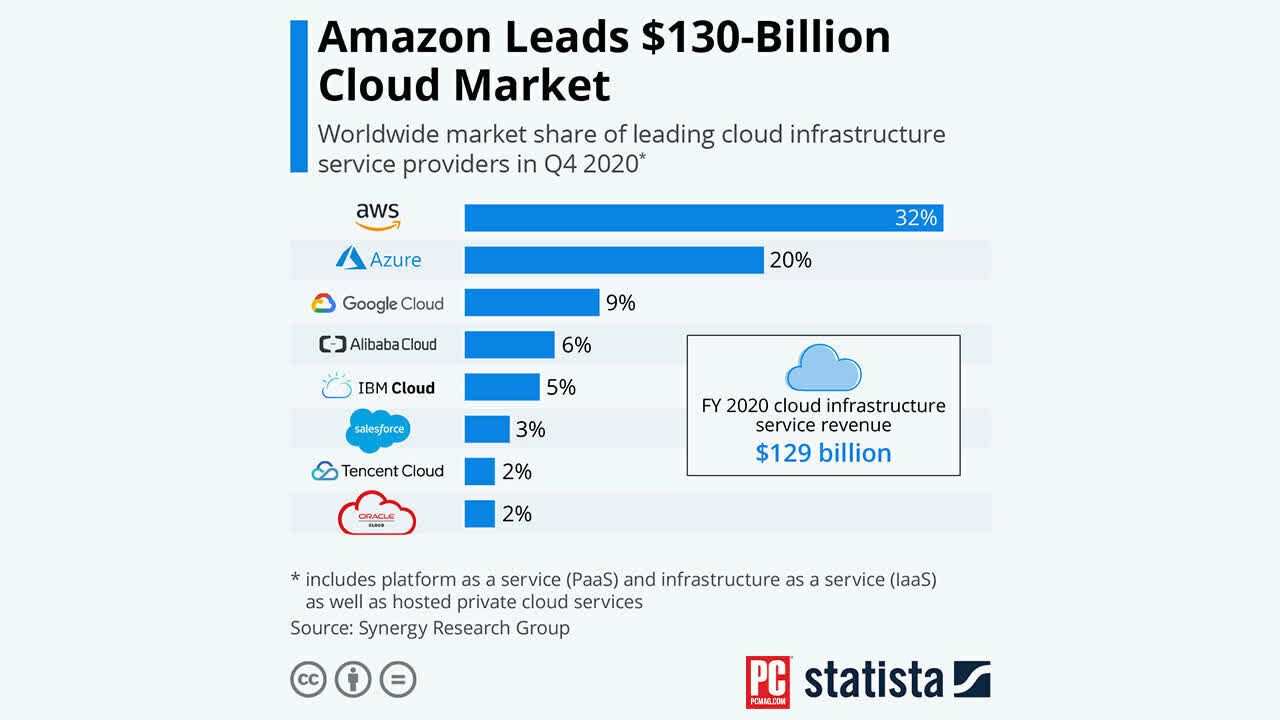
In the PaaS and IaaS cloud markets, Microsoft boasts a 24% market share, which puts Microsoft in second place behind Amazon.com, Inc. (AMZN) which holds 31%. However, what sets Microsoft apart is that its market share increased by 4% since 2020 when it was 20%. Meanwhile, Amazon’s market share lost 1%.
Statista Statista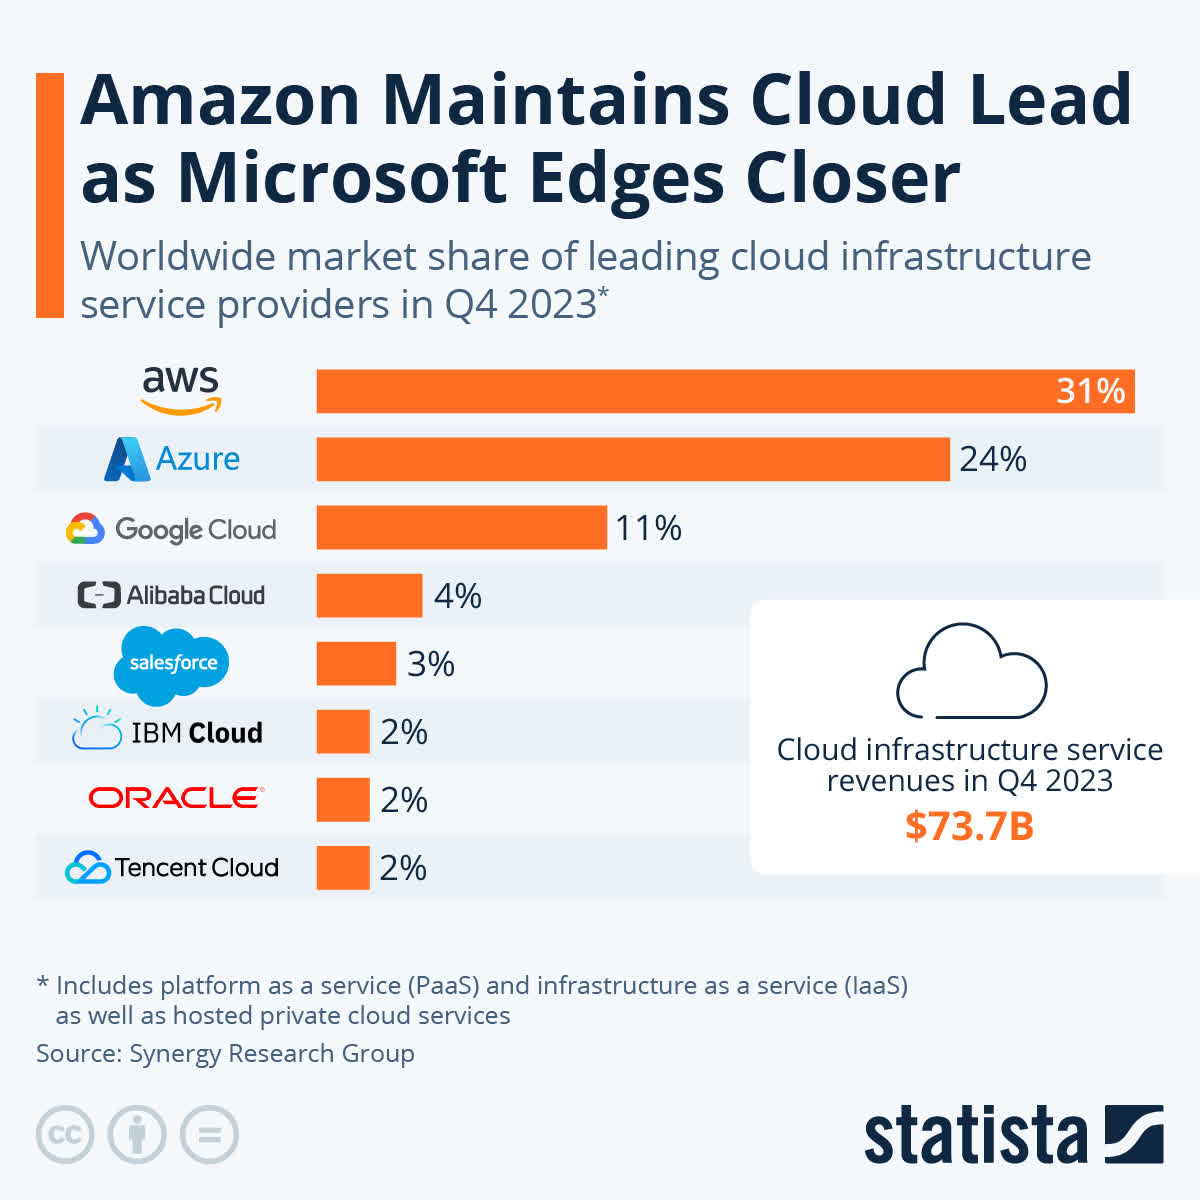
On the other hand, Microsoft Office holds a 30% market share, which is behind Alphabet, Inc. (GOOG)(GOOGL), which has 44%. This is because Google’s Office version is free and enough for casual users such as students. However, Google Sheets (Google’s version of Excel) lacks some crucial capabilities that Excel has.
Lastly, Windows continues to dominate the PC OS market, holding an impressive 72.17% market share. In second place, it’s Apple (AAPL) with a 15.42% market share.
Industry Outlook & Addressable Market
The productivity & business processes segment, comprises Office 365, on-premise office licenses, LinkedIn, and Dynamics 365 intelligent cloud. The business productivity market is expected to reach a $59.37B valuation in 2024 and $120.52B in 2029. This shows an annual CAGR of 15.29%.
Meanwhile, the Worldwide Public Cloud market is expected to have a market volume of $282.2B in 2024, which should increase to $1.06T in 2028, thus showcasing an annual growth rate of 11.37%. This is the market in which Microsoft’s intelligent cloud segment is. This segment offers Azure, SQL servers, Windows Server, Visual Studio, System Center, and related licenses.
Lastly, the “More Personal Computing” segment, agglomerates very diverse products such as the Windows OS, Microsoft Surface devices, HoloLens, XBOX, Microsoft Edge, Bing search engine, and PC accessories such as mice and keyboards.
The worldwide gaming console market is expected to reach a $26.43B valuation for 2024 and $43.12B for 2029, translating into an 8.50% CAGR throughout that period.
Then, the global PC Accessories market is expected to reach a $27.58B valuation in 2024 and $48.9B in 2029, which is a 12.13% CAGR.
Then, I calculated Bing & Microsoft Edge TAM to estimate the expected total internet users. For 2024TTM, Google Search Engine has $188.85B in revenues, which divided by the total users of 4.29K, yields a result of $43.99 per user. For 2024, the total number of internet users is estimated to be 5.25B. For 2029, that number should increase to 6.58 B. Therefore, what I did is that I assumed that Microsoft (to compete) will maintain the same revenue per user as Google. This means that Bing’s TAM for 2024 would stand at around $231.12B, and will increase to $289.45B by 2029. Which showcases a 4.21% CAGR throughout that period.
With all these segments, Microsoft’s current TAM is at $754.1B, and for 2029, the TAM should increase to $1.70T, which is a 21.11% annual growth. However, as was already expected, most of that TAM growth, comes from the Cloud because realistically, Microsoft Surface devices will have it difficult to grow, as well as PC accessories, and XBOX. After all, these three markets have what I will call “an untouchable competitor”.
In the case of PCs, if a programmer wants to program for Apple devices, he needs to do it in an Apple device (like a Mac), therefore entering the PC market for programmers is nearly impossible.
Meanwhile, in the case of accessories, there are gamer brands, and Microsoft does not make gaming keyboards and mice.
Lastly, for Xbox, the only way Microsoft would be able to concentrate the market is if Nintendo Co., Ltd. (OTCPK:NTDOY) licenses its content to Microsoft, and that will never happen, since Nintendo knows that this exclusivity is its moat.
| Segments | TAM 2024 | TAM 2029 | CAGR % |
| Productivity & Business Processes | 59,270.0 | 120,520.0 | 15.25% |
| Intelligent Cloud | 282,200.0 | 1,060,000.0 | 15.66% |
| Xbox | 26,430.6 | 43,120.7 | |
| PC Accessories | 27,580.0 | 48,900.0 | 12.13% |
| Bing & Microsoft Edge | 231,123.5 | 289,454.2 | 4.21% |
| Microsoft Surface Devices | 127,500.0 | 147,386.5 | 3.69% |
| Total | 754,104.1 | 1,709,381.3 | 21.11% |
| CAGR% | 21.11% |
Valuation
I will value Microsoft through a DCF model. The first thing to be calculated will be the WACC, which I calculated with the already-known formula (and you can find a more detailed formula in the DCF model). The result was 11.35%.
Then, the D&A margin will be projected with a margin tied to revenue, which came out at 6.52%.
Lastly, the CapEx margin throughout the projection will remain constant at 16.72%.
| TABLE OF ASSUMPTIONS | |
| Equity Market Price | 3,317,645.22 |
| Debt Value | 106,229.00 |
| Cost of Debt | 2.60% |
| Tax Rate | 18.13% |
| 10y Treasury | 4.219% |
| Beta | 1.18 |
| Market Return | 10.50% |
| Cost of Equity | 11.63% |
| CapEx | 39,547.00 |
| Capex Margin | 16.72% |
| Net Income | 86,181.00 |
| Interest | 2,762.00 |
| Tax | 19,082.00 |
| D&A | 15,420.00 |
| EBITDA | 123,445.00 |
| D&A Margin | 6.52% |
| Revenue | 236,584.0 |
| R&D Expense Margin | 17.05% |
The first thing is to calculate revenues, and the first segment I will calculate is Activision-Blizzard. For 2023, the now-acquired company generated $8.7B in revenues. Now, the problem is that it’s impossible to predict which games are going to be a success and which not. Therefore, I will assume a conservative growth rate of 5.20%.
Then, the productivity & business Processes, and Intelligent Cloud will grow in line with its market, by 15.25% and 15.66% respectively.
| Revenue of Activision | Productivity & Business Processes | Intelligent Cloud | |
| 2023 | 8,706.0 | 69,275.0 | 87,902.3 |
| 2024 | 9,158.7 | 79,839.4 | 101,667.8 |
| 2025 | 9,635.0 | 92,015.0 | 117,589.0 |
| 2026 | 10,136.0 | 106,047.2 | 136,003.4 |
| 2027 | 10,663.1 | 122,219.4 | 157,301.5 |
| 2028 | 11,217.5 | 140,857.9 | 181,935.0 |
| 2029 | 11,800.8 | 162,338.7 | 210,426.0 |
| 2030 | 13,480.1 | 187,095.4 | 243,378.7 |
| 2031 | 15,398.3 | 215,627.4 | 281,491.8 |
| 2032 | 16,493.1 | 248,510.6 | 325,573.4 |
| 2033 | 17,665.8 | 286,408.5 | 376,558.2 |
| Growth Rate % | 5.20% | 15.25% | 15.66% |
Now, starting with the “More Personal Computing” segment I found that Xbox sales totaled $15.46B for 2023. This segment will also grow in line with its market, 8.50%.
On the other hand, Bing had a market share of around 10.53% in 2023 (which multiplied by the total amount of internet users in that year, means that Bing had around 543.13M users). After dividing the estimated $12.21B in revenue generated by Bing in 2023, I got that this division could be generating around $22.48 per user (which is lower than Google’s $36.29). Then, I multiply that $22.48 in revenues per user by the estimated internet users to get the revenue estimates. This also yields a growth rate of 4.59% for 2023-2029 which I will use to project revenue for 2030-2033.
| Internet Users | Bing’s Share | |
| 2024 | 5,254.00 | 553.25 |
| 2025 | 5,470.00 | 575.99 |
| 2026 | 5,690.00 | 599.16 |
| 2027 | 5,910.00 | 622.32 |
| 2028 | 6,350.00 | 668.66 |
| 2029 | 6,580.00 | 692.87 |
Meanwhile, it’s estimated that Microsoft Surface devices‘ sales tanked by 30% for 2023, which generated losses of up to $1.8B. By doing the rule of three, I found that Microsoft would have generated $6B in revenues for 2023. This segment will grow in line with the worldwide laptop market at 3.69%.
Lastly, Windows operating system revenue is speculated to have been around $24.61B in 2023. This was calculated via the rule of three, since in 2023, Windows revenue fell by $3.2B which was 13%. Therefore, I calculated the 100% with that information. This segment will grow in line with the worldwide PC market at 1.13%.
However, these calculations for 2023 say that Microsoft generated $63.35B for the “More Personal Computing” segment, which is substantially more than the reported $54.73B. Therefore, I will divide the $19.3B difference by the 5 subsegments, and then subtract the $3.806B result from each of them, so I can be able to correct the difference from the resulting segment result with the actual segment result.
| Xbox | PC Accessories | Bing & Microsoft Edge | Microsoft Surface Devices | Windows Os | |
| 2023 | 11,659.52 | 11,672.52 | 8,403.52 | 2,193.52 | 20,808.52 |
| 2024 | 12,650.58 | 13,088.40 | 12,436.97 | 2,274.46 | 21,043.66 |
| 2025 | 13,725.88 | 14,676.02 | 12,948.28 | 2,358.39 | 21,281.45 |
| 2026 | 14,892.58 | 16,456.22 | 13,469.05 | 2,445.41 | 21,521.93 |
| 2027 | 16,158.45 | 18,452.36 | 13,989.82 | 2,535.65 | 21,765.13 |
| 2028 | 17,531.92 | 20,690.63 | 15,031.36 | 2,629.21 | 22,011.07 |
| 2029 | 19,022.13 | 23,200.40 | 15,575.81 | 2,726.23 | 22,259.80 |
| 2030 | 20,639.01 | 26,014.61 | 17,791.43 | 2,826.83 | 22,511.33 |
| 2031 | 22,393.32 | 29,170.19 | 20,322.22 | 2,931.14 | 22,765.71 |
| 2032 | 24,296.76 | 32,708.53 | 23,213.01 | 3,039.30 | 23,022.97 |
| 2033 | 26,361.98 | 36,676.07 | 26,515.01 | 3,151.45 | 23,283.12 |
| Growth Rate % | 8.50% | 12.13% | 14.22% | 3.69% | 1.13% |
Then, I will calculate net income. The first step is gross income, which I will maintain the current gross margin of 69.89%. Meanwhile, general expenses will be tied to full-time employees. In 2023 general expenses were $27.19B, which was divided by the number of employees at that time of 221K. This resulted in an expense per employee of $120K (this is also an indication that Microsoft pays goods). Then I will assume that Microsoft will hire 19.33K new workers annually, in line with 2021-2023.
On the other hand, R&D expenses will be calculated with a margin tied to gross income, which currently stands at 17.05%.
Then it’s the time to calculate short & long-term debt and interest income & expenses. Short & long-term debt will have annual changes in line with their 2018-20222 performance of 26.4%, and -8.7% respectively. Meanwhile, marketable securities will be growing at a 4.2% annual rate.
Then, I found that in 2019, when interest rates were lower than now, Microsoft paid a 3.11% interest on debt and received a 2.26% annual return on its marketable securities.
However, for 2024TTM (when interest rates are high) Microsoft has paid a 2.60% interest on debt (yes, lower than when interest rates were lower) and has received a 5.67% return on marketable securities.
So with this information, I will assume an interest on a debt payment of 2.60% throughout the project. Then I will assume that for 2024 and 2027 Microsoft will receive a 5.67% return on its marketable securities and for the other years, it will receive 2.26%. This is because I am expecting that for 2024 and 2027, interest rates will increase again. If you want to read the full explanation, you can check the valuation section of my article on JPMorgan Chase & Co. (JPM).
Nevertheless, for 2030-2033, I will use the average marketable securities annual return of 3.96% (the average of 5.67% and 2.26%) since I have not made an interest rates projection for the years beyond 2029.
Author’s Calculations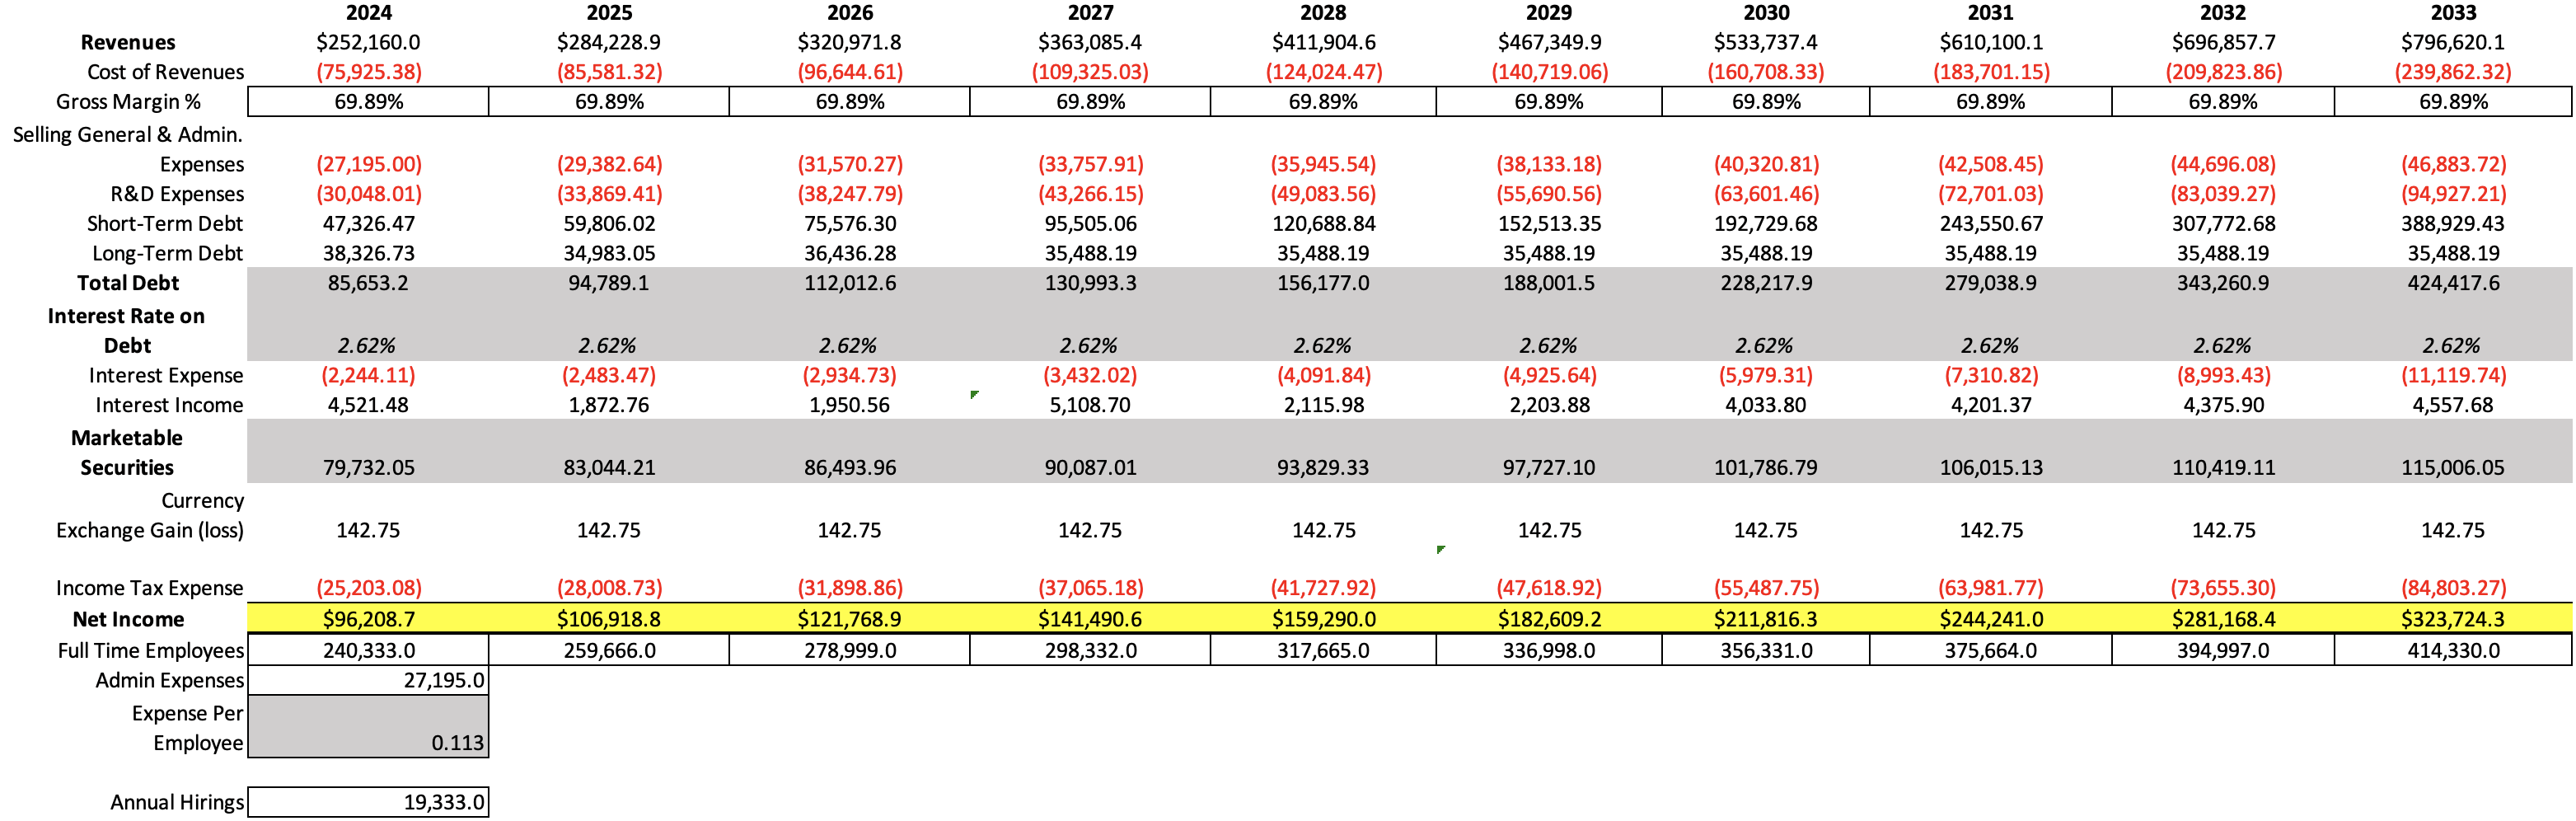
| Revenue | Net Income | Plus Taxes | Plus D&A | Plus Interest | |
| 2024 | $252,160.0 | $96,208.66 | $121,411.75 | $137,846.96 | $140,091.07 |
| 2025 | $284,228.9 | $106,918.84 | $134,927.57 | $151,362.78 | $153,846.25 |
| 2026 | $320,971.8 | $121,768.87 | $153,667.72 | $174,587.92 | $177,522.65 |
| 2027 | $363,085.4 | $141,490.60 | $178,555.78 | $202,220.85 | $205,652.88 |
| 2028 | $411,904.6 | $159,289.99 | $201,017.91 | $227,864.90 | $231,956.74 |
| 2029 | $467,349.9 | $182,609.20 | $230,228.11 | $260,688.91 | $265,614.55 |
| 2030 | $533,737.4 | $211,816.29 | $267,304.04 | $302,091.82 | $308,071.13 |
| 2031 | $610,100.1 | $244,241.04 | $308,222.81 | $347,987.73 | $355,298.55 |
| 2032 | $696,857.7 | $281,168.43 | $354,823.73 | $400,243.31 | $409,236.74 |
| 2033 | $796,620.1 | $323,724.30 | $408,527.57 | $460,449.44 | $471,569.18 |
| ^Final EBITA^ |
Then, I assume that current assets will grow at 1.72%, thus mirroring the performance during 2018-2022. Then, with this, I use the undiscounted cash flows highlighted in green and add the future equity value, which is composed of the future short & long-term debt, current assets, and marketable securities.
Lastly, the perpetuity growth rate in the model is 1.82%. This number was calculated by dividing the resulting free cash flow growth rate from the projection (25.07%) and dividing it by the difference between it and the WACC of 11.35% (25.07%/(25.07%-11.35%)=1.82%).
Author’s Calculations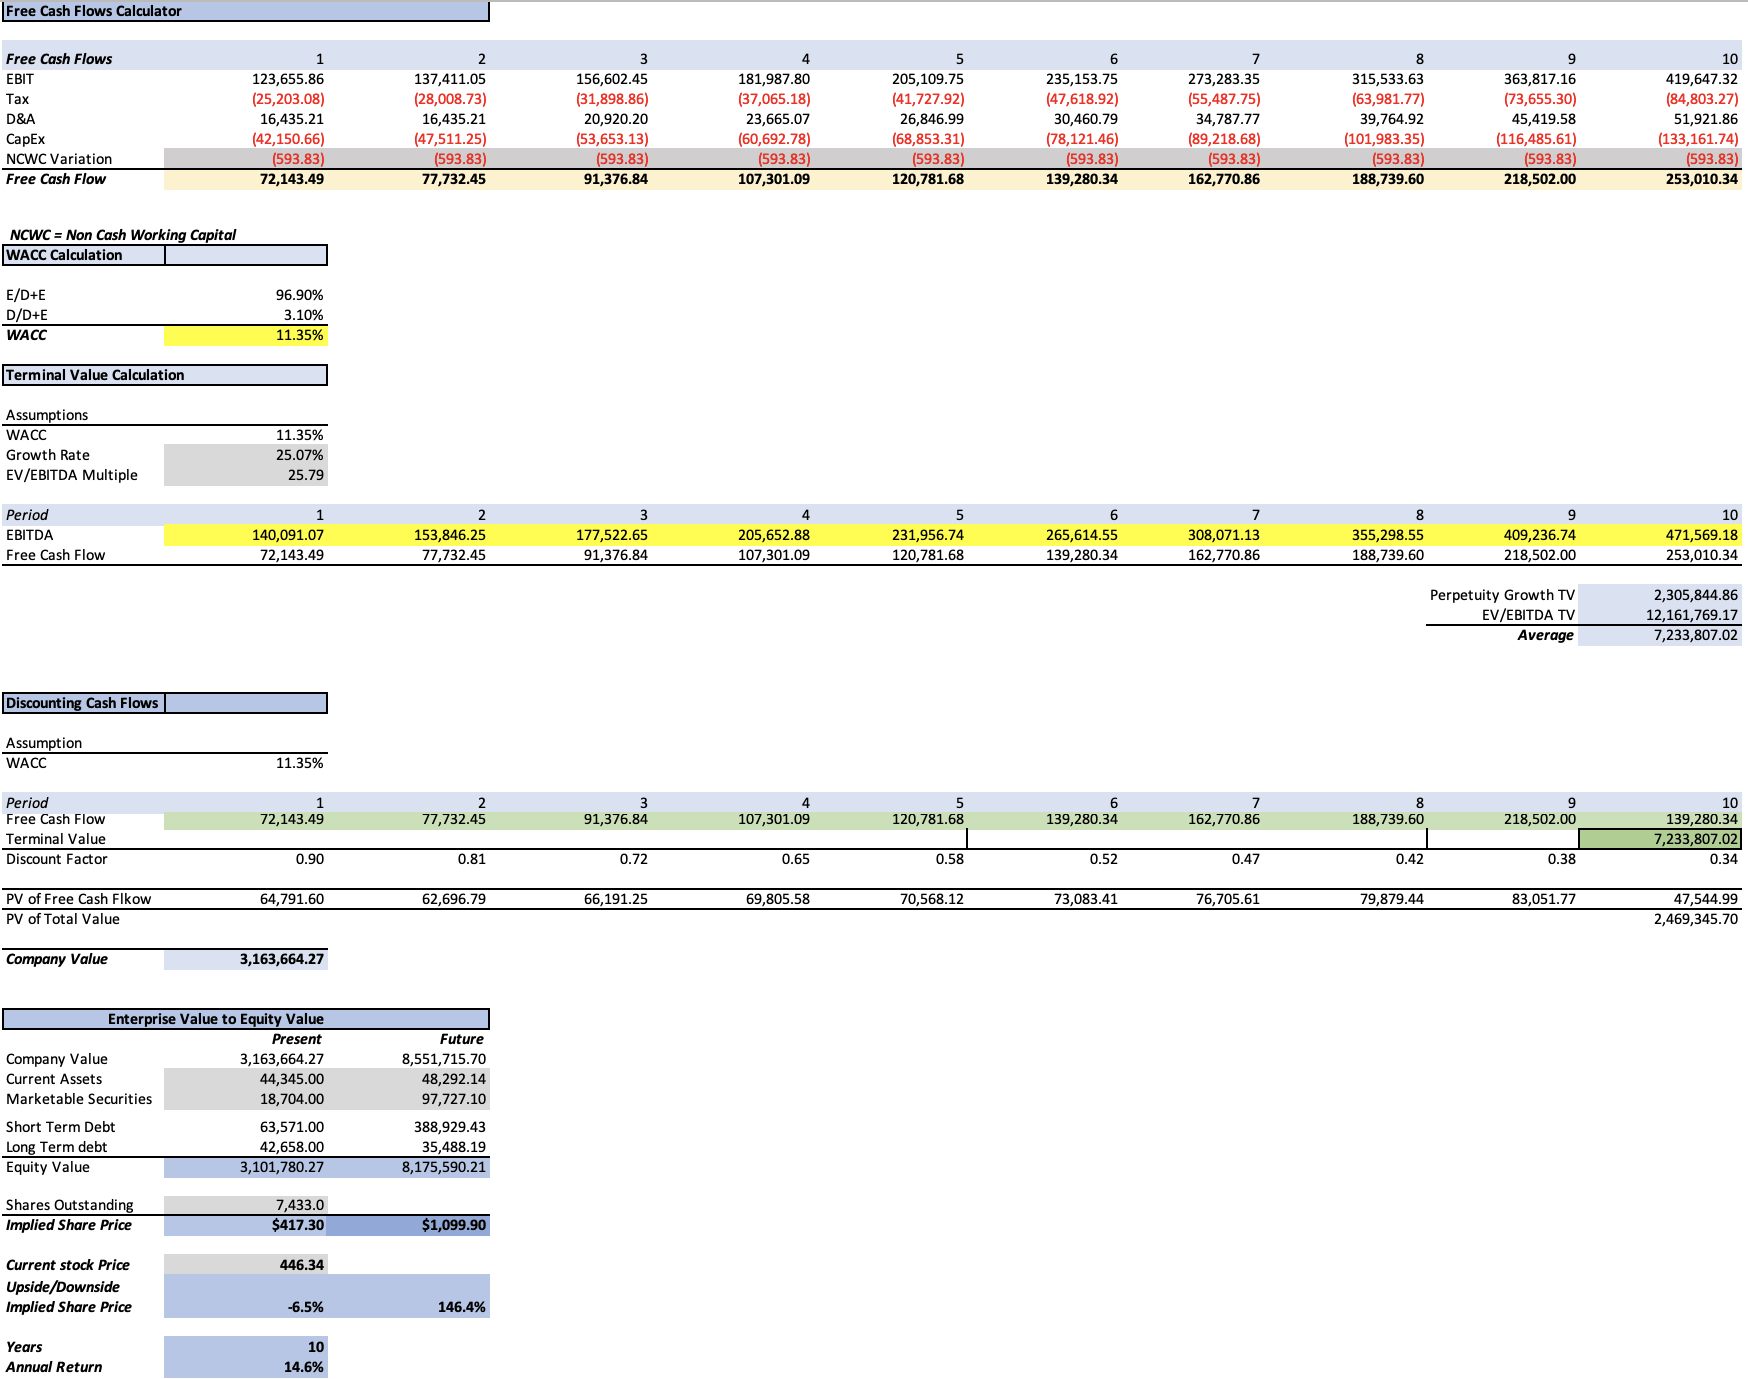
As you can see, the model suggests that the stock (today) should be trading at $417.30, which is 6.5% below the current stock price of $446.34. For the future, the model suggests that the stock could be trading at $1,099.90 in 2033. Yes, that’s a 146.4% upside from the current stock price, however when dividing that by the 10 years until the end of 2033, you get 14.6% annual returns.
What if Azure could grow at 20-25% annually?
If I increase Azure revenue growth from 15.66% to 20%, then the present fair price of Microsoft would be $484.22 (which is 8.5% above the current stock price), and a 2033 stock price target of $1,287.45 (which suggests 18.8% annual returns).
Then, If I increase that 20% revenue growth to 25%, the present fair price increases to $600.74 and the future price to $1,617.07. The first number indicates a 34.6% undervaluation of Microsoft’s stock, and the future price indicates 26.2% annual returns throughout 2033.
But, is that possible?
Since 2015, Intelligent Cloud has only surpassed the 30% growth rate in 2021. The average revenue growth rate of this segment has been 17.74%, which is slightly lower than the first 20% hypothetical scenario, and 7.26% lower than the second 25% hypothetical scenario.
| Annual Revenue of Microsoft’s Intelligent Cloud | Change % | |
| 2015 | 23684 | |
| 2016 | 25040 | 5.73% |
| 2017 | 27400 | 9.42% |
| 2018 | 32230 | 17.63% |
| 2019 | 38990 | 20.97% |
| 2020 | 44450 | 14.00% |
| 2021 | 60000 | 34.98% |
| 2022 | 74700 | 24.50% |
| 2023 | 86930 | 16.37% |
| 2024 TTM | 100850 | 16.01% |
It’s also worth noting that if I take out 2015 and 2016, the average Azure annual growth rate increases to 20.64%. However, the problem is that, in the past, when the cloud market was growing faster, Azure just achieved a growth rate of over 20% in 2019, 2021, and 2022. Thus, there’s more probability that Azure will grow below the required 20% (which would make Microsoft undervalued by a mere 8.5%)
Nevertheless, it’s good that even with the 15.66% originally used in this projection, the suggested annual return of 14.6% is still above the historic 10.50% annual returns of the market, which sets Microsoft to be an outperformer, even if the stock price decreased by 6.5% to adjust to my fair stock price estimate of $417.30.
Risks to Thesis
The main risk for my thesis is that Microsoft suddenly can achieve that high 30% growth rate that is required for a fair stock price of $496.21. This may be the reason why Microsoft’s stock has been increasing past my fair stock price estimates because the optimism on Azure has passed the logical boundary.
However, I think that there are more risks related to Microsoft than to my thesis, for example, Microsoft would have it very difficult to perform any big-scale acquisition such as the Activision one.
Then, there is also the risk that Microsoft is more prone to lose market share than to gain it, yes Azure has grown its market share by 4% since 2020. However, that will be very difficult for Windows, or Microsoft Office. At best, what Microsoft could do is to boost the sales of Surface devices, however, the problem with that is the differentiation factor. What happened with IBM is that its PCs were made by third-party components to which the competition could also access, and then its computers lost ground to cheaper alternatives, and the same thing happens today.
Evolution of My Fair Price Estimates
Since my first coverage on Microsoft, my fair price estimate has increased by 12.29%. Concerning my previous coverage, the reason for the increase from $397.49 to the present $417.30, the model I did in this article, covers 10 years, and not 6 as the previous one did. The main effect is that the total amount of cash flows increases in the model, which ultimately leads to an increased fair stock price.
Author’s Calculations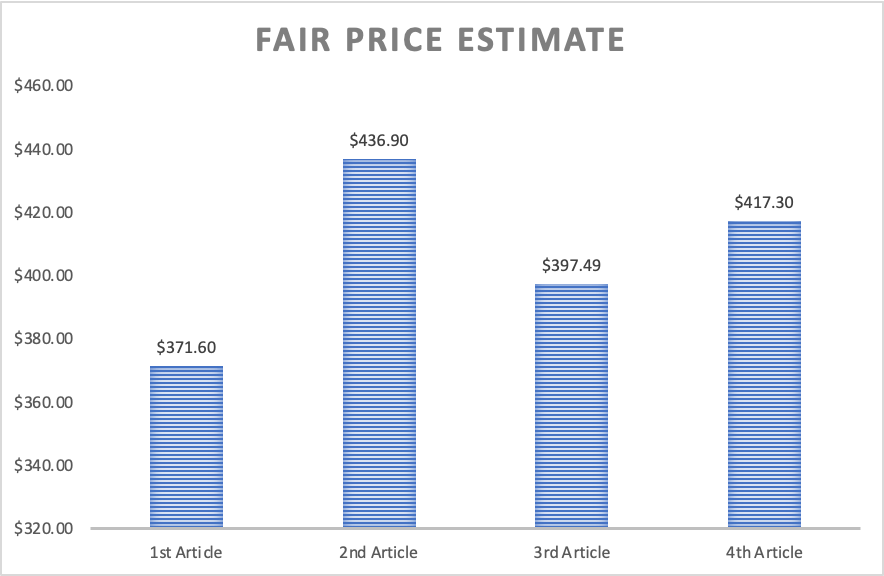
Conclusion
In conclusion, Microsoft continues to be overvalued, however, Microsoft’s current valuation (despite a 6.5% overvaluation) is a good point to enter (in my opinion) and wait for Azure to deliver higher returns than the 15.66% used for my estimates. The suggested annual returns in my base model are 14.6% (which already sets Microsoft as an outperformer against the market’s 10.50% annual return average).
Lastly, I assigned a near-term target for Microsoft’s stock at $417.30, which is 6.5% below the current stock price of $446.34, and a 2033 stock price target at $1,099.90, which implies a 14.6% annual return throughout the 10 years.
Analyst’s Disclosure: I/we have no stock, option or similar derivative position in any of the companies mentioned, and no plans to initiate any such positions within the next 72 hours. I wrote this article myself, and it expresses my own opinions. I am not receiving compensation for it (other than from Seeking Alpha). I have no business relationship with any company whose stock is mentioned in this article.
Seeking Alpha’s Disclosure: Past performance is no guarantee of future results. No recommendation or advice is being given as to whether any investment is suitable for a particular investor. Any views or opinions expressed above may not reflect those of Seeking Alpha as a whole. Seeking Alpha is not a licensed securities dealer, broker or US investment adviser or investment bank. Our analysts are third party authors that include both professional investors and individual investors who may not be licensed or certified by any institute or regulatory body.