Summary:
- Microsoft’s Q3 revenue growth exceeded expectations, with a 13% increase compared to the same quarter last year – a significant acceleration in growth rates.
- The company achieved all-time high EBITDA margins and strong TTM cash flow margins too. That’s very difficult to do while also accelerating revenue growth.
- Valuation multiples aren’t stretched, and we believe the chart to be bullish.
- We continue to rate the name at Hold. That said, for the patient, it’s likely that solid returns can accrue over the long term if buying at these levels.

jetcityimage
DISCLAIMER: This note is intended for US recipients only and, in particular, is not directed at, nor intended to be relied upon by any UK recipients. Any information or analysis in this note is not an offer to sell or the solicitation of an offer to buy any securities. Nothing in this note is intended to be investment advice and nor should it be relied upon to make investment decisions. Cestrian Capital Research, Inc., its employees, agents or affiliates, including the author of this note, or related persons, may have a position in any stocks, security, or financial instrument referenced in this note. Any opinions, analyses, or probabilities expressed in this note are those of the author as of the note’s date of publication and are subject to change without notice. Companies referenced in this note or their employees or affiliates may be customers of Cestrian Capital Research, Inc. Cestrian Capital Research, Inc. values both its independence and transparency and does not believe that this presents a material potential conflict of interest or impacts the content of its research or publications.
If Market Number Go Up, Buy Microsoft
No-one believes that the market right now is in the early stages of a long bull market. The scars from 2022 are too recent for most who are naturally bullish and were burned last year; and the victories of the same are too recent for the naturally bearish. As a result, investor participation in the big bull market of 2023 year to date (the Nasdaq-100 is up 34% year-to-date on a total return basis) has been relatively low. There appears to be an incessant debate about how many stocks are up and how many are not – as if it matters. The S&P 500 is +11% YTD on a total return basis – whether that’s all from a handful of names or not is irrelevant for the most basic investment strategy of all, which is buy and hold the S&P 500 and re-invest the dividends. Anyone following the Buffet playbook for easy-life investing has had a good year thus far. Anyone allowing their own recency bias to get in the way of making money? Less so. (And don’t even talk to us about the what-about-the-dot-com-crash crowd.)
The context of Microsoft earnings today is that we believe the market is poised to keep climbing. We laid out our views on this here on Seeking Alpha recently, in our article “The Long Bull Market To Come.” Do read it if you have a moment.
Now for the matter at hand.
Microsoft Stock – Fundamental Analysis
Let’s take a look at the numbers that Microsoft Corporation (NASDAQ:MSFT) just printed.

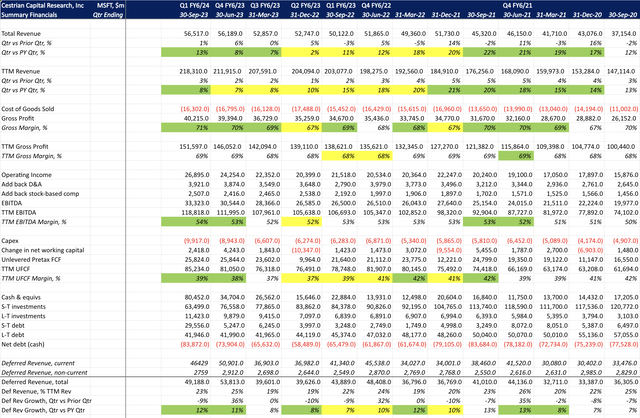
MSFT Fundamentals I (Company SEC filings, YCharts.com, Cestrian Analysis)
Note, until the 10-Q is published we won’t have remaining performance obligation numbers. We’ll update in the comments below once this is available. Here’s how RPO was shaping up through last quarter.

MSFT Fundamentals II (Company SEC Filings, YCharts.com, Cestrian Analysis)
A few highlights:
- Revenue growth of 13% vs. the same quarter last year, a significant acceleration vs. last quarter and way in excess of the guide (which was for 8%-plus growth).
- Trailing Twelve Month (“TTM”) revenue growth of 8%, a slight improvement on last quarter – actually the first time TTM revenue growth has increased since the December 2021 quarter – it has fallen every quarter from then to now.
- TTM EBITDA margins – note, we add back stock-based compensation to calculate EBITDA – of 54%, an all-time high (which is quite a feat whilst also growing faster than in recent times).
- TTM unlevered pre-tax free cash flow (defined as TTM EBITDA minus capex minus change in working capital) margins of 39%, not an all-time high but certainly at the upper end of the company’s historic range.
- Net cash of $84bn (now a midsized country – not just a small country!).
- As noted, we don’t yet have remaining performance obligation / RPO (that’s the total order book value including amounts invoiced and not yet invoiced).
- Deferred revenue (that’s the already-invoiced portion of RPO) of $49bn, growing at 12% YoY, the fastest such growth since the March 2022 quarter.
This is a very strong quarter, in our view.
Microsoft Stock Valuation Analysis

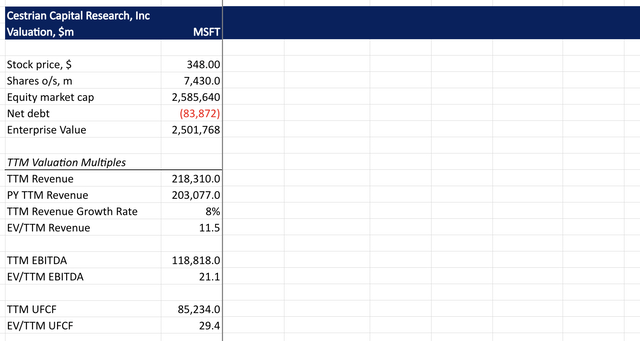
MSFT Valuation Analysis (Company SEC Filings, YCharts.com, Cestrian Analysis)
Those are unchallenging multiples at which to buy or own the stock in our opinion.
Microsoft Stock Price Outlook
Let’s now turn to the chart, for this is where the fun begins (if, like us, you don’t get out much, this is what counts as fun anyway).

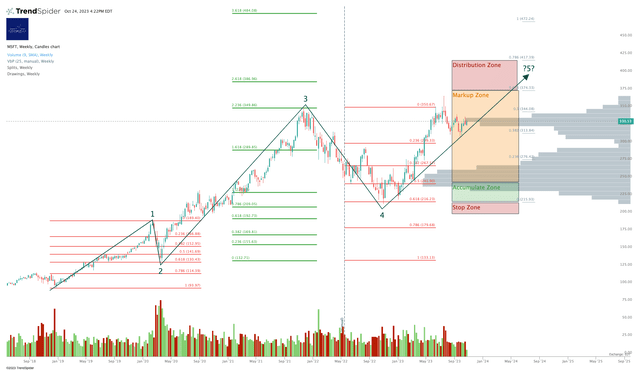
MSFT Stock Chart (TrendSpider, Cestrian Analysis)
Now, we believe this chart to be overly cautious. It’s a standard Elliott Wave / Fibonacci chart and it’s the chart you get if you use that system and start the chart at the December 2018 lows. This is a very sensible place to start, because it was a time when monetary policy switched from tightening to loosening, most stocks bottomed and reversed up quickly, and the respect for typical wave / Fibonacci patterns from there on in is pretty much perfect for MSFT stock. If the chart is correct it suggests that the stock “should” (yes, we know, but you would be surprised how often this works) terminate within that red “Distribution Zone” – call it $375-420/share – which is between the .618 and the .786 Fibonacci extension of Waves 1-3 combined, placed at the Wave 4 low.
But if that happens it means that market big wigs would be dumping MSFT stock like it was going out of fashion – because it would be going out of fashion – at a level not 20% away from here. And it’s Microsoft – so that would mean that the S&P 500 and the Nasdaq would be getting dumped around 20%-plus from here.
Now that could happen, and so it’s best for now to keep this chart as our base case. But if you ask us what we really think? Well, read that note above. It’s called The Long Bull Market To Come, so you can probably guess. And if the market turns out to be as bullish as we think, then so will Microsoft, and we should have started the chart at the 2020 COVID lows (also a sensible place to start by the way, for reasons we can bore you with another time), in which case Microsoft would be in a Wave 3 up and it can go a lot higher before turning down once more, and then putting in a final flourish higher.
Deciding that isn’t today’s problem. The stock price will tell us soon enough. For now we continue to rate Microsoft at Hold, we continue to own the name in staff personal accounts, and we’re very happy shareholders indeed following today’s print.
Cestrian Capital Research, Inc – 24 October 2023.
Analyst’s Disclosure: I/we have a beneficial long position in the shares of MSFT, UPRO, TQQQ either through stock ownership, options, or other derivatives.
Business relationship disclosure: See disclaimer text at the top of this article.
Cestrian Capital Research, Inc staff personal accounts hold long positions in, inter alia, MSFT, UPRO, TQQQ
Seeking Alpha’s Disclosure: Past performance is no guarantee of future results. No recommendation or advice is being given as to whether any investment is suitable for a particular investor. Any views or opinions expressed above may not reflect those of Seeking Alpha as a whole. Seeking Alpha is not a licensed securities dealer, broker or US investment adviser or investment bank. Our analysts are third party authors that include both professional investors and individual investors who may not be licensed or certified by any institute or regulatory body.
GET INSTITUTIONAL GRADE BUYSIDE RESEARCH FROM CESTRIAN CAPITAL RESEARCH
We provide investment research prepared to institutional investor quality, presented in a way anyone can understand. Our work allows you to make sense of company fundamentals and stock technicals without resort to jargon or esoterica. We offer Free, Basic and Full membership tiers in our “Growth Investor Pro”. Join us! Click HERE to learn more.

