Summary:
- Some members asked if it is time to buy Microsoft as its P/E and P/S multiples apparently signal a discount.
- A closer look shows there is no obvious discount yet. But a sum of the parts (SOTP) analysis shows that it is close to a fair valuation now.
- Actually, two separate SOTP analyses were performed, one based on revenues and one on earnings.
- The results from both approaches are remarkably consistent, confirming the assessment and also reminding me of the wisdom to always go back to basics when in doubt.
David Ramos
Thesis
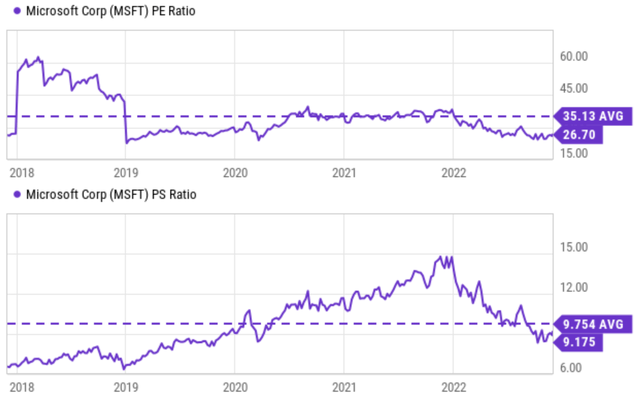
Some members from our market service asked if now is the time to start buying Microsoft (NASDAQ:MSFT) as it appears to be at a discounted valuation now as you can see from the following chart. We have been cautioning our readers that the stock has been extremely overvalued for a long time. And recently, due to the substantial corrections, its PE and PS ratios are now both below their historical averages as seen.
Thus, this article takes a closer look at things. And my conclusion is, unfortunately, that there is no obvious discount yet. The above PE and PS discounts relative to the historical averages are largely the result of the extreme overvaluation in recent years (e.g., PS multiple peaked at 15x). Such extreme valuations have biased the averages.
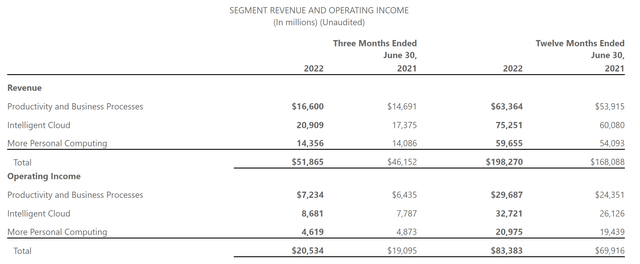
In the remainder of this article, I will examine its segments more closely (as summarized in the chart below). Note that its FY calendar is shifted by one quarter. The chart below shows its most recent CY Q3 results (i.e., its FY Q4 results). And from here on, I will refer to the calendar quarter consistently. Based on such examination, two simple sums of the parts (SOTP) analyses will be performed: one based on the segment revenues and one on earnings. The results from both approaches are remarkably consistent, both showing its current market price is within ~3% of its fair value.
Microsoft: Productivity and Business Processes
Let’s first look at its Productivity and Business Processes segment. The segment suffered a YoY decline in Q3 on both lines. To wit, revenues declined by 11.5% to $16.6B and operating income declined by 11.0% to $7.23B. The main cause is the weakening of the global PC demand. However, on a TTM basis, the segment posted healthy growth rates on both lines. On a TTM basis, the total revenue for this segment reached $63.3B, translating into an annual growth rate of 17.5%. And the operating income reached $29.6B, translating into an even higher annual growth rate of 21.9%.
Source: Author based on Seeking Alpha data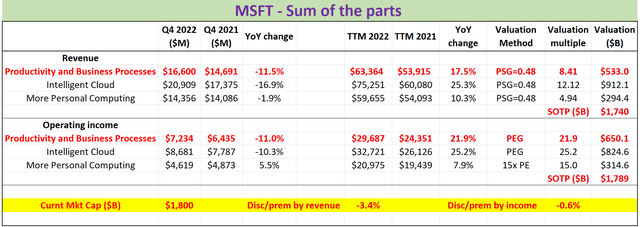
Now, for the SOTP analyses in the reminder of this article, I will value its parts based on the following assumptions:
- For the revenues, I will use a PSG ratio (the price-sales-growth ratio) as the main valuation metric. The PSG is a simple extension of Peter Lynch’s price-earnings-growth (“PEG”) ratio. Furthermore, I will assume MSFT to have the same PSG ratio as the SP 500 given its scale and large weight in the index. as of this writing, the SP500 is valued at a P/S ratio of 2.41x. The medium growth rate for SP500 revenues is about 5.0% in the past few years. Therefore, the PSG ratio for the SP500 is about 0.48, which is the multiple that I will apply for MSFT.
- For the earnings, I will just use Peter Lynch’s PEG ratio of 1x for segments showing high growth and use 15x PE for segments with lower than 10% growth rates.
Under these assumptions, you can see that its Productivity and Business Processes segment is worth 8.41x PS multiple or $533B based on revenues. Based on earnings, it is worth 21.9x PE or $650B.
Microsoft: Intelligent cloud
The next segment, also the large segment, is the intelligent cloud segment. This is not only in the large segment but also in the most exciting segment. And many investors expect it to be the driver of future growth. As you can see from the chart below, indeed, the segment has been growing much more quickly than the other segments over the past year. To wit, on a TTM basis, the segment revenue reached $75.2B, translating into an annual growth rate of 25.3%. And its operating income reached $26.1B, translating into a similar annual growth rate of 25.2%. However, note that as of now, the more “boring” Productivity and Business Processes (“PBP”) is still the cash cow in terms of margins. The operating margin for the PBP is about 46.8%, more than 200 basis points above the intelligent cloud segment.
Under the valuation assumptions made above, the cloud segment is worth 12.1x PS multiple or $912B based on revenues. Based on earnings, it is worth 25.2x PE or $826B.
Source: Author based on Seeking Alpha data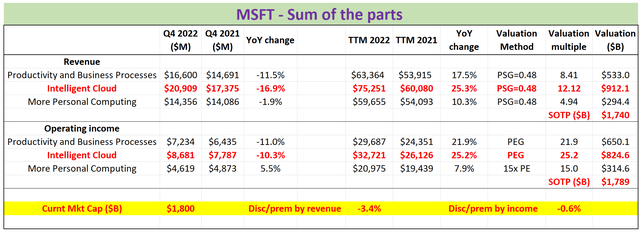
Microsoft: More Personal Computing
finally, we come to the smallest segment: More Personal Computing. This segment is not only the smallest but also has the lowest operating margin among all the segments. its operating margin in recent years hovers around 35%, more than a whole 10% below the PBP segment mentioned above. This segment also is the slowest-growing segment as you can see from the chart below. Although, its growth is still a robust 10.3% on the top line and 7.9% in terms of operating income over the past twelve months.
As a result, of its lower margin and lower growth rate, it’s only fitting to assign a lower valuation multiple. Under the PSG and PE assumptions made above, this segment is worth 4.94x PS multiple or $294B based on revenues. Based on operating earnings, it is worth 15x PE or $314B.
Source: Author based on Seeking Alpha data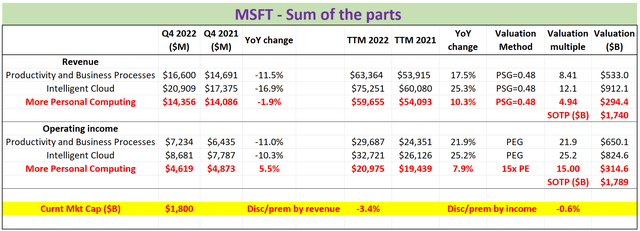
Final results and final thoughts
Now we sum up all the parts. And as you can see, based on revenue, the total worth of the parts is $1.74 trillion. And based on operating income, the total worth of the parts is $1.79 trillion. Its current market cap is $1.80 trillion as of this writing. Therefore, its current price represents a small overvaluation: a 3.4% premium based on revenue, or a 0.6% premium based on operating income. The results from both approaches are remarkably consistent (within 3% of each other), confirming the assessment and also reminding me of the wisdom to always go back to basics when in doubt.
To conclude, the bad news for potential MSFT investors is that I do not see a discount yet. The apparent PE and PS discounts shown in the first chart are largely caused by the extreme overvaluation in recent years, which biased its average valuation metrics. Although the good news is that MSFT’s valuation is close to fair valuation after recent market corrections. I see most of the valuation risks are gone by now. And for long-term investors, it is always better to buy a great business at a fair price than a fair business at a great price.
Disclosure: I/we have no stock, option or similar derivative position in any of the companies mentioned, and no plans to initiate any such positions within the next 72 hours. I wrote this article myself, and it expresses my own opinions. I am not receiving compensation for it (other than from Seeking Alpha). I have no business relationship with any company whose stock is mentioned in this article.
As you can tell, our core style is to provide actionable and unambiguous ideas from our independent research. If your share this investment style, check out Envision Early Retirement. It provides at least 1x in-depth articles per week on such ideas.
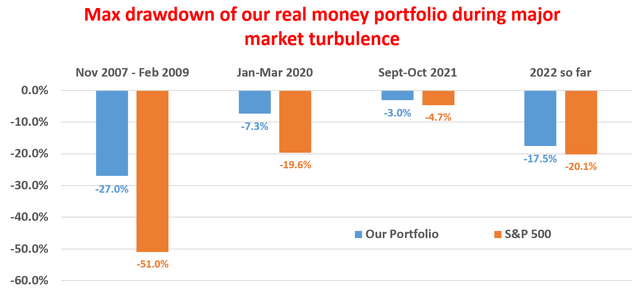
We have helped our members not only to beat S&P 500 but also avoid heavy drawdowns despite the extreme volatilities in BOTH the equity AND bond market.
Join for a 100% Risk-Free trial and see if our proven method can help you too.
