Summary:
- Microsoft’s stock has surged over 25% since mid-last year, but now presents an unfavorable risk/reward setup, making it a sell recommendation.
- Daily technical analysis shows mixed signals, with near-term bullishness but significant resistance levels; intermediate and long-term outlooks are net bearish.
- Fundamentals reveal resilient but unremarkable growth, with a high P/E ratio suggesting overvaluation, while the P/S ratio indicates fairer valuation.
- Despite recent earnings beating expectations, Microsoft’s growth prospects do not justify its current valuation, prompting a sell recommendation.

Yuriy Komarov
Thesis
In the middle of last year, I initiated a buy rating on Microsoft Corporation (NASDAQ:MSFT) and the stock has surged over 25% since that article. Today, I believe the stock is becoming dead money as it has entered into an unfavourable risk/reward setup. Investors should consider locking in gains or selling. In my technical analysis below, I have determined that while the near-term outlook is still net positive, the stock has become net bearish in the intermediate and long-term time frames. As for the fundamentals, while growth remains resilient, it is far from extraordinary. I determine that the stock is overvalued in terms of the P/E but more reasonable in terms of the P/S making the stock modestly overvalued overall. Therefore, considering the mixed technicals and the valuation of the stock, I now believe investors should consider selling Microsoft stock.
Daily Analysis
Chart Analysis
Yahoo Finance
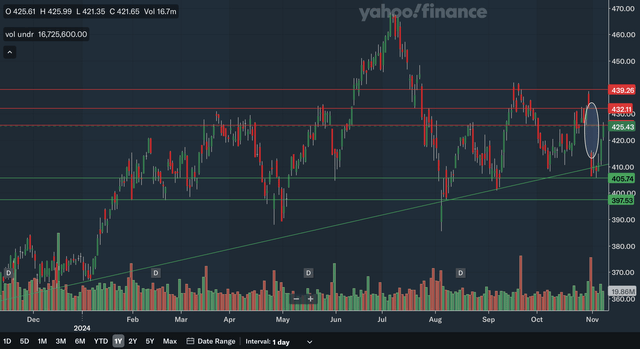
The daily chart is getting quite mixed for Microsoft as heavy overhead resistance may continue to weigh on the stock despite it still being in a near-term uptrend. The nearest area of resistance would be at 425, which is the current price of the stock. This price was resistance earlier this year and was also resistance in August. The next level of resistance would be in the low 430s, as that level is a downside gap and was also significant resistance in May. Lastly, we also have resistance in the high 430s, since that area was heavy resistance in September and late October. As for support, the closest line would be the uptrend line that just moved above 410 and slowly rising. We also have support at around 405 as that area was support in late May and just very recently. The high 390s is the last identified support zone, as that area provided support at least four times in the past year, making it a very important level. Overall, I would say that the daily chart is a net positive one, but with plenty of resistance on top, the stock could have trouble advancing.
Moving Average Analysis
Yahoo Finance
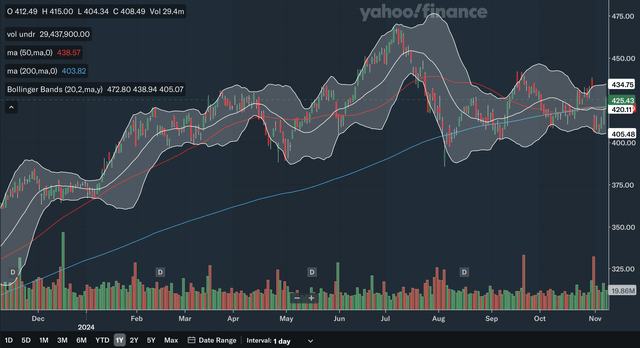
The 50-day SMA and the 200-day SMA have been inseparable for the past month. The 50-day SMA was on top for the duration of the past year until the recent month. This is a major red flag that the near-term uptrend is coming to an end, as the bullish momentum has generally ended. There has not been a conclusive death cross yet, but the weakness of the 50-day SMA is already a bearish signal. The stock currently trades a very modest amount above the SMAs. For the Bollinger Bands, the stock recently broke below the 20-day midline before regaining that level. The breakdown beneath the line was bearish as that line acts as support in an uptrend but the stock’s regaining of the line at least partially offsets this negative signal. In my view, these MAs show potentially concerning signs for shorter term investors, as bearish signals are beginning to appear.
Indicator Analysis
Yahoo Finance
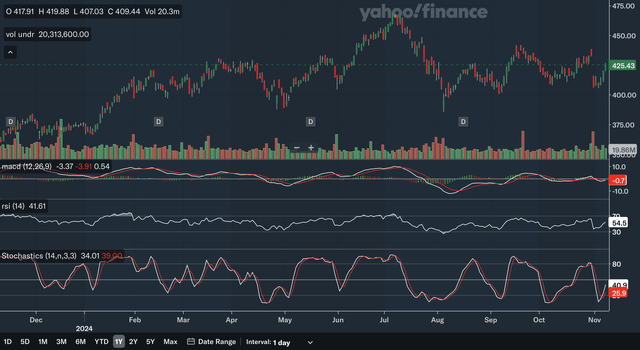
The MACD and its signal line are virtually at the same level currently and so a bullish crossover could be imminent. The gap between the two lines have been quite small for the last month or so, showing that there has been a relatively equal battle between the bulls and bears. For the RSI, it is currently at 54.5 after nearing the oversold 30 zone in late October. The regaining of the critical 50 level shows the bulls are back in relative control in the near term. The RSI shows that the July peak in the stock had negative divergence as the RSI did not reach levels seen in late January. Therefore, the pullback is not too surprising. Lastly, for the stochastics, the %K crossed above the %D within the oversold 20 zone earlier this month, a highly positive signal. The gap between the two lines has also quickly widened, showing increased bullish momentum. From my analysis, these daily indicators show a net positive technical situation for Microsoft as there were positive indications in all three indicators.
Takeaway
The daily analysis was a bit mixed but was overall positive, showing that the near-term technical outlook is slightly bullish for the stock. The chart shows that we are still in an uptrend with some resistance on top, while the MAs show some red flags. As for the indicators, as discussed above, they were mainly positive in the near term.
Weekly Analysis
Chart Analysis
Yahoo Finance
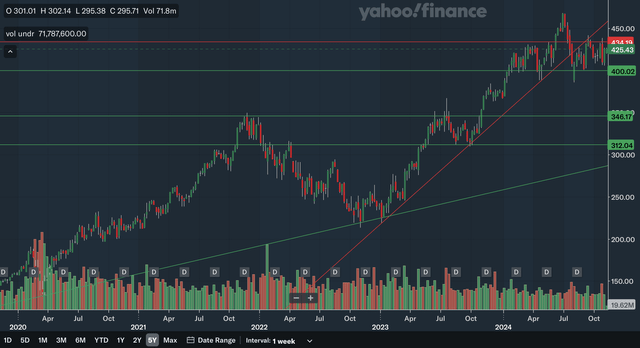
The weekly chart is also a quite mixed one for Microsoft. The stock has broken below a nearer term uptrend line earlier in the year, showing that the strong gains for the stock may be over. The stock remains in a longer-term uptrend that dates back to 2020, but the support of this uptrend line is miles below the stock. For resistance, the nearest area would be in the mid-430s, as that area has been general resistance YTD. The other resistance line would be the former uptrend line, but it is quickly sloping upward, and so the stock may still advance even if it were to remain below this line. For support, the nearest area would be at the psychologically important 400 level, as that level has been general support YTD. Moving down, we also have support in the mid-340s as that area was major resistance back in 2021 and in 2023. The low 310s could also be support as it was resistance back in 2022 but was strong support in 2023. Lastly, the longer-term uptrend line provides distant support as it is still below 300. Overall, I would say the weekly chart is a mixed one, as the breakdown from the nearer term uptrend line may mean the end of the strong gains for the stock.
Moving Average Analysis
Yahoo Finance
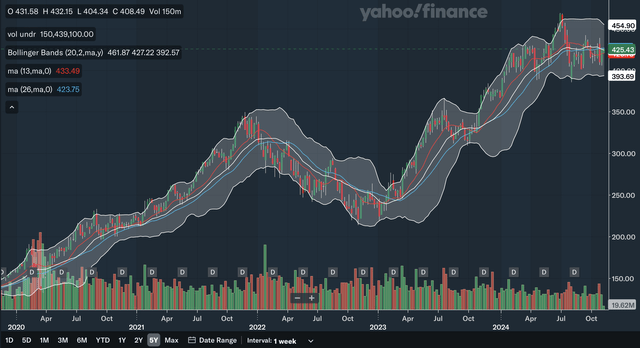
The 13-week SMA crossed below the 26-week SMA earlier in the year, a bearish signal. The only positive here is that the gap between the SMAs has remained relatively small, showing that the bearish momentum is not accelerating. The stock is currently trading right at the 26-week SMA, and whether it can cross above it may be of high consequence for the stock. For the Bollinger Bands, the stock has generally been below the 20-week midline since it broke below it during the middle of the year. Being below the midline for an extended period shows that the stock’s nearer term intermediate uptrend has ended. The midline has seen resistance multiple times in the past months and with the stock currently trading very near this line, it may experience resistance there once again. From my analysis, the MAs paint a rather worrying intermediate term picture for Microsoft, as there are many bearish signals here.
Indicator Analysis
Yahoo Finance
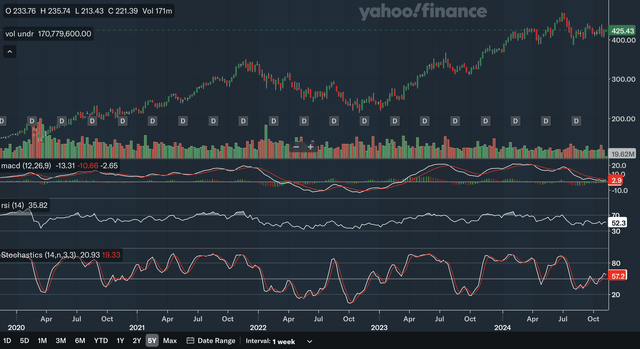
The MACD remains below the signal line after a bearish crossover during the middle of the year. On the positive side, the gap between the line has narrowed, showing a decrease in bearish momentum in past months. For the RSI, it is currently at 52.3 after regaining the 50 level recently. Although regaining the important 50 level is a positive, as you can see, the RSI has been fluctuating above and below the 50 level for the past months, showing that there is an ongoing battle between the bulls and the bears. Lastly, for the stochastics, the %K is still above the %D which is a positive, but the worsening trajectory of the %K line may mean that a bearish crossover may occur soon. Overall, in my view, these weekly indicators are net bearish as there are multiple signs of weakness with the stock.
Takeaway
I would say the weekly analysis has shown a net negative intermediate term outlook for Microsoft stock, as there have been many signs of weakness in the stock. The charts show a breakdown from an important uptrend, while the MAs had a bearish crossover earlier in the year. As discussed above, the indicators are also net negative.
Monthly Analysis
Chart Analysis
Yahoo Finance
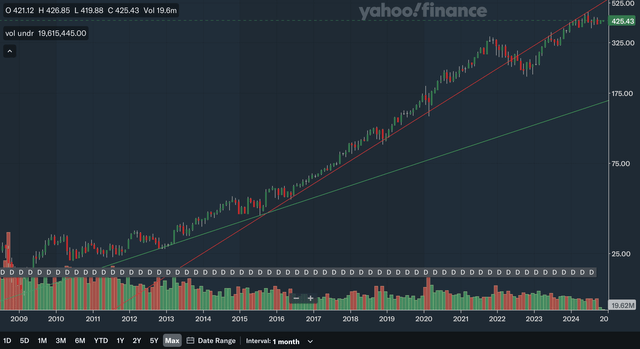
Note that the above chart is in a logarithmic scale to better reflect Microsoft’s long-term trends. The stock remains in a longer-term uptrend that dates all the way back to 2009, but the support of the uptrend line is extremely distant as it is still below 175. A nearer term uptrend line that dates back to 2015 was broken in 2022 and since then, it has become resistance for the stock. Despite the massive rally in the past two years, the stock actually remains below this line. While the stock can continue to advance even if it remains under this line since this uptrend line is sloping up quite quickly, the stock has relatively minimal long-term support beneath, which could be a problem if the stock slumps. With the support of the longer-term uptrend line miles below, the stock has the potential to drop significantly. However, the stock thus far has stayed quite close to the former uptrend line and also still has the chance to move back above it in the near future. Therefore, I believe the monthly chart is still a satisfactory one as the stock is still showing strength despite being below the former nearer term uptrend line.
Moving Average Analysis
Yahoo Finance
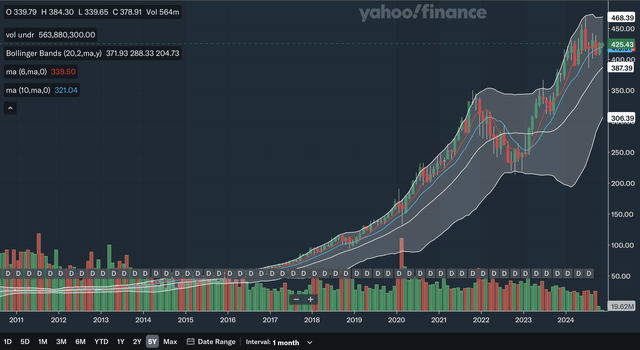
The 6-month SMA is currently still above the 10-month SMA by a very slim margin, but the 6-month SMA’s trajectory is worsening, making a bearish crossover very likely in the near future. The previous crossover was a bullish one that occurred back in early 2023 and the stock has surged since that signal. The stock currently trades right at the SMAs. For the Bollinger Bands, the stock has remained above the 20-month midline since early 2023, showing that we are in a sustained uptrend. Despite the pullback in recent months, the stock remains a healthy margin above the midline, showing that the stock is still in an uptrend. The stock was consistently at the upper band from late 2023 to mid-2024, showing it had relentless bullish momentum but was also a bit overbought and so a pullback during the middle of the year was not too surprising. As a whole, in my view, these MAs show a mixed picture as there are bearish indications from the SMAs, but the stock still remains above the midline of the Bollinger Bands.
Indicator Analysis
Yahoo Finance
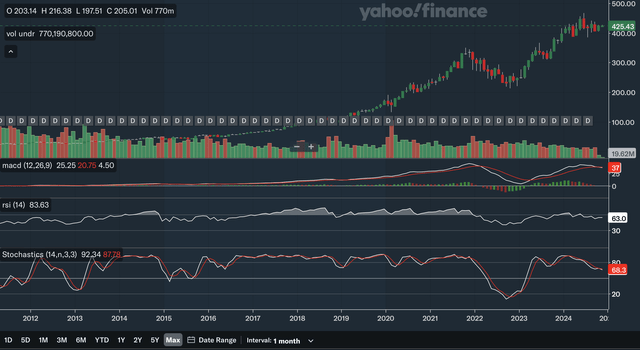
The MACD just crossed below the signal line recently after being above it for an extended period of time, a highly bearish signal. The last bullish crossover occurred in early 2023 and the stock has surged since then. The MACD also shows a bit of negative divergence with the stock’s all-time high this year. While the stock hit an all-time high, the MACD has remained below levels seen in late 2021. There is also negative divergence in the RSI. The RSI barely made it past the 70 mark during the stock’s major bull run that started in late 2022, while the RSI was consistently above 70 from 2017 to late 2021. On the brighter side, the RSI is currently at 63 and has been above the critical 50 level since the start of 2023, showing that at least the bulls have been in relative control. Lastly, for the stochastics, the %K recently failed to break above the %D and its trajectory is worsening again, a bearish signal. Overall, these monthly indicators show a worrying long-term outlook for Microsoft, as there are both immediate bearish signals as well as longer-term divergence.
Takeaway
The monthly analysis shows a net bearish long-term technical outlook for Microsoft stock, as there are many concerning signs that investors should not ignore. The charts show that the stock remains below a former uptrend line, while the MAs are very near a bearish crossover. Lastly, as discussed above, the indicators show many red flags for the stock.
Fundamentals & Valuation
Earnings
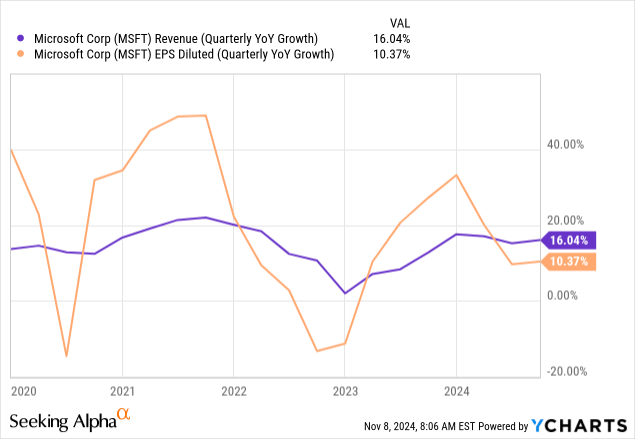
In late October, Microsoft released their FY25 Q1 earnings and showed resilient results. They reported revenues of $65.6 billion, a 16% increase YoY. Revenues in their Productivity and Business Processes segment increased 12% YoY, while there was a 20% increase in Intelligent Cloud. Lastly, More Personal Computing had a 17% YoY increase in revenues. For EPS, they reported a diluted figure of $3.30, up a modest 10% YoY. Both revenues and EPS beat expectations, as revenue beat by $1.03 billion and EPS beat by $0.19. Other highlights include Microsoft returning $9.0 billion to shareholders with dividends and share repurchases. Currently, the stock’s yield is at 0.78%. As you can see in the chart above, growth rates are resilient, but they are not at impressive levels. Current EPS growth is only average, while revenue growth may be slightly better than average.
Valuation
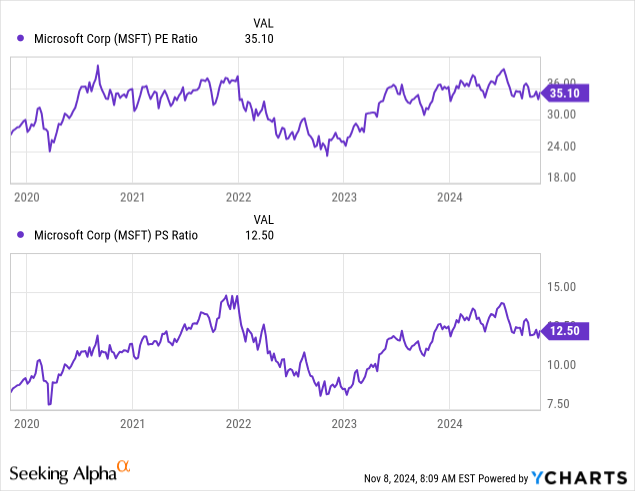
The P/E and P/S ratios are currently quite high after rebounding from the late 2022 trough. The ratios remain below their 5-year highs, however. The P/E ratio is currently at 35 after being under 24 in late 2022 while the P/S ratio is at 12.5 after being under 8.75 also in late 2022. These ratios mirror the revenue and EPS growth movements quite well, as shown above. I believe the P/E ratio shows that the stock is moderately overvalued, while the P/S ratio shows it is more fairly valued. The P/E ratio is currently quite high historically, while EPS growth is only at average levels. In addition, the current P/E is at levels similar to early 2021 when the EPS growth rate was significantly higher. The P/S ratio is a bit more reasonable since a slightly over average valuation multiple level is met with a slightly above average revenue growth rate, making the stock seem more fairly valued at current levels. Overall, I would conclude that the stock is currently modestly overvalued, with the P/E suggesting overvaluation and P/S suggesting quite fair valuation levels.
Conclusion
While the near-term technical picture continues to be overall net positive, the bearishness in the intermediate and long-term time frames make Microsoft stock unattractive for investors at current levels. There are just too many signs of weakness to ignore, and the stock’s recent bull run is likely behind it. As for the fundamentals, even though its latest earnings beat expectations, growth has not been that spectacular. The current P/E ratio is unjustified by sluggish EPS growth, while the P/S ratio is more reasonable given the relatively stronger revenue growth. Overall, I would say Microsoft is overvalued relative to its growth prospects. Therefore, after evaluating the technicals and fundamentals, I conclude that the stock is now a sell.
Analyst’s Disclosure: I/we have no stock, option or similar derivative position in any of the companies mentioned, and no plans to initiate any such positions within the next 72 hours. I wrote this article myself, and it expresses my own opinions. I am not receiving compensation for it (other than from Seeking Alpha). I have no business relationship with any company whose stock is mentioned in this article.
Seeking Alpha’s Disclosure: Past performance is no guarantee of future results. No recommendation or advice is being given as to whether any investment is suitable for a particular investor. Any views or opinions expressed above may not reflect those of Seeking Alpha as a whole. Seeking Alpha is not a licensed securities dealer, broker or US investment adviser or investment bank. Our analysts are third party authors that include both professional investors and individual investors who may not be licensed or certified by any institute or regulatory body.
