Summary:
- Microsoft’s stock is currently challenging its 52-week high, which is also its all-time high price.
- I think it’s very likely for it to successfully overtake these previous highs due to the strong technical trading patterns and also the continued momentum of its AI-related products.
- Valuation is a bit high, but not to any alarming degree, as can be shown by a back-of-envelop discounted cash flow calculation.

Andrey Zhuravlev
MSFT stock is challenging 52-week high
I last analyzed Microsoft Corporation stock (NASDAQ:MSFT) on Nov. 5 under the title of “Microsoft Q1: Rule Of 40 Continues.” I argued for a buy thesis following the rule of 40, a framework that measures how well a software business balances its growth and profitability. Quote:
Microsoft’s Q1 2025 earnings exceeded expectations, driven by strong growth in its Intelligent Cloud unit. More importantly, the earnings report demonstrates to me MSFT’s remarkable ability to consistently balance growth and profitability despite its mega size. Measured by the Rule of 40, Microsoft consistently scores well above the 40% threshold even with the most stringent profitability metric.
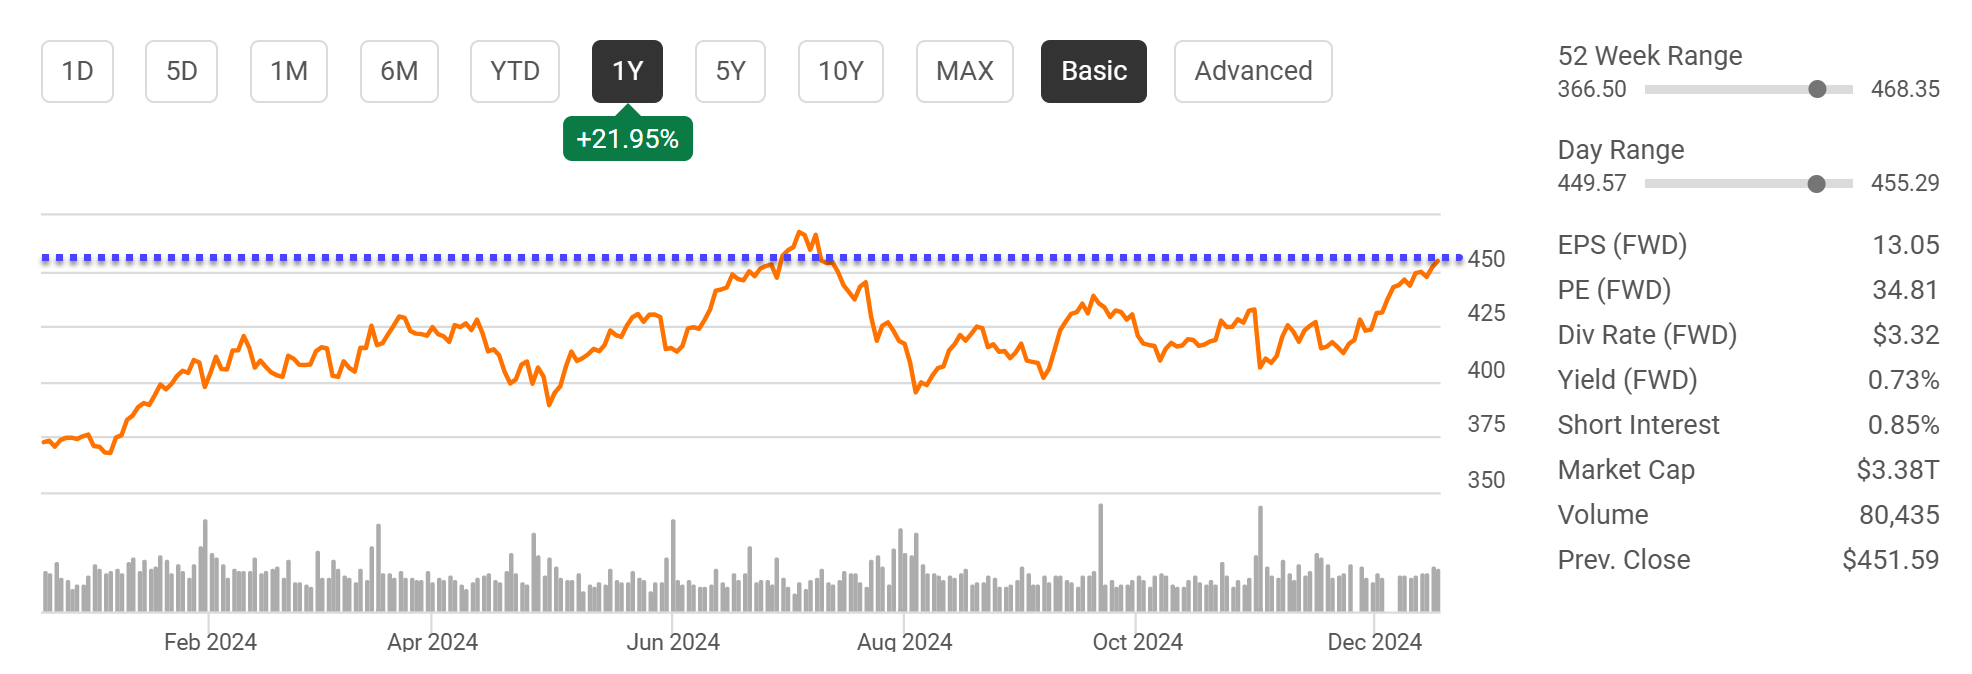
Since then, a few new catalysts have been evolving around MSFT stock. In the remainder of this article, I will explain why these new catalysts have promoted me to upgrade my rating on the stock to Strong Buy from my earlier Buy rating. The leading catalysts on my list are the strong technical trading patterns since my last writing and also the continued momentum of the company’s AI-related products. My view is that these developments signal that the stock price is poised to break out and create new highs. To wit, MSFT stock has demonstrated a notable upward trend since my last writing, as you can see from the following chart. The current stock price is hovering close to its 52-week high of $468 (which is also its all-time-high price). Next, I will explain why I see good odds for MSFT stock to successfully challenge the 52-week high price this time.
Seeking Alpha
MSFT stock: Valuation and growth outlook
Before diving further into the technical trading patterns, let me first address its valuation, a common factor quoted by bears against the stock. As seen from the chart above the forward EPS for the stock is $13.05 and thus the FWD P/E ratio is 34.81x at its current price. Admittedly, this is a quite lofty multiple, either in absolute or relative terms.
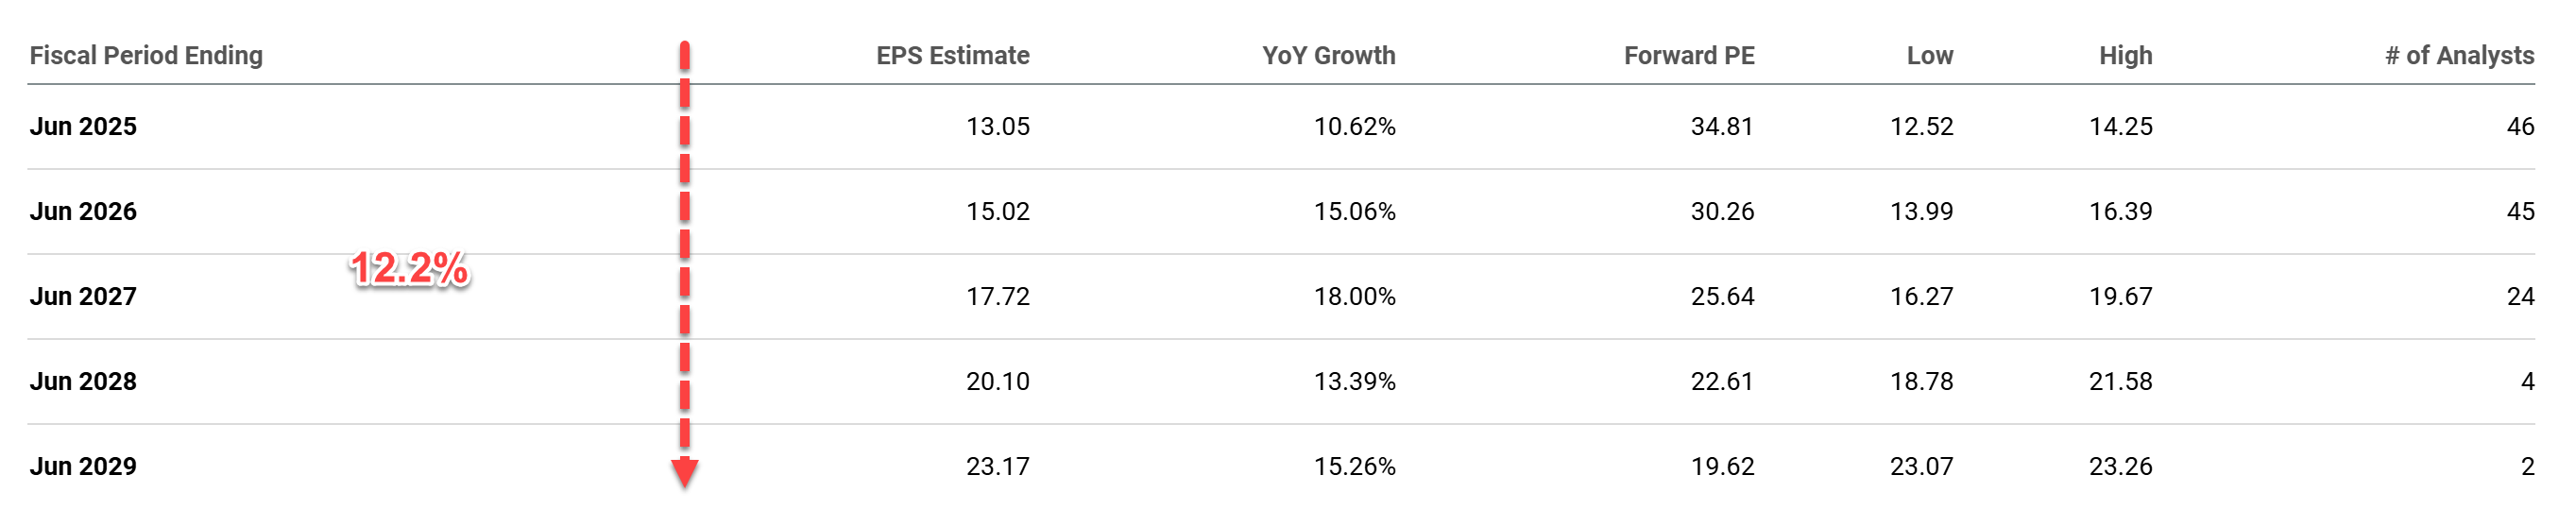
However, valuation should also be interpreted under the context of growth potential. In the case of MSFT, analysts do project a robust growth curve in the coming years as seen in the next chart. The 34.81x FWD P/E is based on the consensus EPS estimate for the fiscal year ending June 2025 and the FWD EPS of $13.05 represents a year-over-year growth of 10.62% as seen.
This growth is expected to accelerate in the following years, with the FY 2026 estimate reaching $15.02 and a YoY growth rate of 15.06% for example. All told, these estimates imply an average growth rate of 12.2% in CAGR terms between FY 2025 and 2029. Under this growth model, its P/E ratio would drop in tandem rapidly in a few years as seen.
Source: Seeking Alpha data.
I see good fundamental catalysts that can support such robust growth. In particular, I expect the growth of AI to keep boosting Microsoft’s performance in many of its segments. For example, the number of Azure AI customers grew nearly 60% in the fourth quarter, to more than 600,000.
Copilot also continues to spread its wings. Copilot customers increased by more than 60% in the fourth quarter. More individuals are incorporating Copilot for Microsoft 365 into their work routine (and this article is typed in Word 365). As a reflection of the strong demand for its AI products, MSFT has been investing in long-term assets around the world aggressively. The latest report shows that Microsoft has bought twice as many Nvidia AI chips this year thus far as its biggest rivals recently (details quoted below):
Seeking Alpha News: Microsoft has acquired twice as many AI chips from Nvidia as its biggest rivals this year, the Financial Times reported, citing estimates from tech consultancy Omdia. The tech giant bought 485,000 of Nvidia’s Hopper chips this year, Omdia analysts estimated, well above 224,000 chips bought by Meta Platforms, Inc. (META) – Nvidia’s second-biggest U.S. customer. Amazon.com, Inc. (AMZN) and Alphabet Inc. (GOOG) (GOOGL) purchased 196,000 and 169,000 Hopper chips, respectively, this year.
MSFT stock: Technical analysis
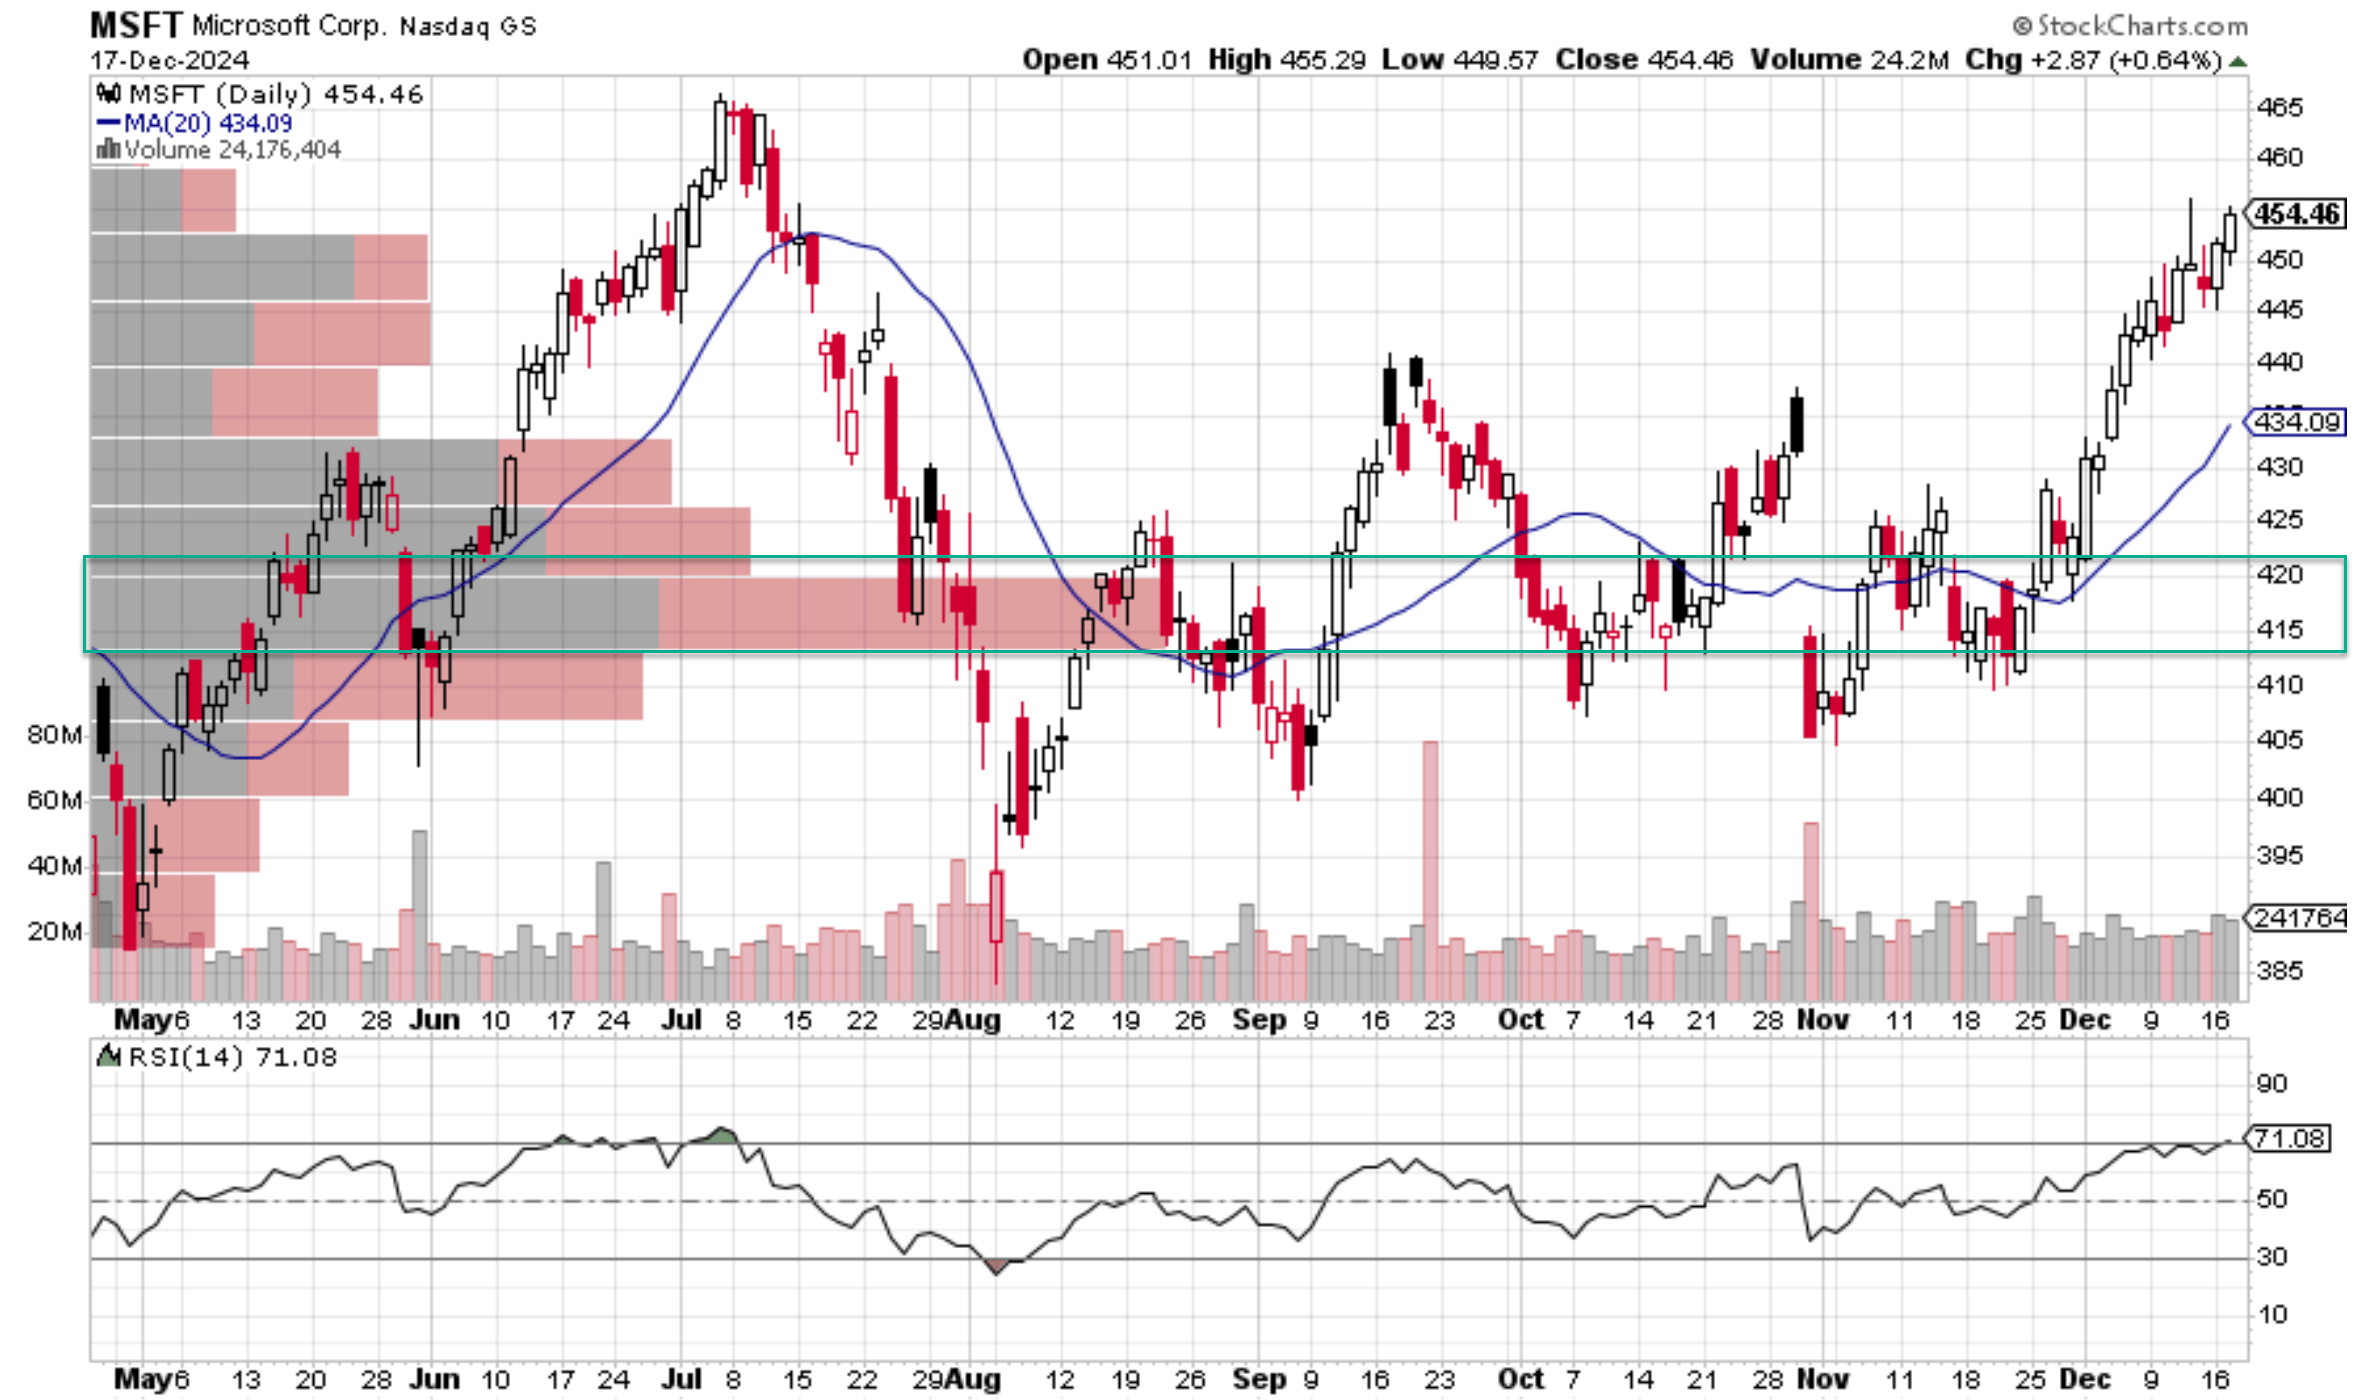
Supported by the above growth catalysts, let me get back to the technical trading patterns that point to a stock price breakout in the near term. Based on the following technical chart, I see several indicators that suggest an upward movement. Starting from the top panel, you can see that its current closing price sits comfortably above the 20-day moving average (MA20) of $434.09, a classic bullish signal. Then I want to draw your attention to the price-volume bar highlighted in the green box. This particular price-volume bar shows that $415 to $420 is the price range that has attracted the largest trading volume recently. Both the MA20 and current stock prices are well above this bar now, which indicates to me that the larger number of traders/investors who participate in this price range have now been replaced by more optimistic ones (or have become more optimistic themselves).
Now, let’s turn to the bottom panel and read the Relative Strength Index panel. As seen, the current RSI stands at 71.08. Generally, an RSI around 50 is considered neutral (indicating a balance of buying and selling pressure) and an RSI above 70 is considered overbought (indicating buying pressure). In MSFT’s case, I see a well-established uptrend in both of its prices, as just discussed, and its RSI signal. As seen, the RSI signal has been on a general upward trend as well since early November. These trading patterns all suggest to me that the strong momentum is well established and can persist for longer, thus making it very likely for the stock to break out of its past price peak and clear more space for further advancements.
StockCharts
Other risks and final thoughts
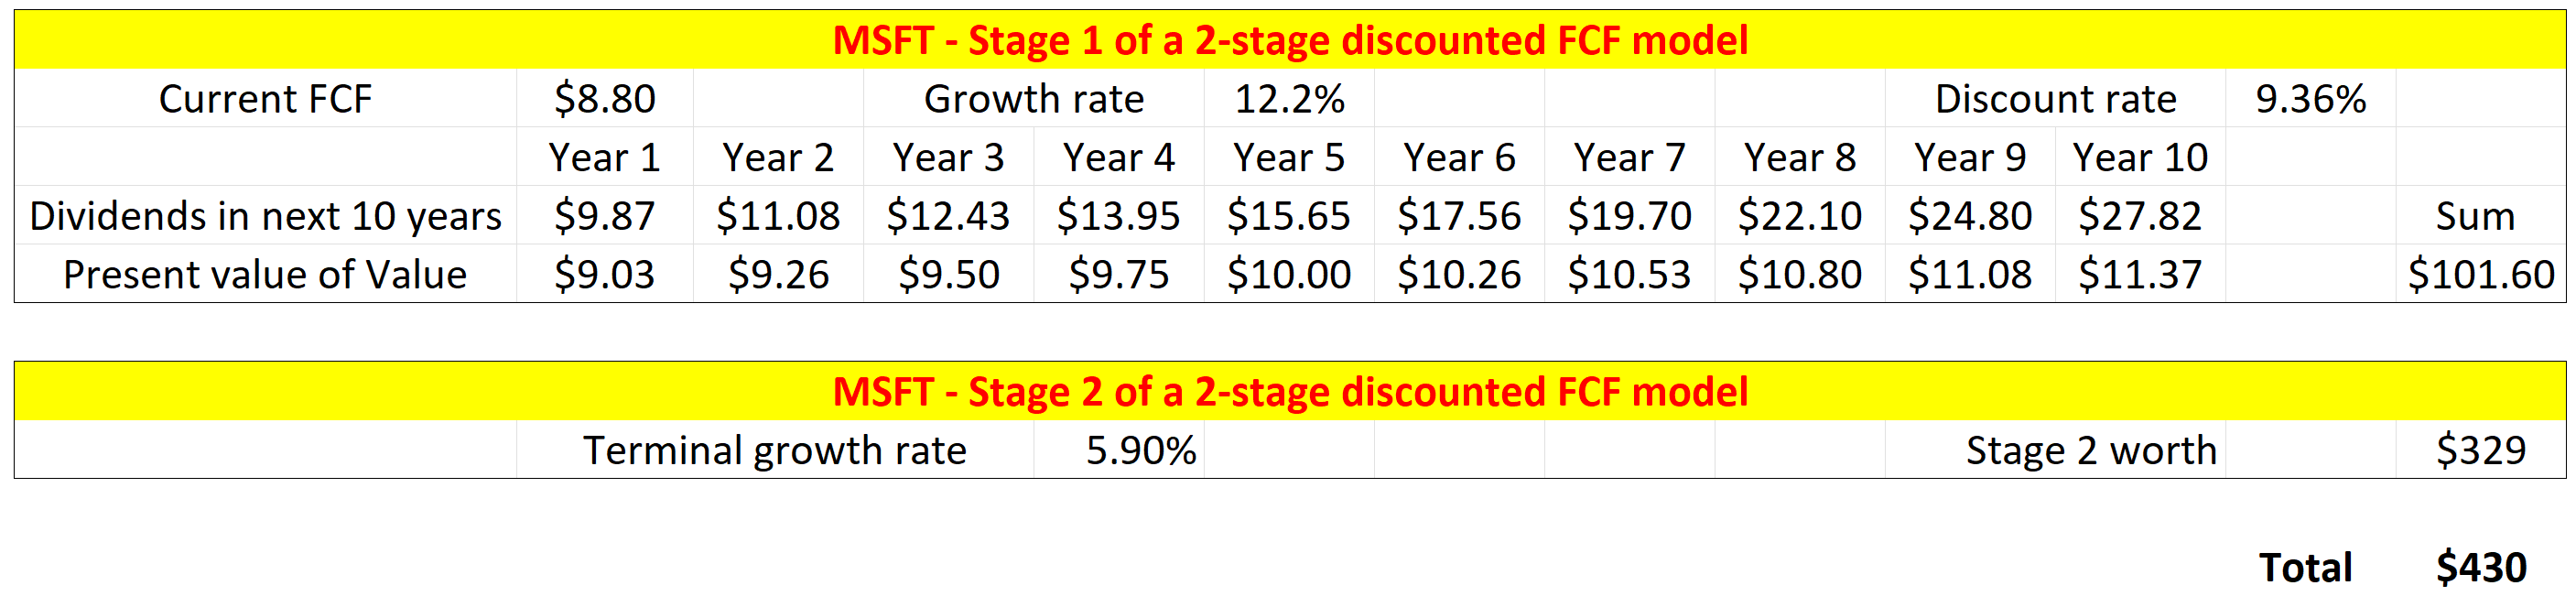
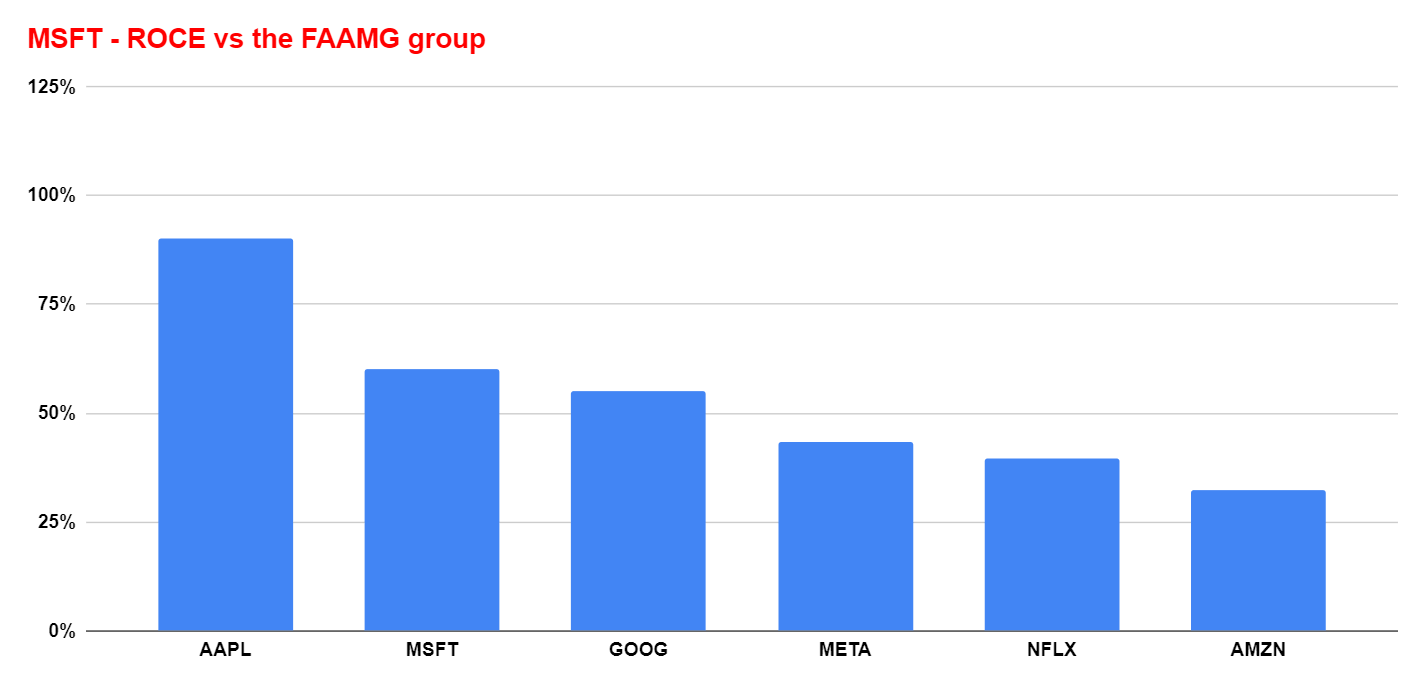
I looked at its valuation and growth earlier. However, a closer look does suggest some degree of overvaluation – though a very mild one. For example, the chart below shows my estimate of its fair value using a two-staged discounted free cash flow model. The model assumed that A) MSFT can grow at 12.2% CAGR in stage 1 based on the consensus projection discussed above, B) its discount rate is 9.36% (which I estimated using the so-called WACC, weight average cost of the capital model), and C) its perpetual growth rate is 5.9%. The perpetual growth rate is estimated by the product of its average ROCE (return on capital employed) of 66% (see the next chart below) and also its average reinvestment rate of ~11% in the past two years. These assumptions lead to a fair value of $430 per share, moderately below its current market price.
Author
Author
However, under the current market conditions and the ongoing uncertainties, I would remind investors of this timeless wisdom – you would rather buy a wonderful business at a fair price rather than a fair business at a wonderful price. Given the fundamental growth catalysts mentioned, MSFT’s wide-moat and super profitability metrics (even by the standard of the FAAMG group as seen in the chart above), and the recent trading momentum, I see a strong “skewness” in MSFT’s return/risk profile and thus upgrade it to a Strong Buy.
Analyst’s Disclosure: I/we have no stock, option or similar derivative position in any of the companies mentioned, and no plans to initiate any such positions within the next 72 hours. I wrote this article myself, and it expresses my own opinions. I am not receiving compensation for it (other than from Seeking Alpha). I have no business relationship with any company whose stock is mentioned in this article.
Seeking Alpha’s Disclosure: Past performance is no guarantee of future results. No recommendation or advice is being given as to whether any investment is suitable for a particular investor. Any views or opinions expressed above may not reflect those of Seeking Alpha as a whole. Seeking Alpha is not a licensed securities dealer, broker or US investment adviser or investment bank. Our analysts are third party authors that include both professional investors and individual investors who may not be licensed or certified by any institute or regulatory body.
As you can tell, our core style is to provide actionable and unambiguous ideas from our independent research. If your share this investment style, check out Envision Early Retirement. It provides at least 1x in-depth articles per week on such ideas.
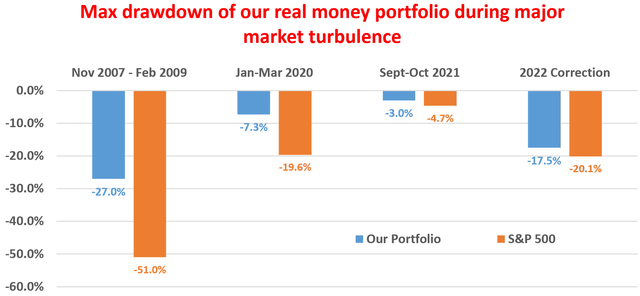
We have helped our members not only to beat S&P 500 but also avoid heavy drawdowns despite the extreme volatilities in BOTH the equity AND bond market.
Join for a 100% Risk-Free trial and see if our proven method can help you too.