Summary:
- This is a technical analysis article. Microsoft had a great pop in price after earnings because it seems to be doing everything right, but is it overvalued?
- If it is overvalued, then any pullback in this bear market to retest its bottom will take all the overvalued stocks down with it.
- If Microsoft were depending on the Activision Blizzard acquisition for its future growth, that is currently on hold.
- No question that Microsoft is a great company and caught the smart guys at Google/Alphabet napping on AI. Google will catch up.
- Obviously earnings are not going to take Microsoft lower, but we think the market and Valuation will take price lower to retest the breakout above the 200-day moving average.
Userba011d64_201
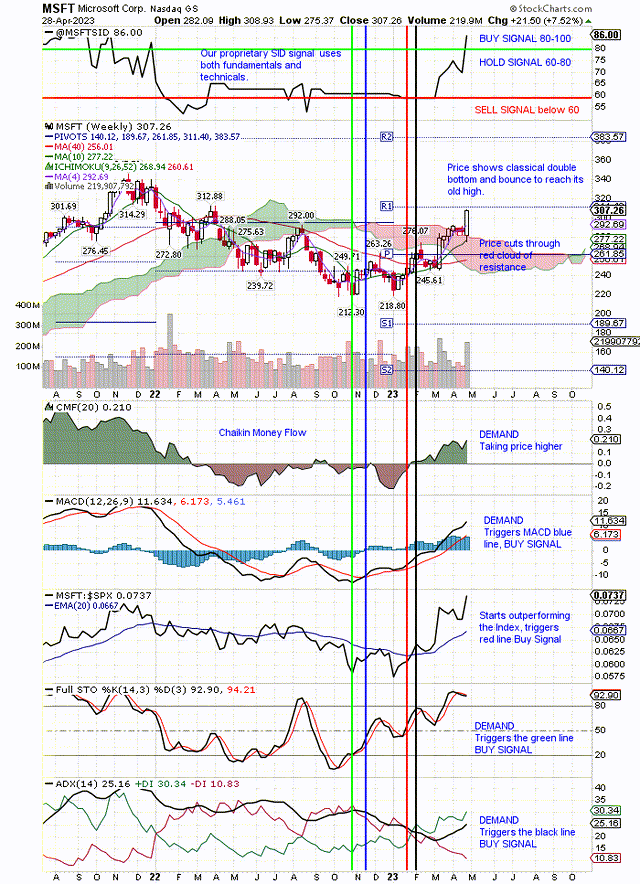
Microsoft (NASDAQ:MSFT) just triggered our proprietary SID Buy signal. It uses both fundamentals and technicals. Our technical buy signal was triggered much earlier, and you can see that vertical, blue line Buy Signal on the chart below.
MSFT seems to be doing everything right with AI and earnings, but is it overvalued? Will price drop back because of that? We think so and here is why. We think this bear market (SPY) is going to retest the bottom during the next six months because these are the worst months for the stock market. We think the Fed will keep interest rates high and that will be the hammer on this market.
When the market goes down, it will take all the overvalued stocks down with it. Microsoft is a good example. It’s a great company, but price is ahead of itself and ahead of Valuation. It’s FPE is too high and not justified by low growth projections. It’s PEG is too high.
Our proprietary Stocks In Demand, SID score rates MSFT a Buy Signal score of 80 out of 100 where 79 is a Hold Signal. We always go to Seeking Alpha articles and Quantitative Ratings to do our fundamental due diligence on what the charts are telling us. The charts look good as you can see below. So what are the fundamentals are saying?
Post earnings SA articles run the gamut with a Buy rating, one with a Hold and another with a Sell. Not surprisingly, Wall St. analysts have a Buy. However, I like to use Seeking Alpha’s Quant ratings. It gives MSFT high grades for Profitability and Momentum, but poor grades for Revisions, Growth and Valuation. Revisions may improve after this latest earnings report. We could live with some of the poor Valuation metrics, if there were aggressive growth. However, we cannot accept both low Growth and poor Valuation metrics for MSFT.
Using both the SA articles and the Quant grades, we think our Buy grade may be slightly generous. It has our lowest possible, Buy Signal grade. We would like to see a much higher grade, closer to 100, then we will put it in our 2024 Model Portfolio.
Here is our weekly chart showing our SID Buy Signal at the top of the chart. This is not purely a technical signal, because it also uses fundamentals. MSFT’s poor Valuation grades delayed this Buy Signal. The purely technical Buy Signal was earlier as you can see by the blue, vertical line triggered by the technical signal at the bottom of the chart.
MSFT vertical line technical buy signals (stockcharts.com)
On the above chart we have drawn vertical lines where the purely technical signals gave a buy signal. The earliest, green vertical line was triggered by the Full Stochastic signal when the bottom fishing buyers came in at the first test of the bottom. They came back in at the second test of the bottom forming the classical, bullish double bottom.
At the top of the chart is our proprietary SID Buy Signal that uses both fundamentals and technicals. You can see how it lags the purely technical buy signals. The reason for this is that our SID signal has an aversion to overvalued stocks. It wants to see both good fundamentals and good technicals. MSFT’s recent earnings just improved the fundamentals and technicals.
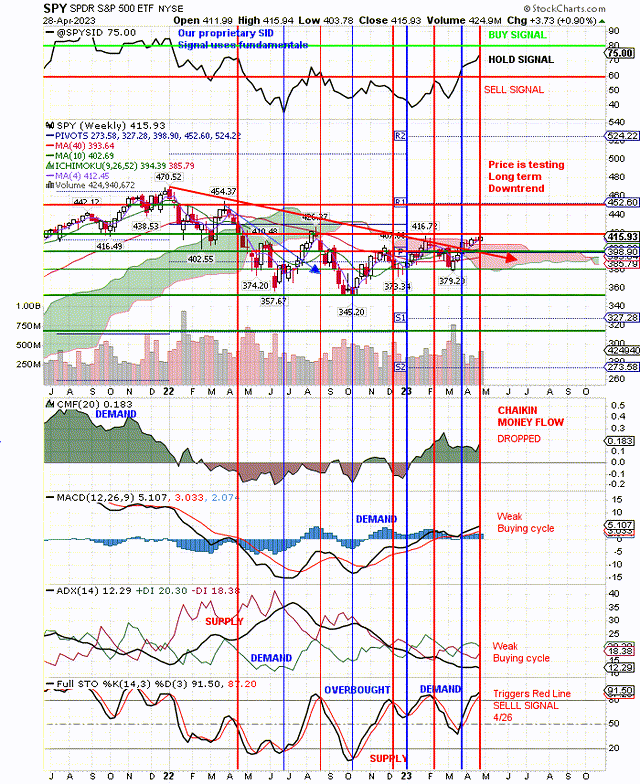
We add stocks when they pullback and trigger our Timing, buy on weakness signals. We will wait for that to happen with MSFT. Below is our chart on the market (SPY) and you can see we have drawn a red, vertical line sell signal because we expect the market to drop from here. That will take most stocks down with it so you can buy stocks like MSFT on weakness. That is when we will add it to our 2024 Model Portfolio.
SPY vertical red line sell signal (stockcharts.com)
As you can see on the above chart, we have mixed signals, but our conclusion is bearish based on these signals so we have drawn the red, vertical line Sell Signal. That was done on 4/26 so we may be premature. The MACD shows three, back to back, buying cycles. This is very overbought. This latest buy cycle looks very tired. Chaikin Money Flow is at a very low level compared to the previous green mountain. It has dropped recently. Price is having a difficult time at this resistance level and failed here last time.
Our proprietary SID signal at the top of the chart has improved from Sell Signal to Hold Signal because of the three back to back MACD buying cycles. We think this will change with the MACD signal. If price breaks out above $420, we will change our red line Sell Signal, but we don’t expect that to happen.
Analyst’s Disclosure: I/we have a beneficial short position in the shares of SPY either through stock ownership, options, or other derivatives. I wrote this article myself, and it expresses my own opinions. I am not receiving compensation for it (other than from Seeking Alpha). I have no business relationship with any company whose stock is mentioned in this article.
Disclaimer: We are not investment advisers and we never recommend stocks or securities. Nothing on this website, in our reports and emails or in our meetings is a recommendation to buy or sell any security. Options are especially risky and most options expire worthless. You need to do your own due diligence and consult with a professional financial advisor before acting on any information provided on this website or at our meetings. Our meetings and website are for educational purposes only. Any content sent to you is sent out as any newspaper or newsletter, is for educational purposes and never should be taken as a recommendation to buy or sell any security. The use of terms buy, sell or hold are not recommendations to buy sell or hold any security. They are used here strictly for educational purposes. Analysts price targets are educated guesses and can be wrong. Computer systems like ours, using analyst targets therefore can be wrong. Chart buy and sell signals can be wrong and are used by our system which can then be wrong. Therefore you must always do your own due diligence before buying or selling any stock discussed here. Past results may never be repeated again and are no indication of how well our SID score Buy signal will do in the future. We assume no liability for erroneous data or opinions you hear at our meetings and see on this website or its emails and reports. You use this website and our meetings at your own risk
Seeking Alpha’s Disclosure: Past performance is no guarantee of future results. No recommendation or advice is being given as to whether any investment is suitable for a particular investor. Any views or opinions expressed above may not reflect those of Seeking Alpha as a whole. Seeking Alpha is not a licensed securities dealer, broker or US investment adviser or investment bank. Our analysts are third party authors that include both professional investors and individual investors who may not be licensed or certified by any institute or regulatory body.

Use our free, 30 day training program to become a succesful trader or investor. Join us on Zoom to discuss your questions.
