Summary:
- Microsoft demonstrates robust financial performance in Q1 2024, driven by the success of Microsoft Cloud.
- Revenue, operating income, net income, and earnings per share all show significant growth.
- The stock price has surpassed key levels and is poised for further upward movement, suggesting potential for price increases.

David Becker
Microsoft Corporation (NASDAQ:MSFT) demonstrated a robust financial performance in Q1 2024, characterized by significant growth across several key areas, primarily driven by the success of Microsoft Cloud. The company reported increased total revenue, underlining its robust market demand and operational efficiency. This surge is primarily credited to the expanding influence of Microsoft’s cloud services. Operating and net income showed impressive growth, reflecting Microsoft’s ability to scale its operations efficiently while maintaining profitability. This article extends the analysis presented in my previous piece from July where I recommended a Strong Buy. The focus here will be on the Q1 2024 earnings and offering a technical analysis of the stock price following the breakout of a key level discussed previously. The stock has surpassed this key threshold and appears poised for further upward movement. This surge seems just the beginning, suggesting significant potential for further price increases.
Microsoft’s Financial Performance
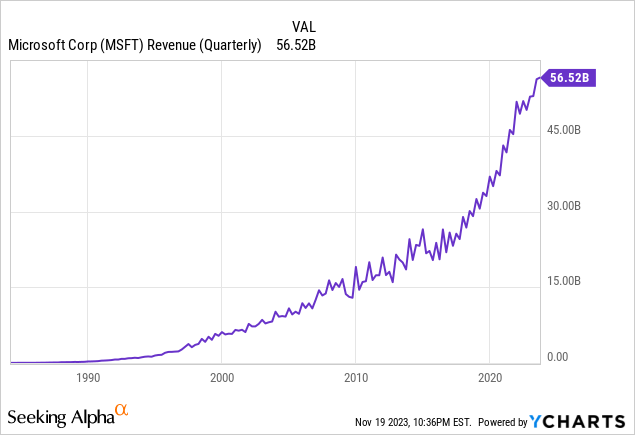
Microsoft exhibited a robust financial performance in Q1 reported on October 24th, underlined by significant growth in revenue, operating income, net income, and earnings per share. The company’s financial results for Q1 2024 reveal a comprehensive upswing in key financial metrics, driven mainly by the strength of Microsoft Cloud. The total revenue reached $56.52 billion, marking a 13% increase from Q1 2023. This growth was consistent even when considering constant currency adjustments, indicating a solid underlying business performance unaffected by foreign exchange fluctuations. The increase in revenue is attributed to the expanding footprint of Microsoft’s cloud services and products. The chart below displays the quarterly revenue, showcasing an exponential growth pattern.
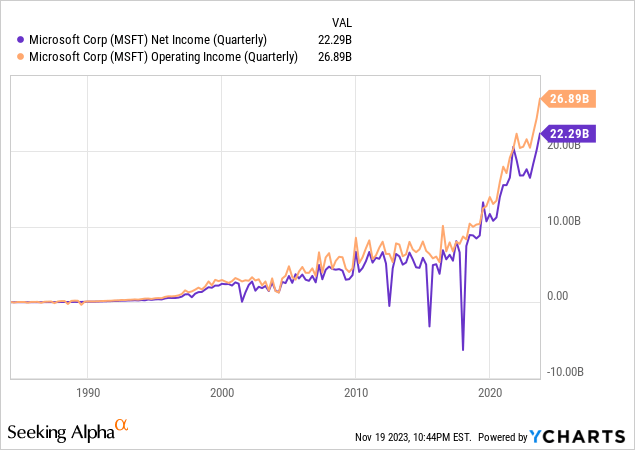
Moreover, the operating income showed an even more impressive growth trajectory, soaring to $26.89 billion, a 25% jump year-over-year, as shown in the chart below. This substantial increase in operating income reflects Microsoft’s ability to scale its operations efficiently while maintaining cost-effectiveness in its business processes. The net income, an essential indicator of the company’s profitability, also stood at $22.3 billion, registering a notable 27% increase. This growth in net income, alongside a parallel 27% increase in diluted earnings per share, which reached $2.99, signifies robust financial health and a strong return on investment for shareholders.
The driving force behind these remarkable financial achievements appears to be the robust performance of Microsoft Cloud, with revenues reaching $31.8 billion, up 24% from Q1 2023. This highlights the growing demand for cloud services and Microsoft’s ability to capture a significant market share.
Delving into specific business segments, the Productivity and Business Processes sector saw a 13% rise in revenue, fueled by double-digit growth in Office 365 Commercial and Dynamics 365. Meanwhile, the Intelligent Cloud segment experienced a 19% surge in revenue, propelled by a notable 29% increase in Azure and other cloud services. However, the More Personal Computing segment had a modest 3% growth, with mixed results across its subcategories. Devices revenue fell by 22%, while Xbox content and services and Search and news advertising revenue saw healthy increases.
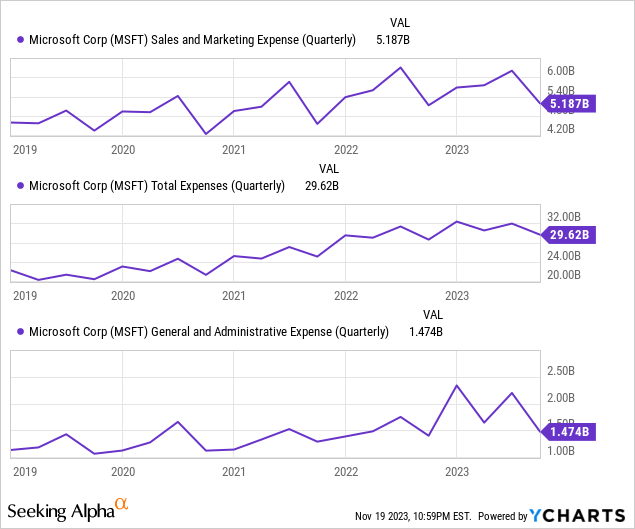
Conversely, the total expenses for the quarter decreased to $29.62 billion compared to the previous quarter. This reduction was attributed to a decrease in sales and marketing expenses, which fell to $5.187 billion, and a drop in general and administrative expenses, down to $1.474 billion. This decline in overall expenses, driven by reduced sales and marketing and general and administrative costs, signifies a more efficient cost management strategy for Microsoft, potentially enhancing the company’s profitability and financial stability in the long term.
Overall, Microsoft’s financial performance in Q1 2024 paints a picture of a company experiencing dynamic growth, particularly in its cloud-based services. The impressive revenue, operating income, and net income underscore the company’s successful adaptation to market demands and its effective operational scaling. The growth in key areas like Microsoft Cloud, along with a prudent reduction in total expenses, demonstrates a strategic balance between expansion and cost management. This robust financial health, marked by significant growth in key areas and efficient expense management, positions Microsoft strongly for sustained success and continued shareholder value in the evolving tech landscape.
The Onset of an Upward Surge Following Key Level Breakout
Recap of Previous Discussion
Based on the previous conversation, Microsoft’s year chart analysis revealed significant volatility in 2019, 2020, and 2021. This period was followed by a more stable pattern in 2022, with an inside candle around a critical level of $352. This volatility suggested a robust upward breakout, offering substantial investment opportunities. A bullish hammer in the quarterly chart reinforced the long-term bullish outlook, occurring amidst a parabolic trend and indicating a likely surge beyond the key level. The expected correction in Microsoft’s stock price to $310 was predicted to be an excellent buying opportunity. The stock hit a low of $310.92 on August 18, 2023, then dipped further to $308.82 on September 28, 2023. Following these lows, the stock successfully surpassed the key level of $352, aligning with the expectations.
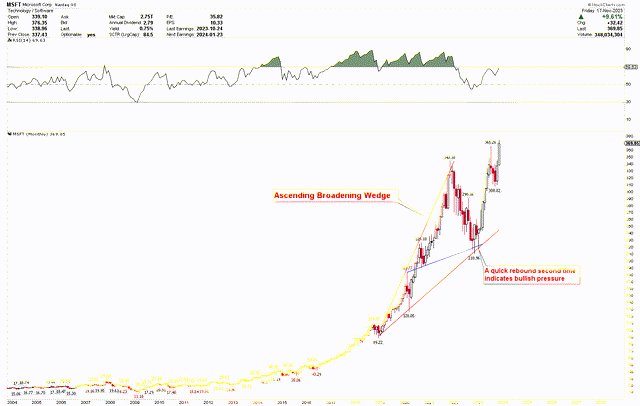
This bullish perspective was based on the technical analysis identifying a solid foundation at the bottom of the ascending broadening wedge pattern. The previous chart below showcases this strong bottom formation at a crucial support level. The stock price was trading around $243, appears to have reached a bottom, and was expected to rise above $365.
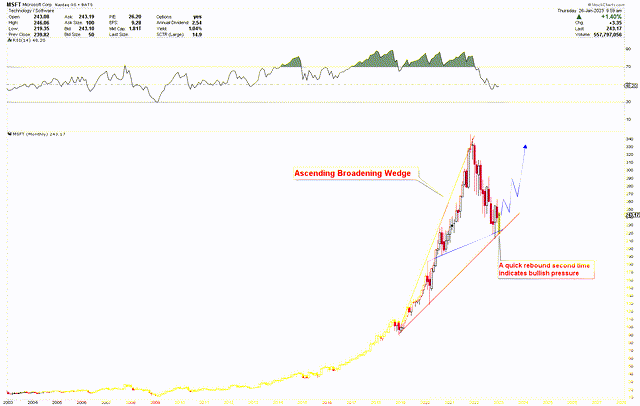
Microsoft Monthly Chart (stockcharts.com)
Additionally, technical analysis confirmed the bottom formation at the 36.8% Fibonacci retracement level and a double bottom at the 200-week moving average. These factors collectively contribute to a robust bullish base around $250, suggesting a potential upward rally.
The Next Step in Price Trends
As previously expected, the stock price has rebounded from its low and is now surging above all-time highs. The revised chart demonstrates how the robust rally, which began at the critical support level of $210, has now surpassed these highs and is climbing even higher. The chart reveals the stock is positioned well above its all-time highs, facing minimal resistance. This suggests that the stock price may continue to rise, even in the face of generally overbought market conditions. This trend is consistent with the long-term Microsoft chart, which has remained overbought for an extended period yet continues to soar to new heights. Consequently, the RSI exceeding 70 might not be a significant concern.
MSFT Monthly Chart (stockcharts.com)
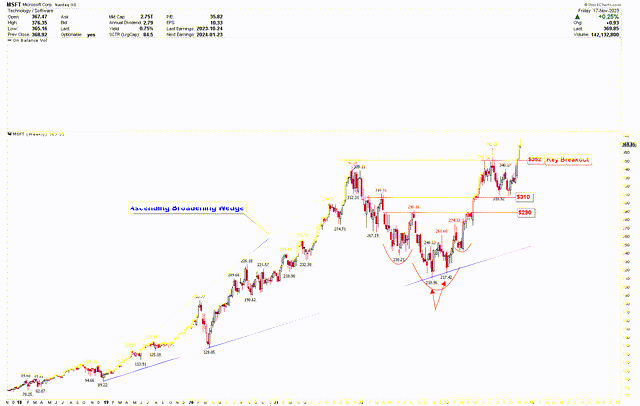
The weekly chart below further illustrates the ascending broadening wedge pattern that originates from a low of $89.22. The recent support level within this pattern is bolstered by an inverted head and shoulders formation, with the head at $210.96 and a double bottom at $210.96 and $217.42. The stock’s ascent past the $310 mark has propelled it to new all-time highs. Notably, a recent price dip found support at this neckline, now established as a strong support level. The stock bottomed at $310.92, forming a double bottom at this level before breaking through all-time highs. Surpassing the $352 threshold, a key level, signals a robust upward momentum, with the stock poised to reach significantly higher targets, as indicated by the ascending broadening wedge line, which is currently set much higher.
Microsoft Weekly Chart (stockcharts.com)
Key Action for Investors
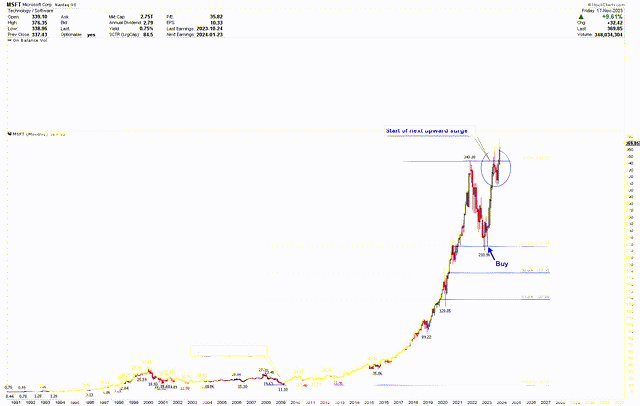
The above discussion presents that Microsoft’s stock price has bottom at the long-term support and is now demonstrating a solid bullish pattern, poised for a significant upward trajectory. The chart below shows that the stock price is breaking out after establishing a base at the 38.2% Fibonacci retracement level. This formation suggests a robust foundation for the stock, indicating a readiness for an upward surge. Notably, the latest weekly candles, highlighted in a blue circle on the chart, imply that the price is set for an upward surge.
Microsoft Monthly Chart (stockcharts.com)
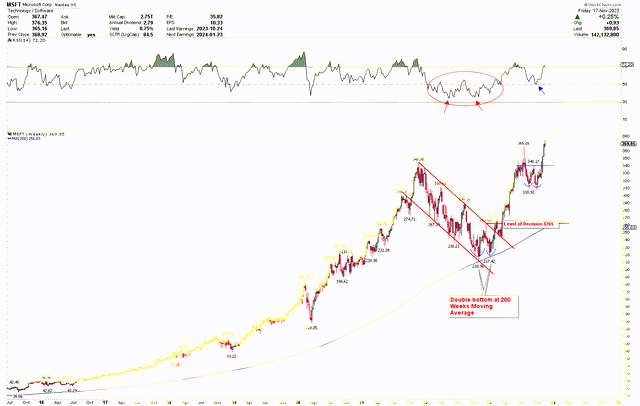
Additionally, the weekly chart below reveals that this sharp rise originated from the 200-week moving average support, with the stock bottoming at $210.96 and $217.42. This ‘double bottom’ pattern led to a break from the red channel, now interpreted as a bull flag. Moreover, the RSI finds support right at the midline 50 and enhances the bullish sentiment. This bullish solid configuration suggests that Microsoft is gearing up for a higher surge.
Microsoft Weekly Chart (stockcharts.com)
Given this robust bullish setup, investors may consider initiating long positions and increasing holdings in Microsoft stocks. This price rally is just the beginning of a more significant upward movement.
Market Risk
Despite Microsoft’s strong financial performance in Q1 2024 and promising technical analysis, the company is not immune to broader economic and market fluctuations. Global economic uncertainties, such as inflation, interest rate hikes, and geopolitical tensions, can impact consumer and business spending. As a technology giant with a global footprint, Microsoft’s revenue, particularly from cloud services and enterprise software, may be susceptible to shifts in economic conditions.
Moreover, the technology sector is characterized by rapid innovation and intense competition. Microsoft’s success in cloud computing, as evidenced by the growth of Microsoft Cloud, places it in direct competition with Amazon.com, Inc. (AMZN) and Alphabet Inc. (GOOG). Any technological advancements by competitors or shifts in customer preferences can threaten Microsoft’s market share and profitability. Additionally, the decline in device revenue highlights the challenges Microsoft faces in some of its segments. New market entrants or disruptive technologies could further impact these segments, affecting overall company performance.
From a technical viewpoint, the stock is currently trading overbought, a condition that could lead to a market correction. Additionally, the appearance of an ascending broadening wedge pattern suggests heightened volatility, which carries the risk of significant price fluctuations.
Final Thoughts
In conclusion, Microsoft’s financial performance in Q1 2024 highlights a company in a state of dynamic growth, particularly in its cloud-based services. The impressive increases in revenue, operating income, and net income, primarily driven by the success of Microsoft Cloud, demonstrate the company’s adaptability to market demands and effective operational scaling. The strategic balance between expansion and cost management, evident in the significant growth in critical areas and efficient expense management, positions Microsoft for sustained success and continued shareholder value.
From a technical perspective, Microsoft’s stock has rebounded strongly, surpassing key thresholds and indicating a robust bullish trend with the potential for further price increases. The formation of a double bottom near the robust support level of $310, coupled with a breakout surpassing $352, signals a potent bullish configuration and a likely continuation of the upward movement. This suggests that investors may consider increasing Microsoft holdings despite the high stock price, as this rally appears to be just the beginning.
Analyst’s Disclosure: I/we have no stock, option or similar derivative position in any of the companies mentioned, and no plans to initiate any such positions within the next 72 hours. I wrote this article myself, and it expresses my own opinions. I am not receiving compensation for it (other than from Seeking Alpha). I have no business relationship with any company whose stock is mentioned in this article.
Seeking Alpha’s Disclosure: Past performance is no guarantee of future results. No recommendation or advice is being given as to whether any investment is suitable for a particular investor. Any views or opinions expressed above may not reflect those of Seeking Alpha as a whole. Seeking Alpha is not a licensed securities dealer, broker or US investment adviser or investment bank. Our analysts are third party authors that include both professional investors and individual investors who may not be licensed or certified by any institute or regulatory body.
