Summary:
- Microsoft’s stock price has risen by an annualized 27% over the past decade, largely driven by valuation expansion. The company now trades at 44x free cash flows, its highest level since 2000.
- Despite a decline in profit margins and a gradual downward trend in revenue growth, 89% of Wall Street analysts rate Microsoft as a buy compared to just 34% in 2013.
- Current valuations suggest negative annual total returns over the next decade, as was the case following the bursting of the tech bubble in 2000.
jewhyte
The ability of mega-cap tech companies to generate strong revenue and earnings growth over recent years in spite of their huge size has been impressive and has led investors to implicitly extrapolate this growth by driving up multiples. Microsoft (NASDAQ:MSFT) is a case in point. Its free cash flows per share have risen by almost 10% annually over the past decade, yet the stock price has risen by an annualized 27% over this period as valuation expansion has been the main driver of the stock. MSFT now trades at 44x free cash flows, its most expensive level since 2000, following which the stock traded underwater for over a decade.
Valuations Have Moved From One Extreme To The Other
Just over a decade ago in December 2012 Microsoft trades with a free cash flow yield to enterprise value of a staggering 17.4%, putting it at a near 70% discount to the S&P500. At the same time, real (inflation-linked) US bond yields were -1%. Microsoft was still a leader in its field with negligible default risk and a pristine balance sheet, yet investors were willing to value the company at levels that implied negative earnings growth for decades from a discounted cash flow perspective.
MSFT Vs SPX Free Cash Flow Yield (Bloomberg)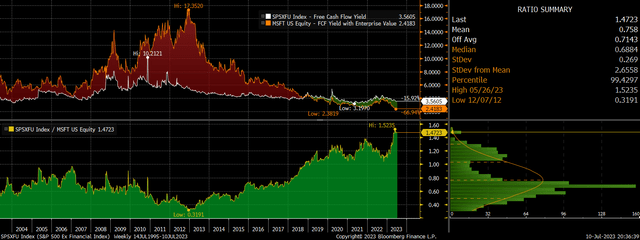
Following this Microsoft’s free cash flows went on to grow by almost 10% annually for a full decade, and investors drove up valuations in tandem resulting in 27% annual returns. Fast forward to today and investor sentiment towards Microsoft has gone from one extreme to the other. Microsoft’s free cash flow yield to enterprise value is now just 2.4%, trading at a 47% valuation premium to the S&P500. The FCF yield is also now just 0.6% above the yield on 10-year inflation linked bonds.
MSFT FCF Yield Vs 10-Year TIP Yield (Bloomberg)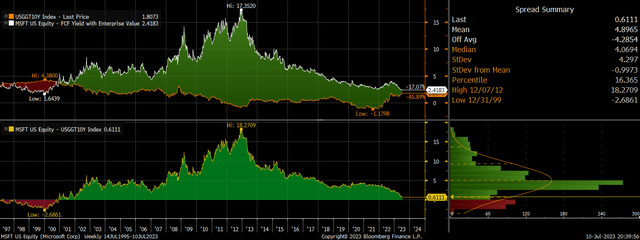
The extreme shift in valuations over the past decade has been mirrored by the sentiment of Wall Street analysts. In early 2013 just 34% of Wall Street analysts held a ‘buy’ rating on Microsoft This figure has since risen to a near record 89%.
Analyst Ratings On MFST (Bloomberg)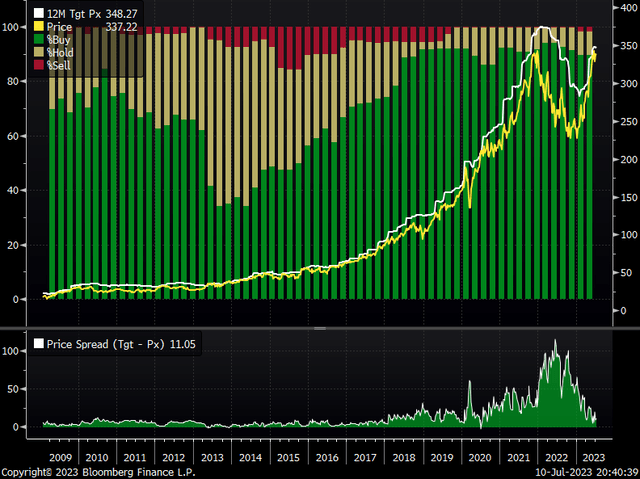
10-Year Returns Likely To Be Negative
The chart below shows the inverse correlation between Microsoft’s price to free cash flow ratio and subsequent 10-year total returns over the past three decades. The long-term link between valuations and returns remains firmly intact and current valuations are consistent with annual returns of around -5%.
MSFT Price/FCF Vs 10-Year Returns (Bloomberg, Author’s calculations)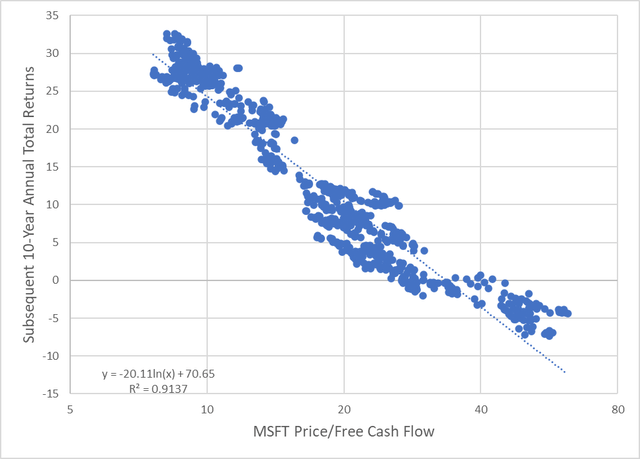
It is true that we have seen profit margins decline over the past decade, meaning that the price to sales ratio has risen less rapidly. Based on the historical correlation between the price to sales ratio and subsequent annual returns the current ratio of 12.1x is consistent with annual returns of around 3%.
MSFT Price/Sales Vs 10-Year Returns (Bloomberg, Author’s calculations)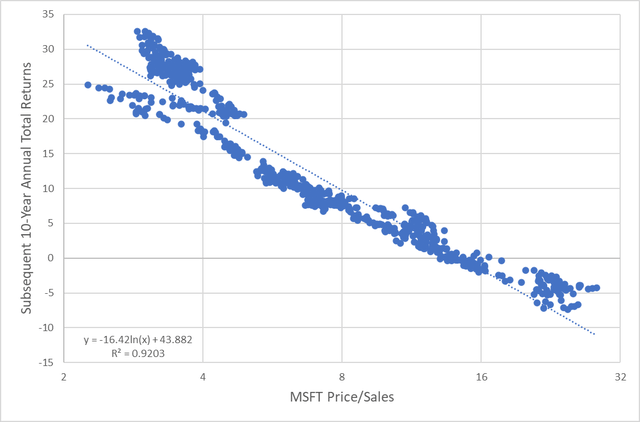
The relatively low price to sales ratio compared to the price to free cash flow ratio reflects the long-term decline in profit margins. Free cash flows are currently 28% of sales compared to 40% a decade ago and 50% two decades ago. A recovery in profit margins could allow Microsoft to generate reasonable returns. However, previous cyclical lows in profit margins such as in 2009 and 2015 were caused by negative sales growth, which are still growing at 7% annually suggesting a recession could see margins fall even lower. With falling gross margins explaining almost all of the decline seen in net profit margins, a recovery will not be easy to achieve without strong sales growth, which continues to weaken.
Free Cash Flow, % of Sales Vs Gross Profit, % of Sales (Bloomberg)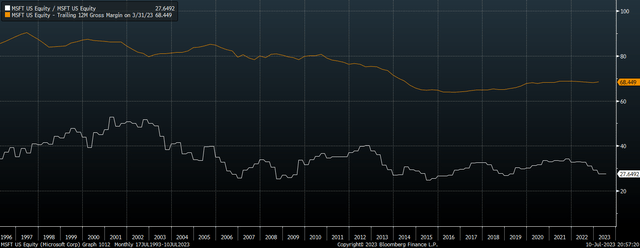
Real Sales Growth Trending Lower
It is important to note that the return assumptions shown in the charts above implicitly assume that future earnings and sales grow at the same trend rate as they have in the past. Microsoft has had to accept declining gross margins in order to continue growing revenues rapidly, yet the long-term trend of revenue growth is still in decline as the sheer size of the company makes perpetual rapid growth unfeasible. In real terms, sales growth rate has fallen to just 2% which is below the growth rate of the overall market.
MSFT Real And Nominal Revenue Growth (Bloomberg)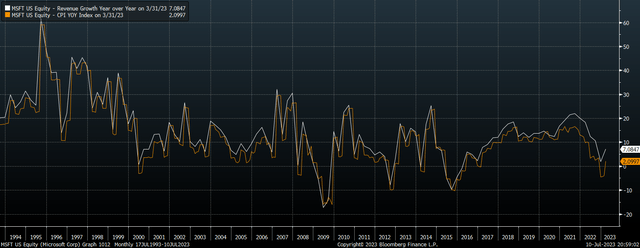
If real revenue growth were to maintain this 2% real rate and profit margins and were to remain at current levels, Microsoft would be expected to return 2.8% per year in real total return terms when factoring in the 0.8% dividend yield. Considering that investors can receive higher real yields on short-term government bonds, this suggests investors are anticipating a recovery in sales and earnings and/or a further increase in valuations. These conditions leave Microsoft susceptible to a sharp drop should sentiment shift.
Even A Drop To Apple’s Valuation Would Require A 30% Stock Price Decline
Even if Microsoft’s free cash flow yield were to rise by a single percentage point from 2.4% to 3.4%, which is around where Apple’s stock is trading, this would require a 30% decline in the stock price. If the FCF yield were to rise back to the S&P500 average of 3.9%, this would require a 44% decline in the stock price. A move back to the bargain levels seen a decade ago would require an 87% decline. On the upside, even a return to the record low FCF yield of 1.6% seen at the height of the dot com bubble would result in just 37% gains. The last time Microsoft traded at its current FCF yield in 2000 it went on to post negative total returns for a full decade despite free cash flows rising 11% annually for a full decade. This should be a warning to investors who appear to be extrapolating recent gains into the future.
Analyst’s Disclosure: I/we have a beneficial short position in the shares of MSFT either through stock ownership, options, or other derivatives. I wrote this article myself, and it expresses my own opinions. I am not receiving compensation for it (other than from Seeking Alpha). I have no business relationship with any company whose stock is mentioned in this article.
Seeking Alpha’s Disclosure: Past performance is no guarantee of future results. No recommendation or advice is being given as to whether any investment is suitable for a particular investor. Any views or opinions expressed above may not reflect those of Seeking Alpha as a whole. Seeking Alpha is not a licensed securities dealer, broker or US investment adviser or investment bank. Our analysts are third party authors that include both professional investors and individual investors who may not be licensed or certified by any institute or regulatory body.
