
Summary:
- Microsoft leads in AI, holding a significant stake in OpenAI. Competing with Google, AWS, and Meta, it aims to build AGI. This boosts profits, but may have long-term ethical risks.
- Microsoft shows the highest AI-related growth among peers. Its diversified approach slows growth slightly, but its net income margin remains impressive.
- MSFT stock is likely fairly valued, and my baseline price targets for the investment over the next two decades indicate market-beating returns.
- Investors and management should consider the long-term risks of the AI arms race. Major AI players would benefit from a slower, more prudent approach, prioritizing long-term value over short-term gains.
kentoh/iStock via Getty Images
I last covered Microsoft (NASDAQ:MSFT) in February; I put out a Buy rating at the time, and since then, it has gained ~3.3% in price. In my analysis, I focused on the long-term benefits of the Activision Blizzard acquisition. In this piece, I show how Microsoft is positioned to be one of the leaders in AI and that while its valuation is high compared to historical multiples and certainly too high based on my DE analysis, its AI operations and the long-term market sentiment that should coincide with this are very promising for shareholders seeking strong long-term price returns.
Microsoft’s Position In AI
Microsoft’s most significant position in AI is its partnership with OpenAI, which it announced in 2019, investing $1B to collaborate on developing artificial general intelligence, also known as AGI. The collaboration also makes OpenAI’s capabilities widely accessible on Microsoft’s Azure cloud platform. In 2023, Microsoft announced a further multi-year, multi-billion dollar investment in OpenAI. The aim of this is to accelerate progress in developing AGI and to further integrate OpenAI’s technology into Microsoft’s products.
Microsoft is also heavily involved with AI outside of its partnership with OpenAI. Azure AI includes the following AI services and tools across Microsoft’s cloud platform:
| Azure Cognitive Services | APIs for vision, speech, language, and decision-making, amongst other services. |
| Azure Machine Learning | Offers a platform designed for building, training, and deploying machine learning models. |
| Azure Bot Services | Enables the creation of chatbots and other conversational AI. |
In addition, the Microsoft Power Platform can automate workflows, create custom applications, and analyze data with minimal coding.
I think the most important thing to understand here is that Microsoft does not see its partnership with OpenAI as the be-all-and-end-all of its AI ecosystem. The company is strategically diversifying itself, and while it clearly sees its OpenAI investment as high value, evidenced by its recent heavy reinvestment in the company, it is also continuing to perform its own AI development and research. This is led by the team at Microsoft Research (‘MSR’), which focuses on leading research in machine learning, computer vision, natural language processing, and other AI domains. Crucially, Microsoft has also set up the Aether Committee, where Aether stands for ‘AI and Ethics in Engineering and Research’, and tools and frameworks for responsible AI development, including InterpretML and Fairlean.
I believe that while these initiatives for ethical AI development and governance are promising, Microsoft still needs to be careful that in the current AI arms race, which is being accelerated in efforts for companies to remain competitive, it does not forget the potential issues that could arise later down the road through misjudged complications. These may include negative sentiment surrounding invasions of user privacy and misinformation spreading, which could result in significant drops in users, and regulatory inhibitions, severely affecting Microsoft’s growth in the worst-case scenario. It is critically important that Microsoft continue to monitor this and prepare itself for ethical AI because it is facing a lot of competition, including from Alphabet (GOOGL) (GOOG), Amazon (AMZN), Meta (META) and others. I believe the companies that develop long-term trust with their users will have the models that will be used for the longest periods of time and be most accretive to the company’s overall reputation, brand, and earnings potential.
| Alphabet | Leads with DeepMind’s research, TensorFlow, and AI-enhanced products, including Search and Google Assistant. It has a heavy emphasis on ethical AI, including advisory councils. |
| Amazon | Dominates cloud AI services through AWS, with significant investments in Alexa and retail innovations such as Amazon Go. It also focuses on responsible AI use. |
| Meta | Pioneering with FAIR’s research, PyTorch, and AI-driven content moderation and personalization. It has an independent body to guide ethical AI deployment. |
All of the companies listed above operate extensive data centers. Microsoft Azure has over 200 data centers in more than 60 regions, making it one of the largest cloud infrastructure providers in the world. It is these data centers that power OpenAI’s models. In addition, OpenAI uses Azure’s extensive infrastructure to train large-scale AI models, such as GPT-4.
In my opinion, each of these companies is very well positioned for extremely strong long-term success, with slightly different use cases for each. A lot of the long-term difference in terms of investment merit boils down to the stock valuations, which I will discuss below.
Financial Peer Analysis
To begin this financial analysis, please consider the following table, which is of historical and present results and data, not future forecasts:
| ________________________________ | MSFT | GOOGL | AMZN | META |
| FWD Revenue Growth 5Y Avg | 13% | 16.59% | 18.47% | 18.5% |
| FWD Diluted EPS Growth 5Y Avg | 15.69% | 20.28% | 24.76% | 15.34% |
| FWD Free Cash Flow Growth 5Y Avg | 12.68% | 20.59% | 28.59% | 12.52% |
| TTM Net Income Margin 5Y Avg | 34.44% | 23.56% | 4.16% | 28.7% |
| Equity-to-Asset Ratio | 0.52 | 0.72 | 0.41 | 0.67 |
In the above table, I have bolded the items which I believe are particularly strong.
Microsoft notably has the highest net income margin over the past five years in quite some way, but its growth is notably slower than Google and Amazon. Primarily, Amazon’s high net income margin comes from its extreme focus on capital efficiency within its business model. For example, Microsoft prioritizes a matrix structure, acting as a technology portfolio holding company rather than a closed ecosystem like Apple (AAPL).
Microsoft’s extensive diversification, while beneficial for its profitability due to large moats being established through acquisitions and investments, means its growth is likely to be slower than more concentrated companies. As a comparison, Amazon is also well diversified, but its portfolio of companies is more concentrated around supporting a full ecosystem approach rather than Microsoft’s often broader emphasis in different sectors, for example, with Windows, Surface devices, Xbox, and LinkedIn. However, Microsoft’s focus on high-growth areas within its diversified portfolio, like with Azure, can still drive significant growth for investors to benefit from. In effect, Microsoft offers steadier and longer-term growth, whereas Amazon’s model supports robust but more rapid growth. In my opinion, slow and steady often accumulates the most over time; Microsoft is already enjoying the benefits of this strategy as the world’s largest company by market cap at the time of this writing.
Specifically related to AI, Microsoft’s Azure cloud services saw a 31% revenue increase in the last reported quarter; the broader Microsoft Cloud segment, which includes Azure, Office 365, Dynamics 365, and LinkedIn, delivered a 23% increase. In addition, Microsoft’s utilization of AI within its product lines, including Office 365 Copilot, has led to improved business outcomes internally. To compare this, Google reported a 28.5% increase in its cloud segment in the latest quarter; AWS revenue grew by 17% in the latest quarter.
In my opinion, Microsoft will continue to be one of the dominant leaders, if not the dominant leader, in AI models and services alongside Google. The current data definitely already shows this, as Microsoft is delivering high growth in its segments related to AI. However, I think Microsoft is more highly valued and much less appealing of an investment than Google at this time for this reason primarily.
Valuation Analysis
To begin this valuation analysis, please consider the data in the following table, which is of historical and present data, not future estimates:
| MSFT | GOOGL | AMZN | META | |
| FWD P/E GAAP Ratio | 36.25 | 23.2 | 41.22 (Non-GAAP) | 24.85 |
| FWD P/E GAAP Ratio 5Y Avg | 30.97 | 25.91 | 183.02 (Non-GAAP | 23.7 |
| Difference | +17.04% | -10.46% | -77.48% (GAAP not available) | +4.86% |
| FWD P/S Ratio | 12.98 | 6.24 | 3.05 | 8.03 |
| FWD P/S Ratio 5Y Avg | 10.33 | 5.67 | 3.02 | 6.63 |
| Difference | +25.73% | +10.18% | +0.81% | +21.04% |
In the above table Amazon’s 5Y Avg for FWD P/E GAAP is not available, so I have used the non-GAAP measure. However, its current FWD P/E GAAP is 41.27, and its current FWD P/E Non-GAAP is 41.22, so there is little difference. I have bolded the data I consider relatively strong, and I have italicized the data I consider relatively weak.
There is no doubt about it: Microsoft is richly valued, and in my opinion, investors would be wise to understand that they are sacrificing value for steady long-term growth when allocating to Microsoft at this time. The current ~+17% increase above the five-year average for Microsoft’s FWD P/E GAAP ratio is warranted due to the stable and relatively constant growth it has delivered over recent years, including free cash flow and earnings, which have been growing exponentially over 10 years. With AI and robotics, there is arguably a lot more room for margin expansion, too, which has the potential to further drive the stock price higher and likely increase investor sentiment further.
Author, Using Seeking Alpha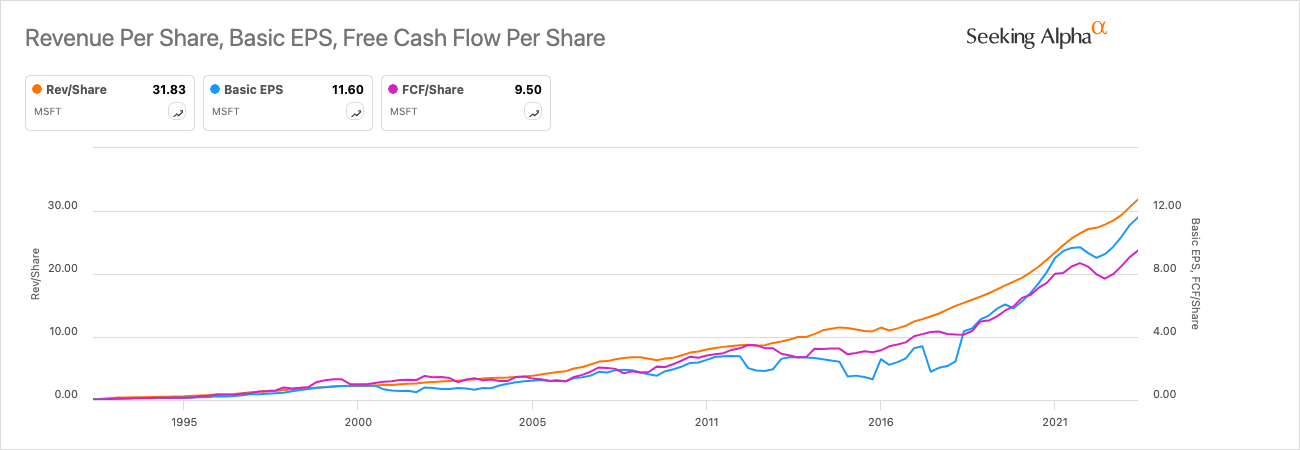
For my conservative price target calculation, I have opted for 15% annual basic EPS growth over 2024-2034 and 7.5% annual basic EPS growth over 2034-2044, starting with a basic EPS of $11.60 and the current P/E GAAP ratio of 38.25 at the time of calculation. I posit that the P/E ratio will be around 35 after 10 years due to stagnant or lower annual EPS growth compared to historically due to market saturation and that the P/E ratio will be around 30 by 2044, primarily contracted also because of the lower growth that the company is likely to be delivering from 2034-2044 unless it has massively implemented AI and robotics into its internal operations to reduce labor and administrative costs effectively.
Author’s Graph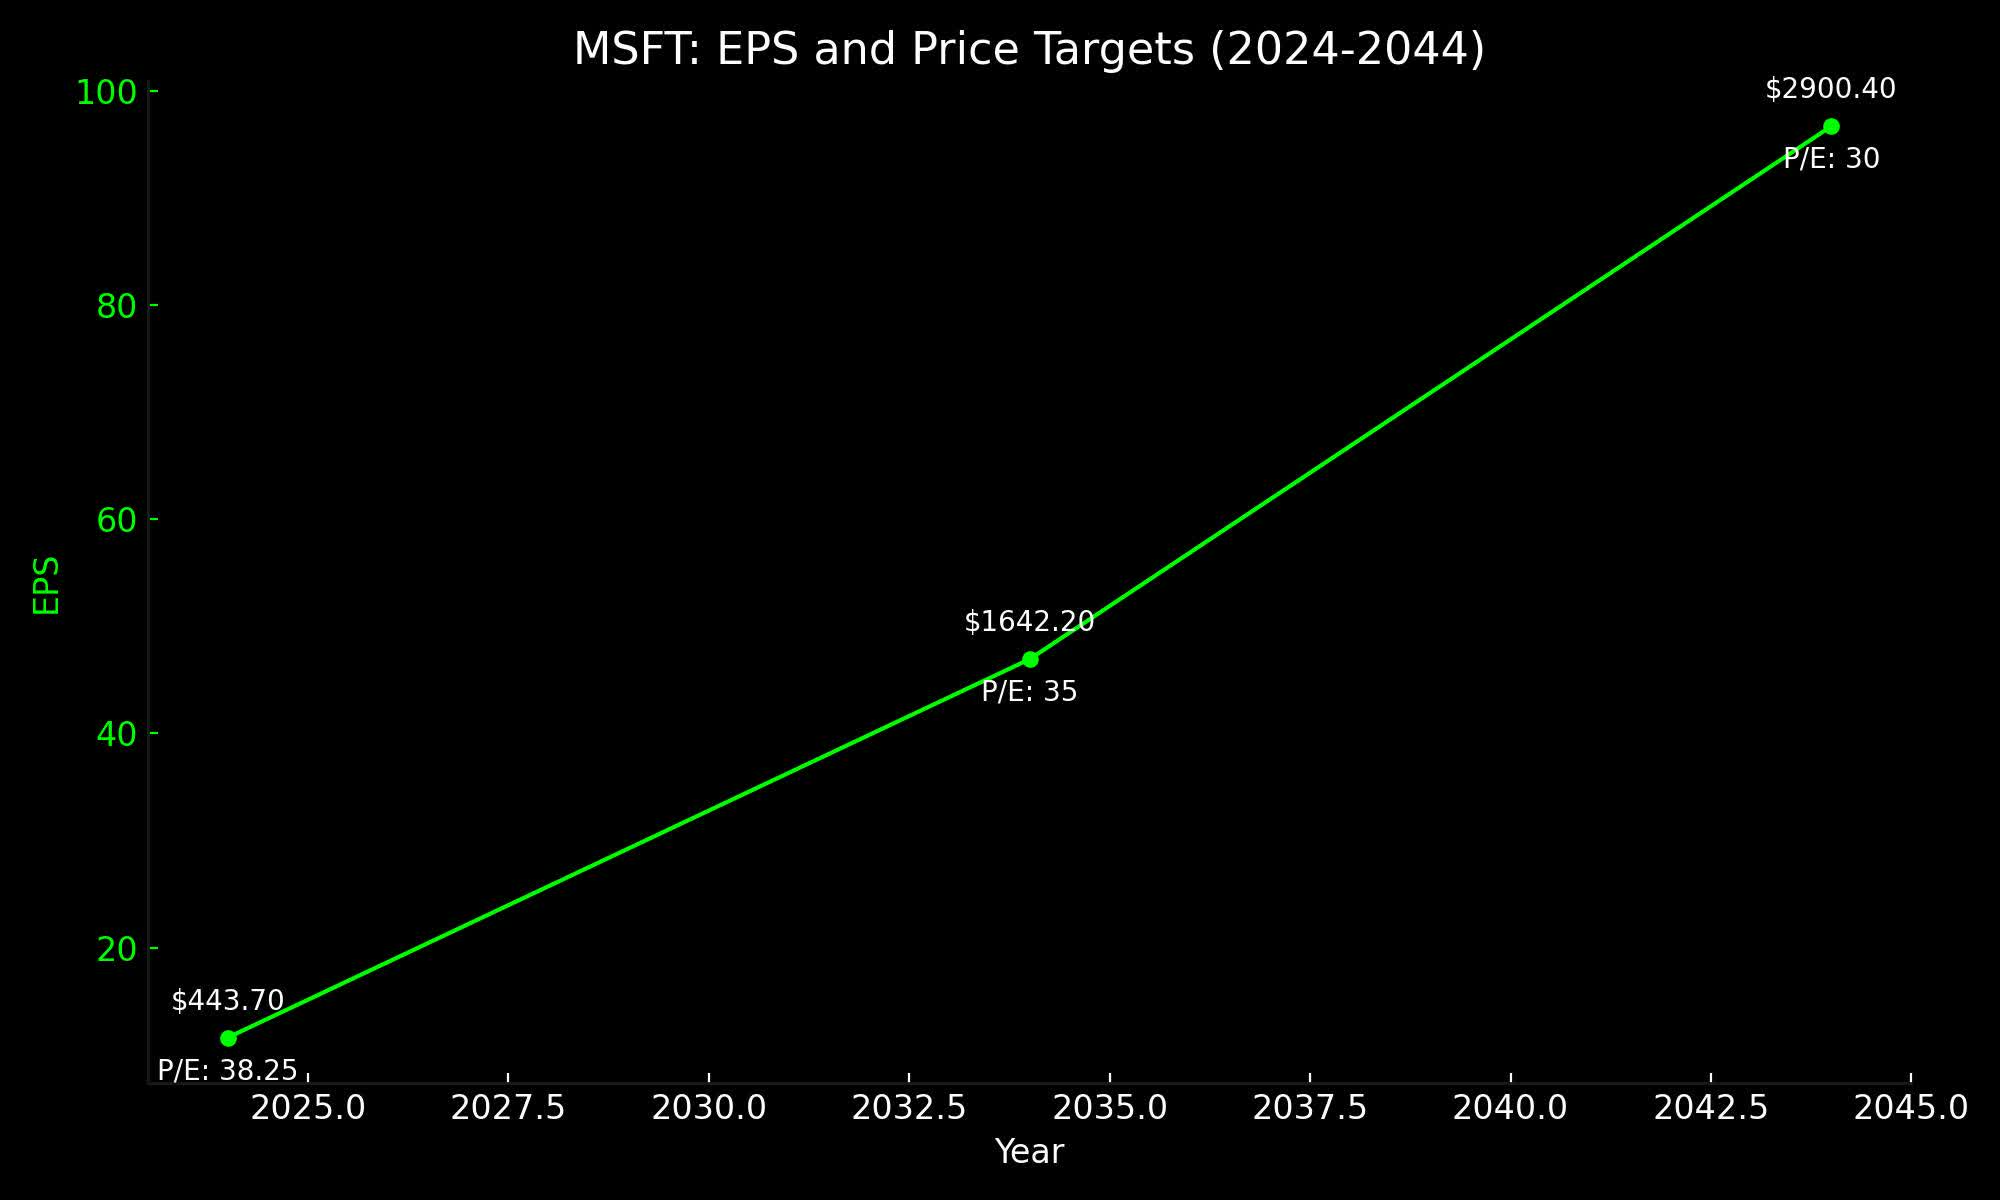
The stock price compound annual growth rates implied here are 13.98% from 2024-2034 and 9.84% from 2034-2044. The price targets are ~$1,640 in 2034 and ~$2,900 in 2044. I consider this a baseline scenario, representing a conservative market outlook that can be easily beaten, providing my fair value estimates for the stock at these timestamps.
In my previous thesis on Microsoft, I used a discounted earnings model to show what I considered the ‘intrinsic value’ of Microsoft at the time. However, moving forward, I plan to use a more integrated price target analysis embedding price-to-earnings and other valuation multiples, along with EPS and FCF growth rates, with a sensitive consideration of conservative outcomes based on my predictions surrounding the market’s sentiment for MSFT stock.
Long-Term AGI Implications
While I have touched on this risk previously in this piece, I believe it deserves more attention here. Microsoft and many other AI companies are competing aggressively for growth, profitability, and shareholder interests. While this is good for the short-to-medium-term interest of investors, the long-term ramifications of building AGI quickly and competitively need to be put into context. In my opinion, the negative long-term effects on society and on shareholders, if AGI develops negative patterns or the capabilities to unroot economic structures in society related to the job market without civilizational preparedness, are large. In my opinion, investors and major shareholders in all big tech companies should be pushing for more rigorous oversight, regulation, ethical control, and potentially some restraint in profit-seeking motives, replaced by the genuine care for humanity that these exceptional tools could help to bolster. This current period of nascency for these technologies in the mainstream could move the needle either way—toward greater societal suffering and control or toward greater happiness and freedom. In my opinion, shareholders are likely to benefit much more over the very long term in the second scenario, whereas the short-to-medium term may look good in the first instance, with great costs being born later.
Key Elements
Microsoft is one of the world’s leaders in AI models, and its ecosystem includes a significant stake in OpenAI. The company faces an arms race against Google, AWS, and Meta, amongst others, to build AGI. This is both driving profits and has potential negative long-term effects if not managed ethically.
Microsoft is delivering the highest growth against its peers in segments related to AI, but its diversified portfolio approach makes its growth slightly slower than other companies. That being said, its net income margin is impressive.
MSFT stock is likely to be fairly valued when considering the recent growth it has delivered and the historical valuation ratios the market has tolerated. I posit baseline price targets for MSFT of ~$1,640 in 2034 and ~$2,900 in 2044.
I believe investors and company management would be wise to consider the long-term negative effects that could come from accelerated production of AGI to win the ‘AI arms race’ at the expense of careful, patient, and prudent human interests. I think that each of the major players in AI would benefit from taking a longer-term and slower approach to model iterations and progression, sacrificing short-term profits and reputation for long-term value and prestige.
Conclusion
In my opinion, Microsoft is an incredible company, and it is highly likely that it will remain one of the leaders in AI over the next few decades. While the stock does not offer the same value opportunity as Google right now, it certainly looks to be fairly valued and should deliver strong price growth over the next few decades, given its heavy investment in high-growth areas.
Analyst’s Disclosure: I/we have a beneficial long position in the shares of GOOGL, AMZN either through stock ownership, options, or other derivatives. I wrote this article myself, and it expresses my own opinions. I am not receiving compensation for it (other than from Seeking Alpha). I have no business relationship with any company whose stock is mentioned in this article.
Seeking Alpha’s Disclosure: Past performance is no guarantee of future results. No recommendation or advice is being given as to whether any investment is suitable for a particular investor. Any views or opinions expressed above may not reflect those of Seeking Alpha as a whole. Seeking Alpha is not a licensed securities dealer, broker or US investment adviser or investment bank. Our analysts are third party authors that include both professional investors and individual investors who may not be licensed or certified by any institute or regulatory body.