Summary:
- AI optimism and a surge in Microsoft’s capex and stock based compensation over recent years have seen the company’s price to free cash flow ratio exceed 50x.
- This puts the stock among the most expensive US mega caps, which makes it uniquely overvalued when its huge market size is taken into account.
- Investors now unconsciously rely on unfeasibly high growth rates and low required rates of return for several decades into the future to justify current equity values.
wildpixel/iStock via Getty Images
The bullish case for Microsoft (NASDAQ:MSFT) focusses on how the company stands to become one of the main beneficiaries of the Artificial Intelligence boom, with potential to gain market share relative to Amazon in cloud services and Google in search. However, the stock already commands one of the highest multiples in the mega cap universe, and out of the 67 Wall Street analysts covering the stock not a single one has a ‘sell’ rating, while 62 hold a ‘buy’ rating.
The near doubling of MSFT from its November 2022 lows has resulted almost entirely from an increase in the company’s valuation multiples, with the free cash flow yield falling from 4.0% to just 2.1% today. Such valuations reflect the lack of concern among investors for the unfeasibly strong growth outlook and low required rates of return that they now rely on. In my previous article on Microsoft in July last year, I argued that the stock was extremely overvalued and likely to post negative long-term returns amid slowing revenue growth. In this article, I will compare Microsoft to its mega cap peers, showing that the stock stands out as being uniquely overvalued even relative to other overvalued mega cap stocks given its already huge size.
Surging Capex And Stock Based Compensation Leave The Price To Free Cash Flow Ratio Above 50x
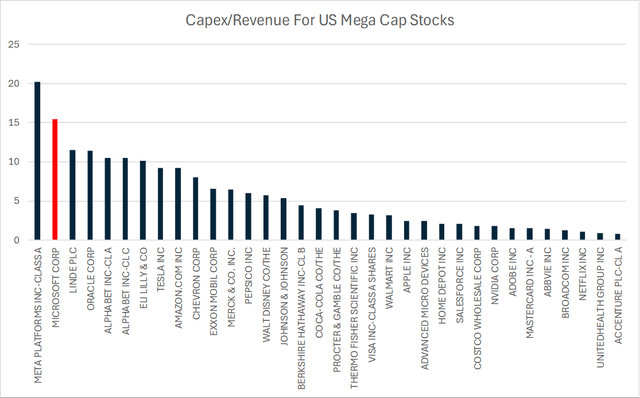
Microsoft trades with a trailing PE ratio of 38x which puts it in the 84th percentile of valuations going back to 1992. At its previous valuation peak in 1999, Microsoft was generating significantly more free cash flow than earnings as capex was minimal, equivalent to just 3% of revenues. This figure has since risen to over 15%. This is the second highest ratio of all US mega cap stocks, behind only Meta. As a result, when measured on a free cash flow basis, Microsoft’s valuations are significantly higher than the PE ratio suggests. At over 47x, the price to free cash flow ratio ranks in the 96th percentile going back to 1992.
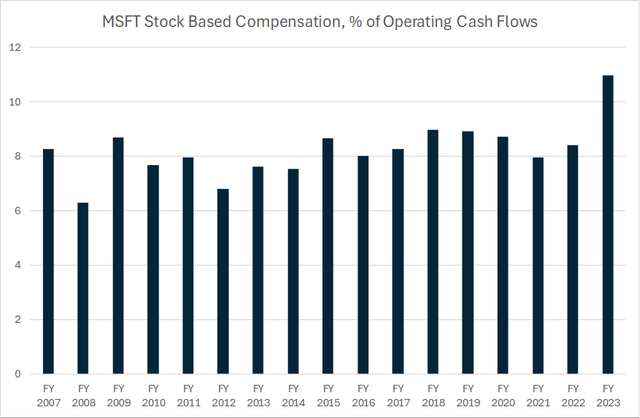
Furthermore, Microsoft has seen a surge in stock based compensation over recent years, which has risen to over $10bn over the past 12 months as the AI race has forced up skilled labour costs while the high stock price has made share dilution an attractive form of compensation. As a share of operating cash flows stock based compensation continues to rise and now sits at 11%.
If we add these back as an expense, the company trades at a price to free cash flow multiple of 55x. Represented as a yield, this is just 1.8%, which compares to 1.6% at its 2000 market peak. This 1.8% yield is below the real yield on 10-year US TIPS for the first time since 2000.
Uniquely Overvalued Given Its Huge Size
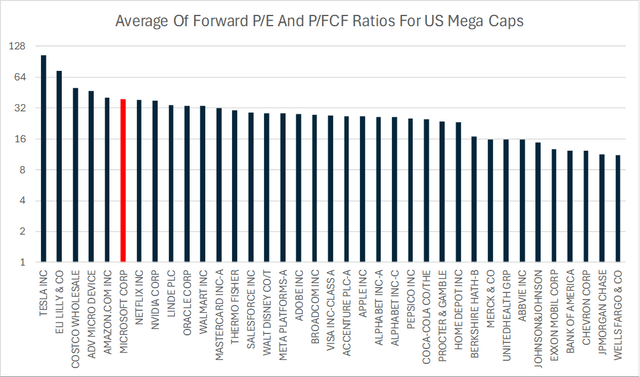
Microsoft’s stock is not only extremely expensive relative to its own history but also relative to other US mega cap stocks. The chart below shows the valuation multiples for the S&P500 stocks with a market capitalisation of above $200bn. The multiples are based on an average of the forward PE ratio and the forward price to free cash flow ratio, excluding stock based compensation. Using forward estimates allows for a fairer comparison among stocks, given the strong growth outlook for smaller companies. On this basis, Microsoft ranks in 6th position out of the 37 largest US stocks, behind only Tesla (TSLA), Eli Lilly (LLY), Costco (COST), Advanced Micro Devices (AMD), and Amazon (AMZN).
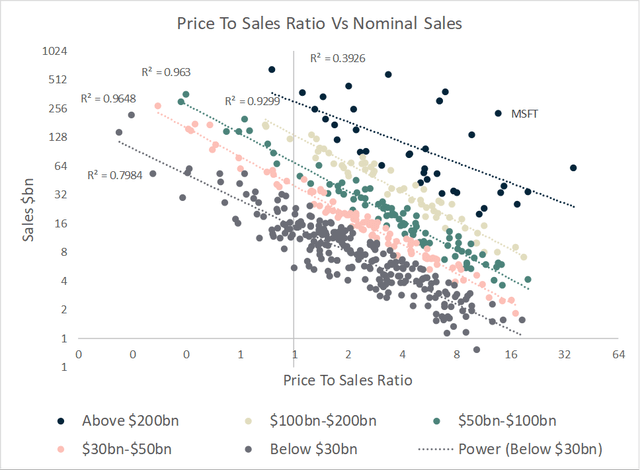
As I argued recently, there is overwhelming evidence to show that over the long term, large companies grow at a slower pace than small ones. This explains why investors have consistently applied lower multiples to large stocks relative to small ones. The chart below shows the correlation between the price-to-sales ratio and nominal sales for the stocks in the S&P500, separated into 5 different size cohorts. For each of the cohorts, there is a strong negative relationship between sales multiples and sales value, which reflects two factors; first, the tendency for companies with large sales to have lower profit margins, and secondly, the tendency for companies with large sales to grow more slowly over time. Microsoft stands out on this chart as commanding an extremely high price to sales ratio despite being one of the largest companies by revenues.
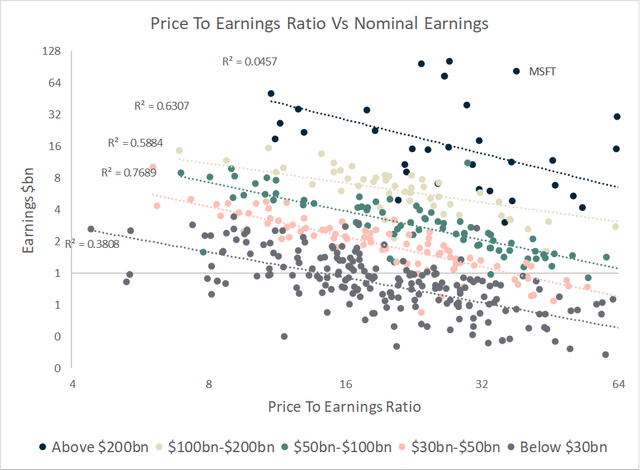
The next chart shows the same as the above, but replacing sales with earnings. The inverse correlations are not quite as strong, but there is still a clear tendency for stocks with large earnings to trade at lower PE multiples to reflect slower growth expectations. Once again, Microsoft stands out as being extremely profitable yet still trading at the top end of the valuation scale.
Unrealistic Growth Rates Required
In order for Microsoft to generate adequate returns for shareholders over the long term, it would need to not only need to see continued strong growth rate of sales and earnings, but actually see an acceleration in them. For example, let’s assume that the required rate of return on MSFT is 10% in line with the long-term return on US equities. With a free cash flow yield of around 1.8%, this means that Microsoft will have to grow free cash flows by 8.2% annually indefinitely, and this is assuming that all these free cash flows are returned to shareholders in the form of buybacks or dividend payments. For context, the long term peak-to-peak growth rate of Microsoft’s free cash flows has averaged 7.5%.
Microsoft Free Cash Flows (Bloomberg)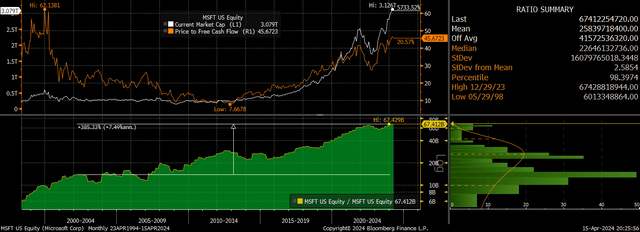
Microsoft’s free cash flow ex-SBC currently represent 3.9% of total S&P500 free cash flows. If we assume that the S&P500 free cash flows grow in line with nominal GDP growth of 4%, which itself is highly optimistic given slowing trend real GDP growth and rising margin pressures, and that Microsoft manages to grow free cash flows by 8.2%, the company would quite quickly command an unfeasible share of the overall economy’s profit. Its share of free cash flows would rise to 5.7% by 2034, 8.6%, by 2044, and 12.8% by 2054. There is no precedent for a single company coming anywhere close to this level of dominance over the US stock market.
The scary part for MSFT investors is that even if free cash flows do manage to grow in excess of 8% annually for a full three decades and then growth slows to 4% thereafter, the present value of the stock, assuming a 10% required rate of return would be below current levels. Of course, the above figures are highly sensitive to changes in the required rate of return, but even assuming a measly 7% required rate of return, just over 2% above Treasury yields, MSFT would still be overvalued under the above growth assumptions as shown below:
| Required Rate of Return | 10.0% | 8.5% | 7.0% |
| Current Market Cap, USDbn | 3154 | 3154 | 3154 |
| Current FCF Ex SBC | 57.8 | 57.8 | 57.8 |
| FCF Yield | 1.8% | 1.8% | 1.8% |
| Growth Rate For Next 30 Years | 8.2% | 6.7% | 6.7% |
| Growth Rate Thereafter | 4.0% | 4.0% | 4.0% |
| FCF in 2054, USDbn | 609 | 401 | 401 |
| Fair Value Market Cap in 2054, USDbn | 10158 | 8908 | 13362 |
| PV Fair Value Market Cap, USDbn | 964 | 1285 | 2948 |
| % Decline Required To Return To FV | -22% | -21% | -2% |
Some readers will undoubtedly feel that relying on assumptions about growth and the required rate of return many decades from now to take a view on a stock today is pointless, as such figures are unknowable. However, it is the very fact that investors do not tend to concern themselves with long-term considerations when stocks have performed so well in the recent past that makes current conditions concerning. Investors now unconsciously rely on unfeasibly high growth rates and low required rates of return for several decades into the future to justify current equity values.
Summary
Widespread optimism surrounding Microsoft has seen its valuation multiples rise to extreme levels, particularly on a free cash flow basis as the company has ramped up investment spending. Microsoft now stands out as being expensive even when compared to its mega cap peers, bucking the market trend of highly profitable companies tending to trade at below market multiples. Investors now rely on unfeasibly high growth rates and low required rates of return for decades into the future.
Analyst’s Disclosure: I/we have a beneficial short position in the shares of MSFT either through stock ownership, options, or other derivatives. I wrote this article myself, and it expresses my own opinions. I am not receiving compensation for it (other than from Seeking Alpha). I have no business relationship with any company whose stock is mentioned in this article.
Seeking Alpha’s Disclosure: Past performance is no guarantee of future results. No recommendation or advice is being given as to whether any investment is suitable for a particular investor. Any views or opinions expressed above may not reflect those of Seeking Alpha as a whole. Seeking Alpha is not a licensed securities dealer, broker or US investment adviser or investment bank. Our analysts are third party authors that include both professional investors and individual investors who may not be licensed or certified by any institute or regulatory body.

