Summary:
- NFLX’s streaming prospects remain robust as the macroeconomic outlook improves, supported by a strong labor market and increasing discretionary spending.
- It continues to dominate the streaming market, with a consistently growing loyal membership base and stable average revenue per member, contributing to its stellar operating income margins.
- The shift in ad spending from linear TV to online streaming is expected to continue, with NFLX benefiting from the trend as the clear leader in the industry.
- However, with the stock already trading way above its fair value, readers may want to wait for a moderate retracement before adding this long-term winner in their growth portfolios.
marrio31/iStock via Getty Images
We previously covered Netflix, Inc. (NASDAQ:NFLX) in October 2023, discussing how the management had steadily delivered profitable growth while offering optimistic forward guidance through FY2024.
Combined with its dominance in the global streaming market and growing subscriber base/ stable ARM, we had continued to rate the stock as a Buy then.
In this article, we shall discuss why NFLX’s streaming prospects may remain robust as the macroeconomic outlook lifts, significantly aided by the robust labor market as discretionary spending grows.
Combined with the excellent FQ4’23 performance and impressive FQ1’24 guidance, the stock has also pulled forward part of its upside potential, with interested investors better off waiting for more attractive entry points despite the streaming company’s (prospective) long-term success.
The Streaming Investment Thesis Remains Dominated By Netflix
For now, NFLX has reported an excellent FQ4’23 earnings call, with revenues of $8.83B (+3.3% QoQ/ +12.5% YoY), operating income of $1.49B (-21.9% QoQ/ +172% YoY), and operating margin of 16.9% (-5.5 points QoQ/ +9 YoY).
Much of the robust Free Cash Flow generation of $1.58B (-15.9% QoQ/ +376.2% YoY) has also been returned to long-term shareholders, with the management retiring 7.36M shares over the past twelve months.
This has led to the sustained improvements in its adj EPS performance to $2.11 (-43.4% QoQ/ +1658.3% YoY) as its overall profitability grows.
It is apparent by now that NFLX continues to dominate the global streaming industry, as observed in the expansion in its operating income margins to 20.6% by FY2023 (+2.8 points YoY), as most of its direct competitors struggle to break even.
The list includes Disney (DIS) with negative D2C operating margins of -12.5% in FY2023 (+6.5 points YoY), Comcast (CMCSA) with negative D2C gross margins of -186.9% through FQ3’23 (-72.7 points YoY), Warner Bros. Discovery, Inc. (WBD) at D2C adj EBITDA of 2% through FQ3’23 (+30.5 points YoY), and Paramount (PARA) at D2C adj OIBDA margins of -24.1% through FQ3’23 (+11.3 points YoY).
And much of NFLX’s tailwinds are attributed to the growing Global Streaming Paid Memberships to 260.28M (+13.13M QoQ/ +29.53M YoY) and stable Average Revenue per Membership [ARM] of $33.93 by the latest quarter (-1.8% QoQ/ inline YoY).
Despite the elevated inflationary pressures and the restart of federal student loan repayment from October 2023 onwards, it is apparent that NFLX’s offerings remain highly attractive to its loyal members in the US, with paid memberships still growing to 80.13M (+2.81M QoQ/ +5.83M YoY) and ARM to $16.64 (+2.1% QoQ/ +2.5% YoY).
It is reassuring for NFLX investors indeed (us included), when the streaming company’s top/ bottom line driver is still delivering impressive results during a time of uncertain macroeconomic environment, further aided by the sustained increases in its paid memberships in the EMEA, LATAM, and APAC regions.
Shift In TV Viewing
With NFLX, Alphabet’s (GOOG) YouTube, and ByteDance’s (BDNCE) TikTok spearheading the transition from linear TVs to online streaming, it is unsurprising that legacy companies find it extremely difficult to catch up.
By December 2023, cable/ broadcast TV only accounts 51.7% of TV viewing share (-1.5 points MoM/ -3.9 YoY), as streaming gains to 35.9% (-0.2 point MoM/ +3.1 YoY). NFLX has also expanded its streaming market share to 7.7% at the same time (+0.3 points MoM/ +0.2 YoY), second only to YouTube’s 8.5% (-0.5 points MoM/ -0.2 YoY).
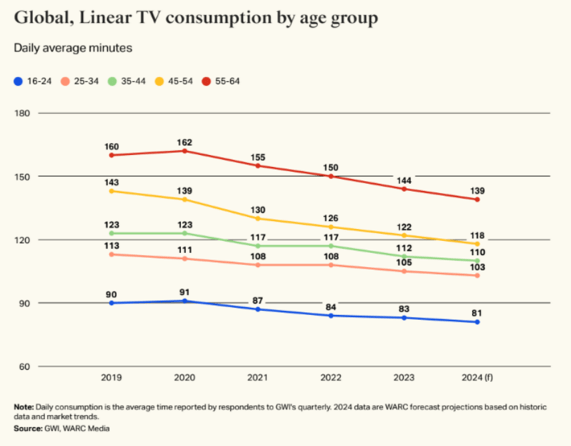
Global Linear TV Consumption
VideoWeek
The same trend is expected to persist in 2024, with the global linear TV consumption likely to further decline as streaming grows in demand, with NFLX standing to benefit from the shift in advertiser spending as well.
For example, linear TV ad spend has decreased by -5.4% YoY in 2023, “double the rate of decline in viewing,” partly attributed to the increased introduction of ad-supported streaming tiers by multiple players.
With NFLX already reporting 23M ad-supported member households by the latest quarter, with the plan “accounting for 40% of all new sign-ups,” we believe that its leadership position in the streaming industry may be a great long-term tailwind indeed.
NFLX Valuations
And it is for these reasons that we can understand why NFLX continues to deserve its premium growth valuations, with a FWD EV/ EBITDA of 26.25x and a FWD P/E of 33.69x, compared to its 1Y mean of 22.85x/ 30.52x and sector median of 8.93x/ 15.85x, respectively.
Even when compared to its direct peers, Mr. Market continues to view the NFLX stock more favorably, including DIS at FWD EV/ EBITDA of 12.48x, CMCSA at 7.13x, WBD at 8.88x, and PARA at 10.60x.
NFLX’s uptrend trend is significantly aided by the recovering market sentiments as well, as the inflation cools and the Fed signals a potential pivot from Q1’24 onwards.
While an economic normalization is only expected by 2026, it is apparent that the worst may be behind us, with the labor market and discretionary spending still robust by the end of 2023.
The Consensus Forward Estimates
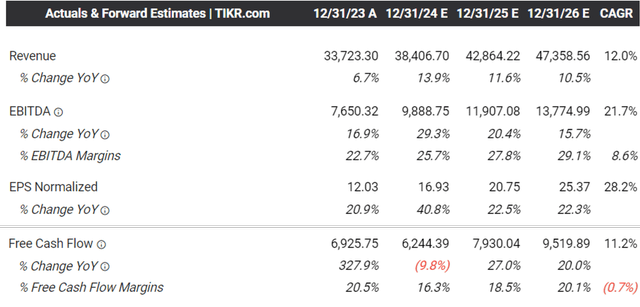
NFLX’s outperformance is unlikely to stop here as well, with its profitable growth trend still expected to continue through FY2026, with the consensus projecting top/ bottom line CAGRs of +12%/ +28.2%. This builds upon its historical expansion of +21.1%/ +60.9% between FY2016 and FY2023, respectively.
On the one hand, based on its recent FY2023 EPS of $12.03 (+20.9% YoY) and the FWD P/E of 33.69x, the stock appears to be trading well above its fair value of $405.20.
On the other hand, based on the consensus FY2026 adj EPS estimates of $25.37, we are looking at a long-term price target of $854.70, offering interested investors with the excellent upside potential of +49.8%.
So, Is NFLX Stock A Buy, Sell, or Hold?
NFLX 5Y Stock Price
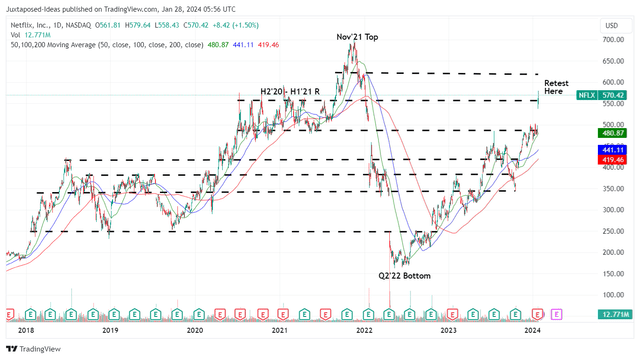
Combined with the excellent FQ1’24 midpoint guidance with revenues of $9.25B (+4.7% QoQ/ +13.3% YoY) and adj EPS of $4.49 (+112.7% QoQ/ +55.9% YoY), it is unsurprising that NFLX has pulled forward part of its upside potential, with the stock rallying by +15.8% since the recent earnings call.
While the recent recovery is well deserved, it remains to be seen if the overly bullish sentiments may be sustained ahead, especially due to the minimal margin of safety at current levels.
As a result of the potential volatility, while we believe that NFLX remains a long-term winner, we prefer to re-rate the stock as a Hold here. Particularly, investors may want to wait for a moderate pullback before adding, preferably at its previous support levels of $490 for an improved upside potential.
Do not chase this rally here.
Analyst’s Disclosure: I/we have a beneficial long position in the shares of NFLX, GOOG either through stock ownership, options, or other derivatives. I wrote this article myself, and it expresses my own opinions. I am not receiving compensation for it (other than from Seeking Alpha). I have no business relationship with any company whose stock is mentioned in this article.
The analysis is provided exclusively for informational purposes and should not be considered professional investment advice. Before investing, please conduct personal in-depth research and utmost due diligence, as there are many risks associated with the trade, including capital loss.
Seeking Alpha’s Disclosure: Past performance is no guarantee of future results. No recommendation or advice is being given as to whether any investment is suitable for a particular investor. Any views or opinions expressed above may not reflect those of Seeking Alpha as a whole. Seeking Alpha is not a licensed securities dealer, broker or US investment adviser or investment bank. Our analysts are third party authors that include both professional investors and individual investors who may not be licensed or certified by any institute or regulatory body.


