
Summary:
- Netflix’s stock has surged by over 80% since we last provided coverage. Some might consider the stock overbought. However, we argue that additional upside is in store.
- NFLX has shown robust growth in LATAM. Moreover, its UCAN segment sets a base for advertising revenue.
- APAC growth has slowed in recent quarters. Despite its slowing growth and rising competition, China’s stimulus package provides a turnaround opportunity to APAC.
- Our valuation of Netflix’s stock suggests it is an undervalued asset with robust ordinary shareholder return metrics.
Kathrin Ziegler/DigitalVision via Getty Images
Netflix, Inc.’s (NASDAQ:NFLX) stock has surged by over 80% since we last covered it in September 2023. However, much of the stock’s momentum has arguably derived from its high-beta exposure to a broad-based stock market rally. Therefore, the question naturally becomes: Is Netflix overvalued, or will its compelling run continue?
Pearl Gray’s Latest NFLX Rating (Seeking Alpha)
We looked at numerous influencing variables to address the central question; here is what we discovered.
Operating Review
Headline Figures
Netflix’s headline results reflect sustained momentum. For example, Netflix delivered $9.56 billion in second-quarter revenue, a 16.8% year-over-year increase. Furthermore, Netflix’s second-quarter operating profit margin increased to 27.2%, showing its price leadership and supplier bargaining power advantages.
Income Statement (Netflix)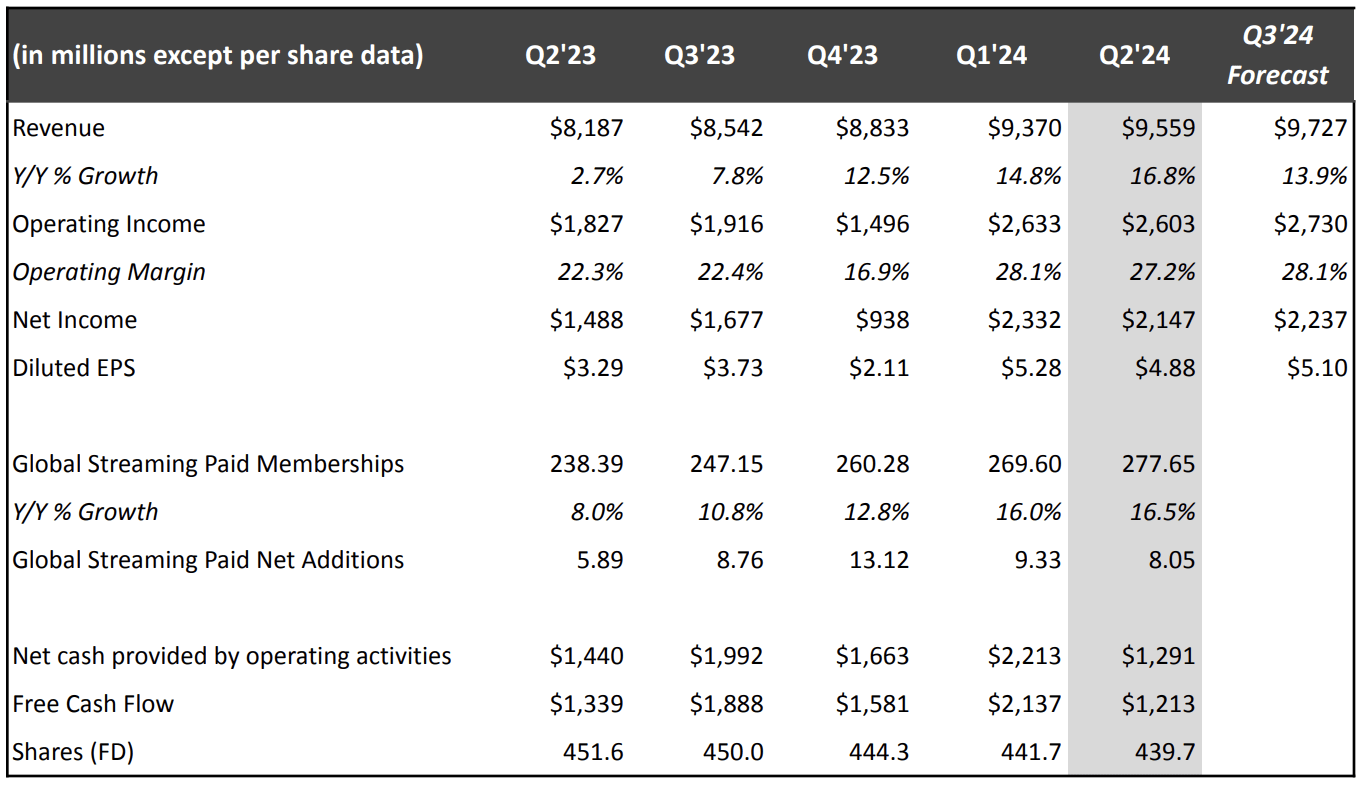
A Look At Segments
Netflix’s UCAN segment remains its bedrock, generating about 45% of its revenue mix. The segment added to its solid performance since our latest coverage by delivering $4.296 billion in second-quarter earnings, a 7% year-over-year increase.
UCAN’s paid net additions have slowed in recent quarters. However, the segment’s paid memberships and revenue per user have accelerated. UCAN generates higher revenue per user than its other segments, lending it revenue-smoothing abilities. Moreover, high revenue per user sets a base for Netflix’s advertising business.
| UCAN (in millions) | Q2’23 | Q3’23 | Q4’23 | Q1’24 | Q2’24 |
| Revenue | $3599 | $3735 | $3931 | $4224 | $4296 |
| Paid Memberships | 75.57 | 77.32 | 80.13 | 82.66 | 84.11 |
| Paid Net Additions | 1.17 | 1.75 | 2.81 | 2.53 | 1.45 |
| Average Revenue Per Member | $16 | $16.29 | $16.64 | $17.30 | $17.17 |
| Y/Y Growth% | 0% | 0% | 3% | 7% | 7% |
| F/X Neutral Y/Y% Growth | 1% | 0% | 3% | 7% | 7% |
Source: Author, Data From Netflix
Netflix’s global expansion story is worth watching as it provides a renewed growth story. The streaming giant generated around $1.2 billion in second-quarter revenue in LATAM, adding to its comprehensive FX-neutral growth.
Given the high regional GDP growth rates, we expect LATAM’s top-line growth to sustain into 2025 and beyond. The segment’s subdued average revenue per user remains of concern. However, we anticipate the line item to grow with nominal GDP rates.
| LATAM (in millions) | Q2’23 | Q3’23 | Q4’23 | Q1’24 | Q2’24 |
| Revenue | $1077 | $1143 | $1156 | $1165 | $1204 |
| Paid Memberships | 42.47 | 43.65 | 46.00 | 47.72 | 49.25 |
| Paid Net Additions | 1.22 | 1.18 | 2.35 | 1.72 | 1.53 |
| Average Revenue Per Member | $8.58 | $8.85 | $8.60 | $8.29 | $8.28 |
| Y/Y Growth% | -1% | 3% | 4% | -4% | -3% |
| F/X Neutral Y/Y% Growth | 8% | 8% | 16% | 16% | 24% |
Source: Author, Data From Netflix
The company’s EMEA segment adds additional potential. Regional fx-adjusted growth is flat. However, we believe that Netflix will optimize its content through comprehensive data aggregation and downstream enhancements. In essence, the company needs time to understand its market. Netflix could experience accelerated growth when a granular understanding of the market has been achieved.
| EMEA (in millions) | Q2’23 | Q3’23 | Q4’23 | Q1’24 | Q2’24 |
| Revenue | $2562 | $2693 | $2784 | $2958 | $3008 |
| Paid Memberships | 79.81 | 83.76 | 88.81 | 91.73 | 93.96 |
| Paid Net Additions | 2.43 | 3.95 | 5.05 | 2.92 | 2.24 |
| Average Revenue Per Member | $10.87 | $10.98 | $10.75 | $10.92 | $10.80 |
| Y/Y Growth% | -3% | 2% | 3% | 0% | -1% |
| F/X Neutral Y/Y% Growth | -1% | -2% | -1% | 0% | 1% |
Source: Author, Data From Netflix
APAC delivers about 11% of Netflix’s revenue and provides a turnaround opportunity. Segmental growth is slow. However, China is injecting around $1.07 trillion into its economy through a stimulus package. Therefore, we believe China’s interim consumer sentiment will improve, lending Netflix’s APAC segment a turnaround opportunity.
A judgment call of APAC’s negative growth suggests rising competition and questionable market penetration. However, APAC’s population density provides scope to numerous market participants. Moreover, Netflix could improve its organic growth once it has a more granular understanding of its end market.
| APAC (in millions) | Q2’23 | Q3’23 | Q4’23 | Q1’24 | Q2’24 |
| Revenue | $919 | $948 | $963 | $1023 | $1052 |
| Paid Memberships | 40.55 | 42.43 | 45.34 | 47.50 | 50.32 |
| Paid Net Additions | 1.07 | 1.88 | 2.91 | 2.16 | 2.83 |
| Average Revenue Per Member | $7.66 | $7.62 | $7.31 | $7.35 | $7.17 |
| Y/Y Growth% | -13% | -9% | -5% | -8% | -6% |
| F/X Neutral Y/Y% Growth | -7% | -6% | -4% | -4% | -3% |
Source: Author, Data From Netflix
Overlooked Factors
Advertising Revenue
Some might oppose Netflix’s advertising strategy. However, we think the strategy will lead to broad-based revenue growth. Remember, Netflix has a tier-based approach, which avoids bombarding its subscribers with unaligned advertising.
Netflix didn’t report its advertising business on a standalone basis (in Q2). However, it stated that its member base increased by 34% quarter-over-quarter. The company’s exponential member base growth illustrates solid early-stage uptake, which we are trivially enthusiastic about. Moreover, I reiterate that Netflix is a powerhouse with significant data aggregation abilities. Thus, its advertising will likely align with its end market instead of being an “in your face” concept.
Product and Content Partnerships
Netflix’s substantial cash position probably equates to a noteworthy product development budget. Anecdotal observation suggests that Netflix’s content partnerships have evolved. Whether its content partnerships will optimize viewing remains debatable. However, we believe a broader reach won’t hurt.
Furthermore, Netflix’s robust brand name provides it access to large-scale business-to-business partnership programs. For example, its direct accessibility on various hardware devices allows additional exposure and user uptake.
Popular Under Teenagers’ Market
Piper Sandler recently researched teenage consumer behavior. The report studied over 63 million data points, providing insight into emerging consumer trends (teenagers are tomorrow’s consumers).
Netflix remains the top streaming choice for teenagers. Will this popularity be sustained? Only time will tell, but the solid uptake suggests that Netflix has an emerging growth opportunity.
Headwinds
The Competitive APAC Landscape
Netflix possesses a robust streaming market share. However, APACA market participants like iQIYI (IQ), Tencent Video, and Le.com threaten Netflix’s regional market share. This comes concurrent with Netflix’s negative regional growth rate, which is likely no coincidence.
APAC Competition (PRENSARIO ZONE)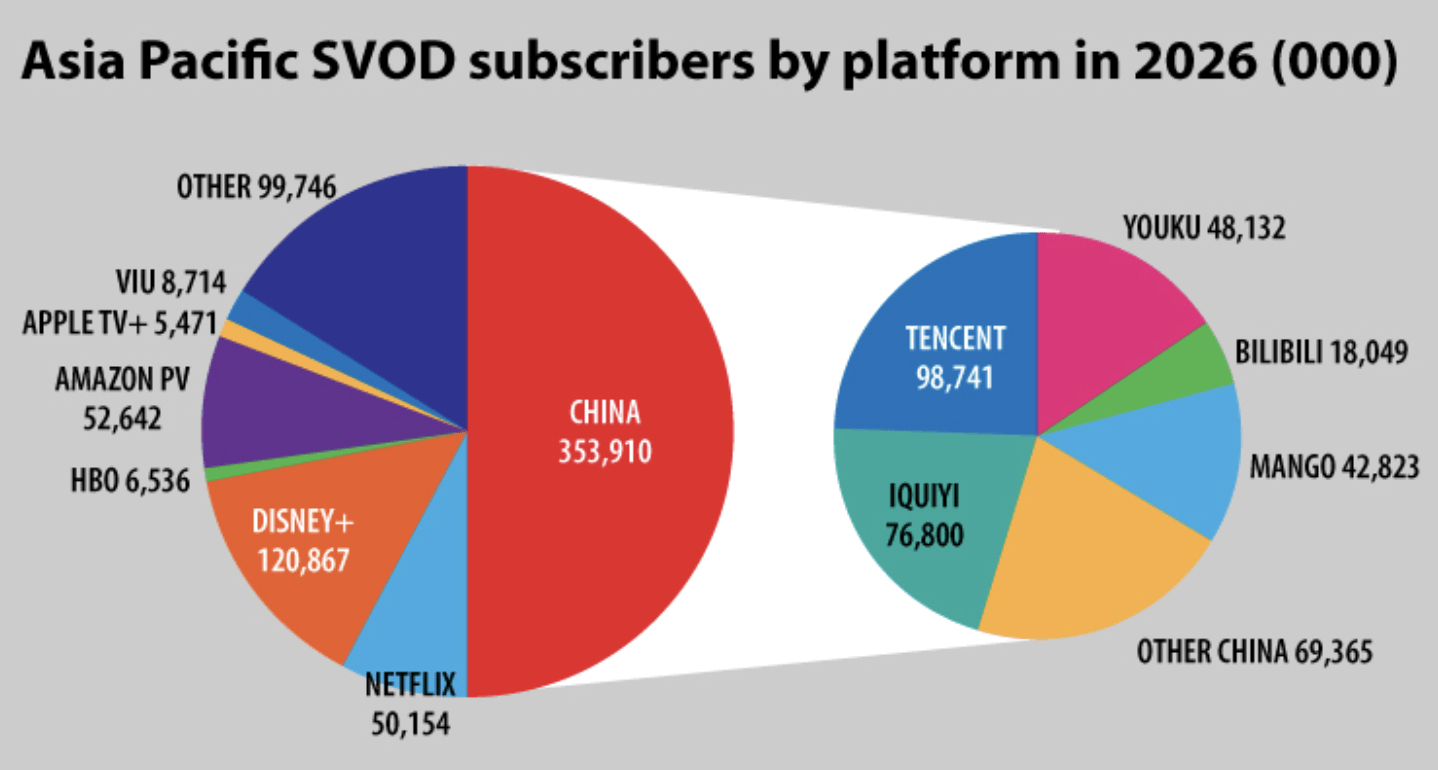
We could see a similar trend emerge in the United States as middle-market players have gained ground. Coalition tactics might occur to dampen Netflix’s market share.
Netflix’s U.S. Streaming Volume (Nielsen)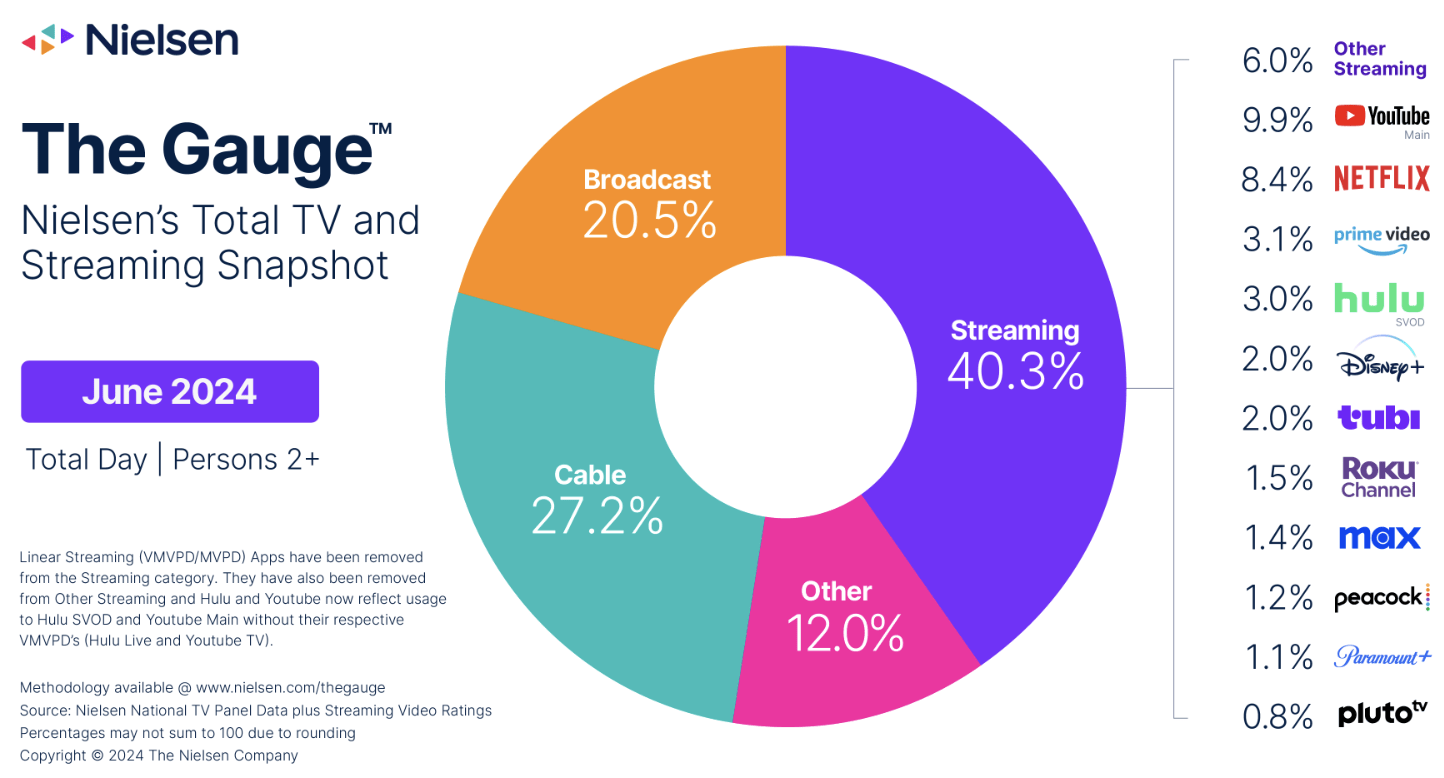
Managing A Global Business Can Lead To Inefficiencies
An overlooked risk factor is Netflix’s global operational challenges.
Managing a global company can be challenging due to segmental resource allocation, foreign exchange hedging, and enhanced budget requirements (to stay competitive in each market). While a global presence can introduce synergies, it holds operational challenges.
Valuation
CAPM Vs. ROIC
A stock’s CAPM reflects the returns ordinary shareholders demand for the risk taken. On the other hand, the return on invested capital and return on equity metrics convey a company’s real returns. Netflix has a ROE of 31.57% and an ROIC of 19.67%, both above the company’s CAPM of 19.56%.
These observations don’t guarantee that Netflix is undervalued. However, they communicate that shareholders’ risk-based expectations are being met.

Extended P/E
The price-to-earnings expansion formula provides a valuable guidepost when assessing a stock’s valuation outlook.
Our application of the formula suggests that Netflix is undervalued by about 52%. Other valuation techniques will likely point to different values. However, as mentioned, we are merely looking at a guidepost here.
| Metric | Value |
| 5-Y Average P/E | 58.02x |
| EPS Estimate For FY 2024 | $19.05 |
| Closing Price On 09/10/2024 | $727.43 |
| Price Target (Rounded) | $1105 |
Source: Author, Data From Market Screener & Yahoo Finance
Share Repurchases
Netflix executed $1.6 billion in share repurchases in its second quarter. The company’s current repurchase plan has $5 billion in remaining capacity, which, if executed, can lower investors’ cost basis, allowing natural value additivity. Moreover, lower equity (in the firm’s capital structure) can reduce Netflix’s cost of capital, in turn providing its shareholders with an enhanced residual value framework.
Wrap-Up
Netflix’s year-over-year surge might tempt many to consolidate their profits by selling the stock. However, we argue that additional upside is in store amid resilient fundamental growth, overlooked value drivers, and promising valuation metrics.
Although risks such as rising U.S. middle-market and APAC competition exist, we remain bullish about Netflix’s prospects.
Analyst’s Disclosure: I/we have no stock, option or similar derivative position in any of the companies mentioned, and no plans to initiate any such positions within the next 72 hours. I wrote this article myself, and it expresses my own opinions. I am not receiving compensation for it (other than from Seeking Alpha). I have no business relationship with any company whose stock is mentioned in this article.
Kindly note that our content on Seeking Alpha and other platforms doesn't constitute financial advice. Instead, we set the tone for a discussion panel among subscribers. As such, we encourage you to consult a registered financial advisor before committing capital to financial instruments.
Seeking Alpha’s Disclosure: Past performance is no guarantee of future results. No recommendation or advice is being given as to whether any investment is suitable for a particular investor. Any views or opinions expressed above may not reflect those of Seeking Alpha as a whole. Seeking Alpha is not a licensed securities dealer, broker or US investment adviser or investment bank. Our analysts are third party authors that include both professional investors and individual investors who may not be licensed or certified by any institute or regulatory body.