Summary:
- Netflix focuses on engagement to drive profits, with a strong global content library attracting millions of subscribers.
- The company’s content investments have paid off, with impressive free cash flow gains and a focus on international content.
- Netflix’s event model strategy extends to sports, with a focus on profitable streaming at scale and global expansion.
Wachiwit
Introduction
Per my April article, Netflix (NASDAQ:NFLX) (NEOE:NFLX:CA) continues thriving as they focus on engagement. Since that time, we have the 2H23 viewing report which was released in May 2024 along with new numbers from Nielsen’s The Gauge through June as well as Netflix’s 2Q24 filings.
Over the years, Netflix has invested heavily, building up a prodigious global content library which attracts hundreds of millions of subscribers and keeps them engaged. My thesis is that Netflix is well positioned from investments and past lessons such that they are able to focus on engagement in a cost-effective manner which brings about profits.
Content Investments
Focusing on streaming early when competition was less severe, Netflix made prodigious content investments over the years and these investments have positioned them well. Creating original content requires vast sums of cash and Netflix had cumulative free cash flow (“FCF”) losses of $10.8 billion from 3Q14 to 4Q19! Things started looking better during 2020 and 2021 as cumulative FCF gains from 1Q20 to 4Q21 were $1.8 billion. We haven’t seen a negative FCF quarter since 4Q21 as that was about the time when Netflix reached tremendous scale such that the massive content costs could be spread across more members with an even more massive revenue base, making the economics easier. Cumulative FCF gains from 1Q22 to 2Q24 have been impressive at $11.9 billion:
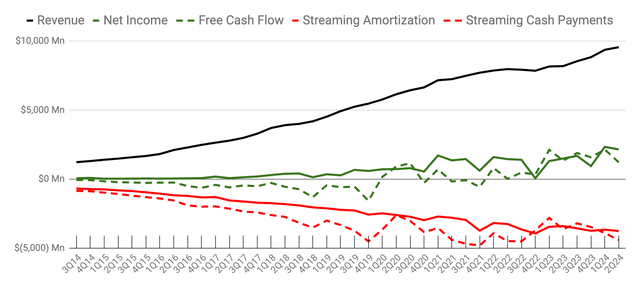
Netflix FCF (Author’s spreadsheet)
Also, impressive is the way 2023 FCF matched up against accrual numbers. In 2023, we saw FCF of $6.9 billion relative to net income of $5.4 billion.
A March article from Ampere Analysis shows the way Netflix has increased their investments in content over the years. Unlike many Hollywood companies who make most of their content investments in the US, Netflix has gone through many lessons in terms of how to find content investment opportunities all over the world:
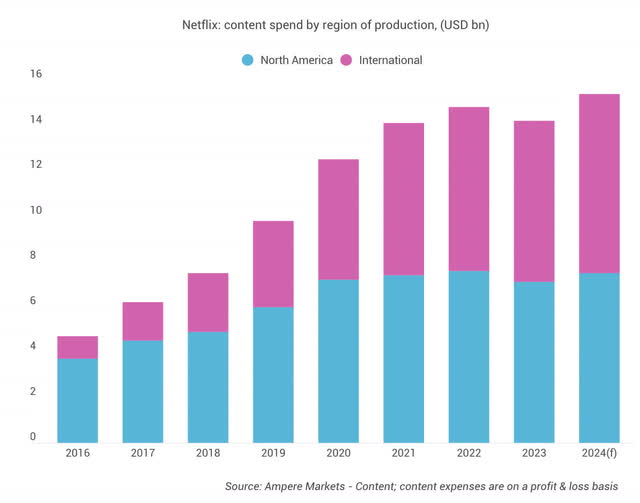
Netflix content spend (Ampere Analysis)
Per a March 2024 Variety article, Netflix often gets more bang for their buck with the International content spend above than with the North America content spend:
Korean series “Squid Game” remains the gold standard in this regard, becoming one of Netflix’s most watched titles ever with a budget of around $21 million – less than a tenth that of the reported production cost of “Stranger Things” Season 4.
Netflix released their 2H23 viewing report on May 23rd, and it shows which of their content investments have brought in the most engagement. It is sorted by a new column called “views” which is the total hours of viewing divided by the runtime. This new column is important in terms of seeing the number of members a title reaches because titles with short runtimes get lost in the mix if we only look at the raw “hours viewed” column. For example, CoComelon: Season 8 has 40,100,000 hours viewed, but it is in the #8 tv spot ahead of Virgin River: Season 5 in the #9 tv spot with 331,400,000 hours viewed. The reason for this is because the runtime of the former is just 1:04 while the runtime of the latter is 9:16. As such, the “views” number for the former is 37,600,000 while the views number for the latter is 35,800,000.
Another way of understanding the new “views” column is with a thought experiment. Assume we have 10 members who always watch titles all the way through. If they all watch a 1-hour show, then we have 10 hours viewed divided by 1 hour of runtime, so the “views” column shows 10. If they all watch a 2-hour show, then we have 20 hours viewed divided by 2 hours of runtime, so the “views” column also shows 10. In this way, the new “views” column is a better representation of the number of members seeing a show, whereas the older “hours viewed” column is a better representation of raw hours streamed.
In this article, we are using the number from the new “views” column when talking about viewing. Here are the top 10 tv titles for 2H23:
|
Title |
Release Date |
Hours Viewed |
Runtime |
Views |
|
ONE PIECE: Season 1 |
2023-08-31 |
541,900,000 |
7:34 |
71,600,000 |
|
Dear Child: Series / Liebes Kind: Miniserie |
2023-09-07 |
252,800,000 |
4:49 |
52,500,000 |
|
Who is Erin Carter?: Limited Series |
2023-08-24 |
286,200,000 |
5:43 |
50,100,000 |
|
Lupin: Part 3 |
2023-10-05 |
274,300,000 |
5:31 |
49,700,000 |
|
The Witcher: Season 3 |
2023-06-29 |
363,800,000 |
7:36 |
47,900,000 |
|
Sex Education: Season 4 |
2023-09-21 |
374,700,000 |
8:06 |
46,300,000 |
|
Beckham: Limited Series |
2023-10-04 |
208,500,000 |
4:45 |
43,900,000 |
|
CoComelon: Season 8 |
2023-04-10 |
40,100,000 |
1:04 |
37,600,000 |
|
Virgin River: Season 5 |
2023-09-07 |
331,400,000 |
9:16 |
35,800,000 |
|
The Lincoln Lawyer: Season 2 |
2023-07-06 |
292,300,000 |
8:11 |
35,700,000 |
Here are the top 10 movie titles for 2H23, and they’re all available globally except Hidden Strike and The Boss Baby:
|
Title |
Release Date |
Hours Viewed |
Runtime |
Views |
|
Leave the World Behind |
2023-12-08 |
286,300,000 |
2:22 |
121,000,000 |
|
Heart of Stone |
2023-08-11 |
228,400,000 |
2:05 |
109,600,000 |
|
Leo |
2023-11-21 |
171,200,000 |
1:47 |
96,000,000 |
|
Nowhere |
2023-09-29 |
156,600,000 |
1:49 |
86,200,000 |
|
The Out-Laws |
2023-07-07 |
135,500,000 |
1:37 |
83,800,000 |
|
Hidden Strike |
125,900,000 |
1:43 |
73,300,000 |
|
|
Reptile |
2023-09-29 |
165,600,000 |
2:16 |
73,100,000 |
|
The Killer |
2023-11-10 |
135,600,000 |
2:00 |
67,800,000 |
|
Family Switch |
2023-11-30 |
109,400,000 |
1:46 |
61,900,000 |
|
The Boss Baby |
100,700,000 |
1:38 |
61,700,000 |
Citing the numbers in the above report, Netflix discusses the power of their international content, saying non-English titles are responsible for almost a third of all viewing (emphasis added):
Our non-English shows and movies are very popular with audiences – making up nearly a third of all viewing. Korean (9% of viewing), Spanish (7%) and Japanese (5%) language stories captured the biggest share of viewing outside of English. Stand-outs include Dear Child (53M) from Germany, Forgotten Love (43M) from Poland, Pact of Silence (21M) from Mexico, Mask Girl (19M) from Korea, YuYu Hakusho (17M) from Japan, Berlin (11M) from Spain, and The Railway Men (11M) from India.
Speaking at the May 2024 MoffettNathanson Media, Internet & Communications Conference, Finance VP Spencer Wang said Netflix has proven that streaming at scale can be a profitable business. He talked about interconnected combinations which form their durable advantage. They have a global scale, a large content library and great marketing (emphasis added):
What I mean by that is number one, our reach, so to 270 million paid members, programming for over 0.5 billion people across the world. Number two, a large content library with a lot of variety and quality of titles, married with a discovery and product experience that can best match the right story with members at the right time. And then on top of that, a great marketing team that can then sort of fuel the fandom and the passion around each of these moments. And I think when you take all those together, that’s what enables things like chess sales to skyrocket after Queen’s Gambit or for the F1 to grow in popularity from Drive to Survive or for 3 Body Problem book sales that go off the charts when we release that series.
Event Model Engagement Focus
The event model strategy for Netflix has been in place for some time with respect to live comedy specials. In terms of raw viewing hours, this category doesn’t do well compared to the tv series on the platform. For example, Tom Segura: Sledgehammer Yes was one of the bigger comedy specials in 2H23 but 116 tv titles were listed ahead of it in the 2H23 viewing report as it had 12,200,000 “hours viewed,” a runtime of 1:02 and 11,800,000 “views.” Having said that, not all “views” are equal and Netflix recognizes excitement when members see content from the event model, such that event model efforts are being extended to sports.
Storytelling with sports has been a key strength for Netflix for some time, but the event model ambitions have been more recent. The 2H23 viewing report touts their results with sports storytelling (emphasis added):
Sports has become increasingly popular, amassing a combined 184M views with favorites like BECKHAM (44M), Untold: Johnny Football (14M) and Quarterback (13M).
Co-CEO Ted Sarandos clarified some thoughts with respect to sports engagement in the 2Q24 call. He said it can be difficult to make a profit with sports when an entire season is covered, but Netflix is finding their spots (emphasis added):
Well, hopefully exactly the way we’re doing it by making these Netflix events, not necessarily taking on a lot of tonnage from any one league, but actually making these games – events like having two NFL football games on Christmas Day and two great games, the Chiefs and the Steelers and the Ravens and the Texans, they’re both going to be great games and it really creates a lot of real excitement with the service and it’s one day of football. So when I look at that and I think along those lines, you’d see how we solved for that in our WWE deal, which was economics that we like.
I expect Netflix to continue their expansion into sports. In some ways, this is because Amazon (AMZN) and former NBA player and TNT (WBD) Analyst Charles Barkley have been reminding the world of the unique advantages companies like Amazon and Netflix possess. TNT is suing the NBA because the NBA rejected TNT Sports’ matching rights. Per The Athletic, TNT Analyst Barkley thinks the lawsuit is a bad idea:
“The NBA clearly wanted to break up with us. I don’t want to be in a relationship where I have to sue somebody to be in it. That makes zero sense. If you have to sue somebody to stay in a relationship, do you think that is a healthy relationship?”
TNT Analyst Barkley goes on to talk about the advantages enjoyed by Amazon and Netflix:
“It’s going to all go to streaming in 11 years,” Barkley told The Athletic. “I think this is just a cash grab, but they needed streaming because in 11 years nobody’s going to be able to afford these rights but streaming.
In the fullness of time, Netflix can have even more success with sports than Amazon because Netflix is truly global whereas Amazon isn’t very popular in parts of the world like Latin America where MercadoLibre (MELI) is more prevalent.
Engagement Results
Per Nielsen’s The Gauge, YouTube and Netflix dominate the US streaming market. The Gauge points out that Netflix improved from 7.6% of the US streaming market in May to 8.4% in June due to hits like Bridgerton and Your Honor:
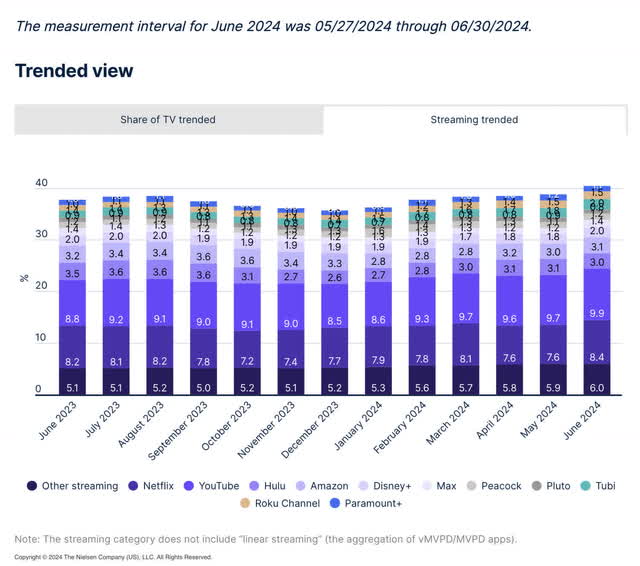
Netflix streaming time (Nielsen’s The Gauge)
Per A July Bloomberg article, Netflix is dominant with respect to the top-10 streaming shows in the US:
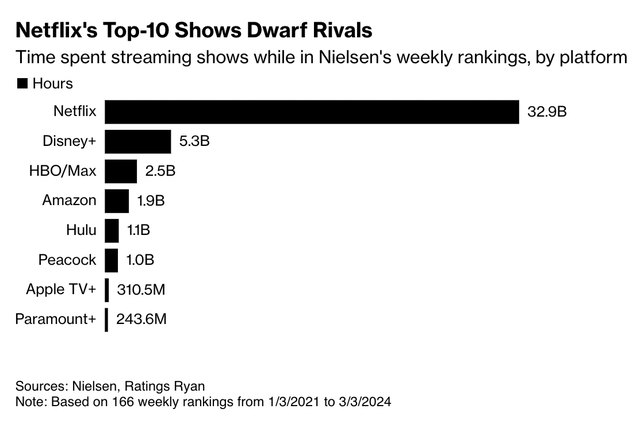
Netflix top-10 (Bloomberg)
Due to Netflix’s high engagement, they enjoy healthy revenue and low churn. We’re getting close to 300 million global members, with a little under 100 million each for UCAN and EMEA and about 50 million each in LATAM and APAC. Global revenue continues to climb as it approaches a quarterly level of $10 billion:
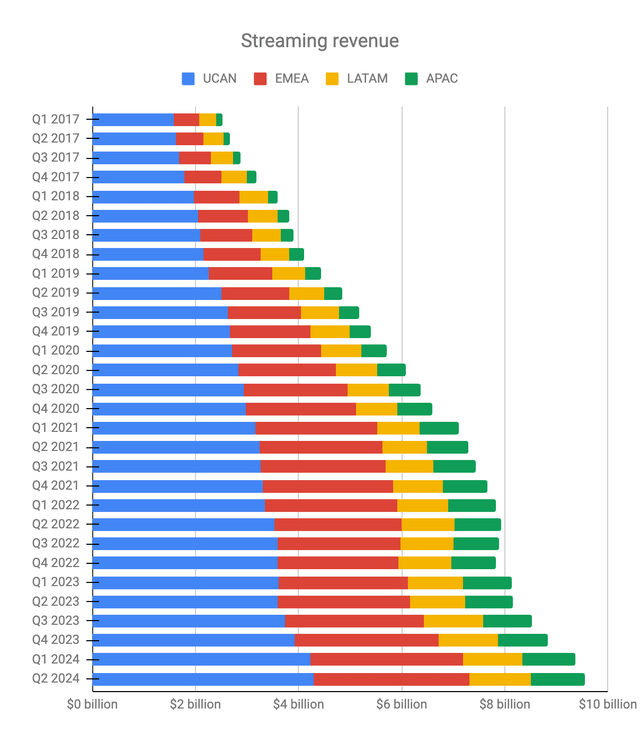
Netflix revenue (Author’s spreadsheet)
Again, Netflix is able to produce a great deal of content overseas in a cost-efficient manner. This along with their massive scale means their cost of revenue is significantly less than their revenue, such that gross profit is high. Scale also helps with operating expense lines such that their operating profit is high as well.
Valuation
Per the 2Q24 letter, Netflix repurchased another 2.6 million shares for $1.6 billion.
In 2023, we saw FCF, net income, operating income, and revenue of $6.9 billion, $5.4 billion, $7 billion, and $33.7 billion, respectively.
In the 2Q24 earnings call, it was repeated that 2024 FCF is expected to be $6 billion. The 2Q24 forecast says full year 2024 revenue should be 14 to 15% above the 2023 level of $33.7 billion. The 2024 operating margin is expected to be 26%. This means for 2024 we could see operating income of $10 billion on revenue of $38.8 billion.
It’s unsettling knowing 2024 FCF is expected to fall from $6.9 billion to about $6 billion as operating income rises from $7 billion to about $10 billion. As such, it was not surprising in the 2Q24 call when Finance VP Spencer Wang relayed a question from Wells Fargo (WFC) analyst Steven Cahall
about whether it is a pull-forward in cash content spend or if there is anything else impacting 2024 FCF guidance. Netflix CFO Spence Neumann answered as follows:
Nothing else impacting it. As we’ve noted – as you noted, we continue to expect approximately $6 billion of free-cash flow for the year. There’s always some uncertainty in terms of timing of things like content spend, sometimes timing of taxes. So that kind of keeps us right now holding at approximately $6 billion, but no other read-through beyond that.
I’m optimistic that FCF will rise in 2025 and be more in line with net income than in 2024. I think it’s reasonable to value Netflix at 25 to 30x the expected operating income level of 2024, which implies a range of $250 to $300 billion.
The 2Q24 10-Q shows 429,164,615 shares as of June 30. Multiplying by the July 27 share price of $631.37 gives us a market cap of $271 billion. The market cap is within my valuation range and I think the stock is a hold for long-term investors.
Analyst’s Disclosure: I/we have a beneficial long position in the shares of NFLX, AAPL, AMZN, DIS, GOOG, GOOGL, LBRDK, PARA, WBD, VOO either through stock ownership, options, or other derivatives. I wrote this article myself, and it expresses my own opinions. I am not receiving compensation for it (other than from Seeking Alpha). I have no business relationship with any company whose stock is mentioned in this article.
Seeking Alpha’s Disclosure: Past performance is no guarantee of future results. No recommendation or advice is being given as to whether any investment is suitable for a particular investor. Any views or opinions expressed above may not reflect those of Seeking Alpha as a whole. Seeking Alpha is not a licensed securities dealer, broker or US investment adviser or investment bank. Our analysts are third party authors that include both professional investors and individual investors who may not be licensed or certified by any institute or regulatory body.
