Summary:
- Nike faces headwinds from higher operating costs and reduced sales guidance, impacting its bottom-line profit.
- The company is investing in technology initiatives to improve efficiency and drive higher growth in the long term.
- While facing challenges, Nike remains a strong brand with the potential for a resurgence in strength by the end of 2024 or the beginning of 2025.
Wirestock
Nike, Inc. (NYSE:NKE) remains a strong brand in the athletic footwear and apparel industry. The stock has recently seen headwinds due to higher operating costs impacting bottom-line profit and reduced guidance from impacted sales. These challenges do not look like they will subside until the end of 2024 or into 2025. Nike continues to look at innovative ways to combat these market pressures and continue to deliver the sustainable growth that the company was accustomed to for its lifetime.
Nike has continued to invest in technology initiatives to innovate across all aspects of its business from supply chain to consumer preferences changes based on artificial intelligence. Investing in these technologies has driven costs higher in the short term, but in the long term, the company should see improved efficiency and higher growth. Increased competition has also been impacting sales for Nike and creating pressure on the company to innovate to maintain its competitive advantage. Aside from competitive pressure on its top line, Nike also continues to face consumer spending declines that many companies face in this market. If interest rates do indeed get lowered this year, consumer spending should return and improve the forecasted sales numbers. By the end of 2024 or the beginning of 2025, Nike stock could see a resurgence in strength.
When considering these current stories about Nike , we need to determine which news topics will have a long-term and ongoing effect on the company and its share price. Nike has seen some market pressures from consumer spending decline and competitors that have impacted sales. This has resulted in a trending decline in Nike’s stock price. Nike has taken action to mitigate these concerns with technological investments and restructuring of the company. As the market turns around and the tech investments begin directly increasing the top line, the company should see a resurgence.
While current news stories, good or bad can sway our opinion about investing in a company, it’s good to analyze the fundamentals of the company and to see where it’s been in the past and in which direction it’s heading.
This article will focus on the long-term fundamentals of the company, which tend to give us a better picture of the company as a viable investment. I also analyze the value of the company versus the price and help you to determine if Nike is currently trading at a bargain price. I provide various situations which help estimate the company’s future returns. In closing, I will tell you my personal opinion about whether I’m interested in taking a position in this company and why.
Snapshot of the Company
A fast way for me to get an overall understanding of the condition of the business is to use the BTMA Stock Analyzer’s company rating score. Nike shows a rating score of 83.75 out of 100. In summary, Nike has strong fundamentals with short-term headwinds that have impacted the company.
Before jumping to conclusions, we’ll have to look closer into individual categories to see what’s going on.
(Source: BTMA Stock Analyzer )
Fundamentals
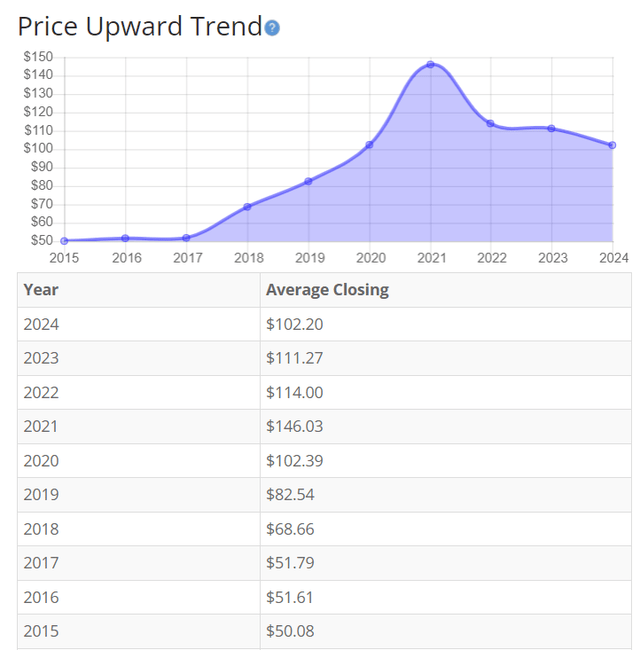
The share price saw a consistent run-up until the recent sales declines resulted in the stock price falling. Competitive pressure and market conditions have caused Nike to reduce guidance for the next quarters of sales. I expect this trend to continue in the short term with a rebound as sales return by the beginning of 2025. Overall, the share price average has grown by about 104.07% over the past 10 years, or a Compound Annual Growth Rate of 8.25%. This is a so-so return. I would expect more if I were holding this well-known brand in my portfolio.
(Source: BTMA Stock Analyzer – Price Per Share History)
Earnings
Earnings have been at an all-time high in the last 9 years. Even with the sales decline guidance and competitive pressure, Nike still has seen strong EPS numbers relative to previous years. Nike has also seen increases in operating expenses with selling general and administrative & technology investments that have eaten into net profit. The recent declining trend is expected to continue, but I do not foresee a drop to previous lows as seen during COVID-19.
BTMA Stock Analyzer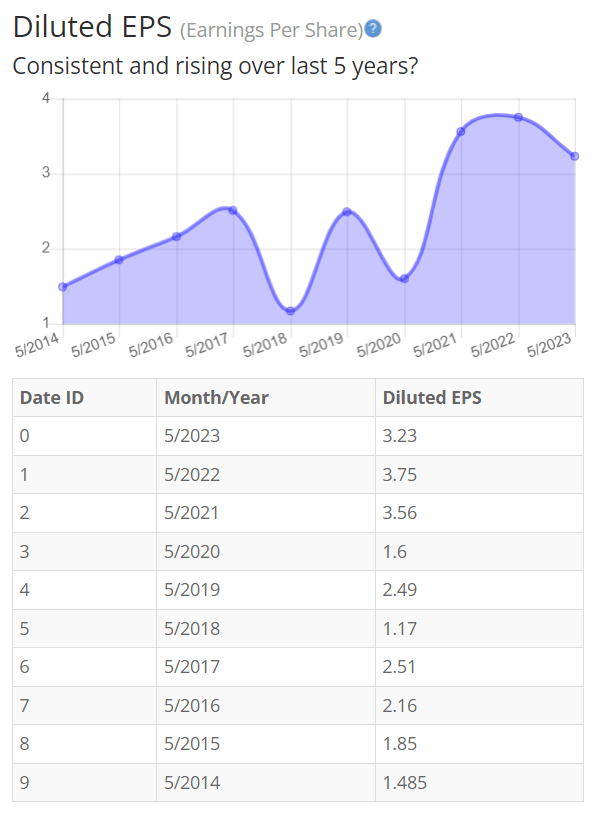
(Source: BTMA Stock Analyzer – EPS History)
Since earnings and price per share don’t always give the whole picture, it’s good to look at other factors like gross margins, return on equity, and return on invested capital.
Return on Equity
The return on equity has followed the trend of share price and has seen a decline in the last two years. The trend shows a decline to lows only seen back in COVID-19 within the last 5 years. When sales rebound, the ROE should flip to an upward trend, reaching previous levels. For return on equity (ROE), I look for a 5-year average of 16% or more. So, Nike exceeds this requirement.
BTMA Stock Analyzer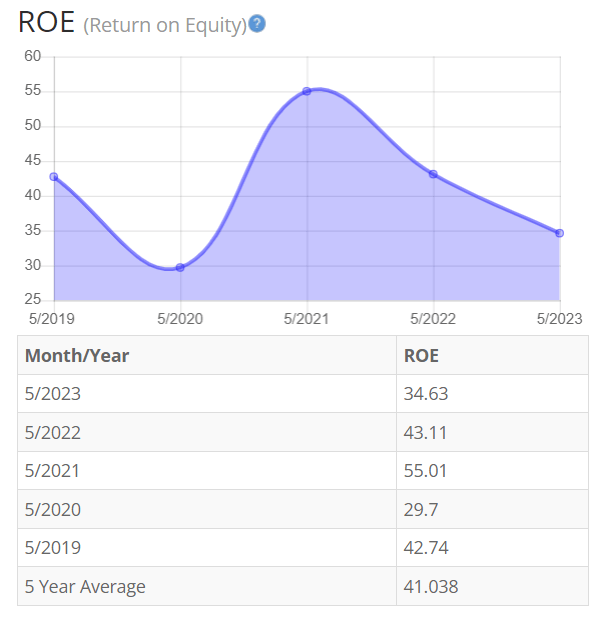
(Source: BTMA Stock Analyzer – ROE History)
Let’s compare the ROE of this company to its industry. The average ROE of 13 Shoe corporations is 29.9%.
Therefore, Nike’s 5-year average of 41.04% is significantly above its peers.
Return on Invested Capital
The return on invested capital has also seen a decline in recent years. Capital expenditure has increased for the last few years with no solid net income rise. Looking at the past 5 years, Nike has consistently seen ROIC decline which shows the recent trend downward is not an outlier. The extra expenses are not contributing to any meaningful top and bottom-line growth yet. However, I think in the long term the technology initiatives and investments could give Nike a competitive advantage against its fellow footwear peers. This ROIC gain may not be realized until 2025 or beyond though. For return on invested capital (ROIC), I also look for a 5-year average of 16% or more. So, Nike, Inc. does exceed this amount.
BTMA Stock Analyzer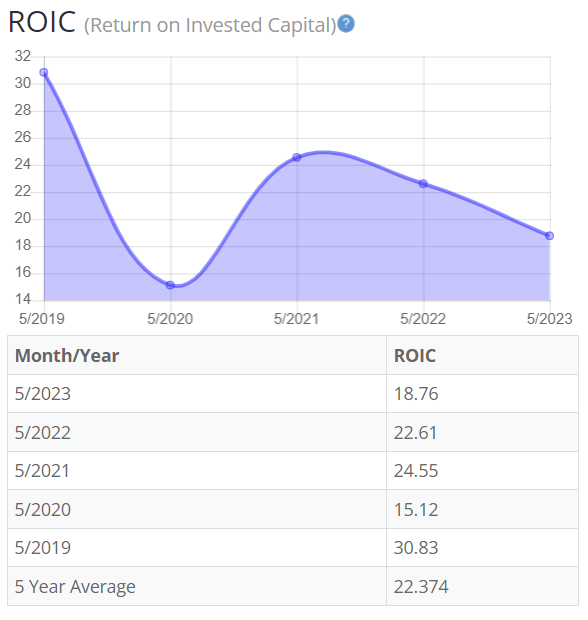
(Source: BTMA Stock Analyzer – Return on Invested Capital History)
Gross Margin Percent
The gross margin percentage (GMP) has remained stable and strong over the last 5 years. Continued excellence in gross margin shows a strong top line for Nike. Seeing net income decline with a large gross margin is concerning and showcases the challenges Nike is facing regarding the competitive pressures in the industry. I do not foresee any direct material price increases in the short-term future and expect to see continued excellence in Nike’s gross margin percentage.
I typically look for companies with gross margin percent consistently above 30%. So, Nike is above this criterion.
BTMA Stock Analyzer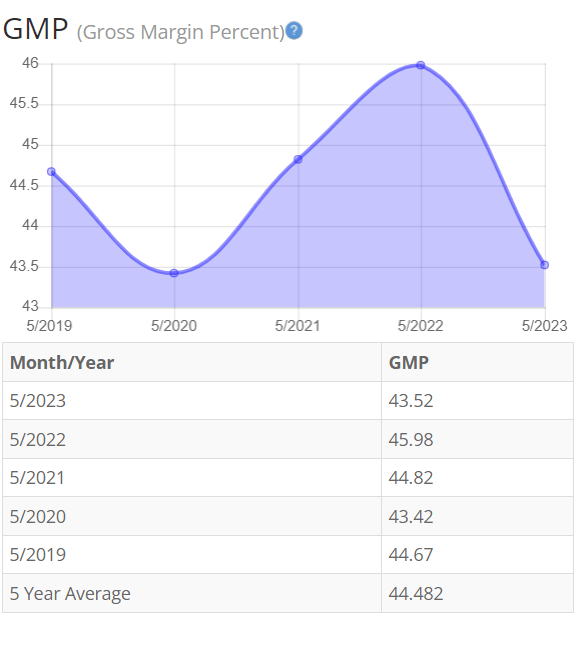
(Source: BTMA Stock Analyzer – Gross Margin Percent History)
Financial Stability
Looking at other fundamentals involving the balance sheet, we can see that the debt-to-equity is less than one. The company shows low long-term debt and the ability to raise more capital, if need be, in the future.
Nike’s Current Ratio of 2.27 indicates it can pay off short-term debt with its current assets.
Ideally, we’d want to see a Current Ratio of more than 1, so Nike exceeds this amount.
Nike shows a strong balance sheet relating to debt ratios. Nike can call on additional liquidity and continue to pay its debts with its cash reserves if need be. There is some concern about the company being overvalued due to the P/E ratio, but I find this unfounded due to the strength as well as the dominance of Nike within the industry. There is room to grow as the company invests in additional technology to enable more growth.
Nike has paid an increasing annual dividend since 2004.
(Source: BTMA Stock Analyzer – Misc. Fundamentals)
This analysis wouldn’t be complete without considering the value of the company vs. share price.
Value Vs. Price
The company’s Price-Earnings Ratio of 29.23 indicates that Nike is overpriced when comparing Nike Ratio to a long-term market average PE Ratio of 15.
The 10-year and 5-year average PE Ratio of NKE has typically been 34 and 37, respectively. This indicates that Nike could be currently trading at a low price when comparing to its average historical PE Ratio range.
(Source: BTMA Stock Analyzer – Stock Value)
The Estimated Value of the Stock is $116.3, versus the current stock price of $94.13. This indicates that Nike is currently selling below its value.
For more detailed valuation purposes, I will be using a conservative diluted EPS of 3.23. I’ve used various past averages of growth rates and PE Ratios to calculate different scenarios of valuation ranges from low to average values. The valuations compare growth rates of EPS, Book Value, and Total Equity.
In the table below, you can see the different scenarios, and in the chart, you will see vertical valuation lines that correspond to the table valuation ranges. The dots on the lines represent the current stock price. If the dot is towards the bottom of the valuation range, this would indicate that the stock is undervalued. If the dot is near the top of the valuation line, this would show an overvalued stock.
BTMA Wealth Builders Club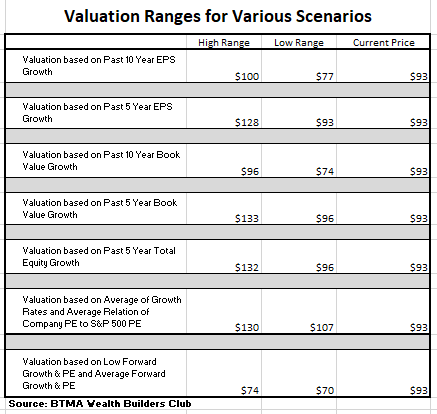
BTMA Wealth Builders Club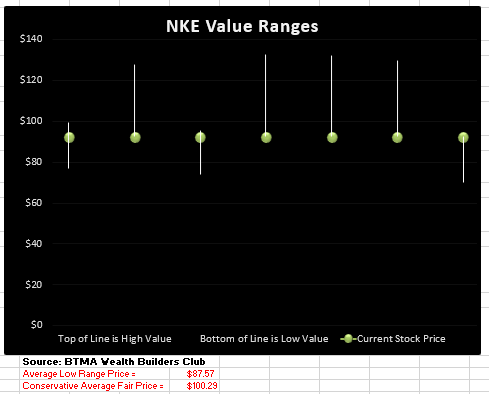
(Source: BTMA Wealth Builders Club )
According to this valuation analysis, Nike is undervalued.
This analysis shows an average valuation of around $100 per share versus its current price of about $93, this would indicate that Nike is undervalued.
If an investor is less confident in NKE and would like to be more conservative, then you may focus more on the “Average Low Range Price” of $87.57.
Summarizing the Fundamentals
After analyzing the fundamentals of Nike, I have noticed that all the fundamentals are at strong or acceptable levels. However, in the past recent years, the fundamentals have experienced a decline mostly because of industry headwinds.
With that said, I still believe this company remains strong despite the recent headwinds. The sales decline and increased operating expenses have eaten into profits directly pressuring a stock price decline. EPS, ROE, and ROIC have followed suit in this declining trend due to the impact on Net Income. I do believe ROIC will see a faster turnaround as technological investments begin to enable faster growth. The gross margin has remained strong through the last 5 years, and I see no signs of this declining. I would like to see a decrease in operating expenses to begin to elevate the earnings of Nike back to previous levels. I am confident that Nike’s fundamentals will win out in the long-term.
In terms of valuation, my analysis shows that the stock is slightly undervalued.
Nike Vs. The S&P 500
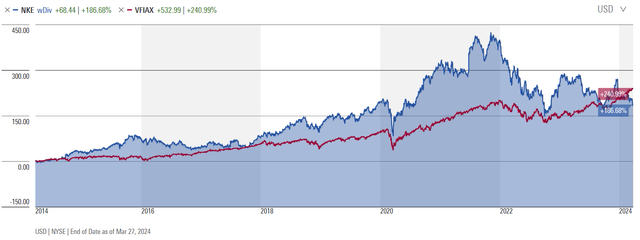
Now, let’s see how Nike compares versus the US stock market benchmark S&P 500 over the past 10 years. From the chart below, Nike continually beats out the overall market despite the recent rise. This could be due to the downward trend of Nike the recent years while the overall market has seen a resurgence, especially in tech. I believe the recent gap in the S&P is an outlier and expect Nike to continue its excellence in the long term. With the potential upswing of sales by 2025, Nike investors could see exceptional growth even above the overall market.
Forward-Looking Conclusion
Over the next five years, the analysts that follow this company are expecting it to grow earnings at an average annual rate of 13.43%.
In addition, the average one-year price target for this stock is $111.23, which is about an 18.3% increase in a year.
The Expected Annual Compounding Rate of Return is 5.73%.
If you invest today, with analysts’ forecasts, you might expect about 13% (average growth) per year.
Here is an alternative scenario based on NKE’s past earnings growth. During the past 10 and 5-year periods, the average EPS growth rate was about 8% and 5.3%, respectively.
But when considering cash flow growth over the past 10 and 5 years, the average growth has been 11.4% and 5.6%, respectively. Therefore, when considering all these return possibilities, our average annual return could likely be around 8.6%.
If considering actual past results of Nike, the story is a bit different. Here are the actual 10 and 5-year return results.
______________
10 Year Return Results if Invested in NKE:
Initial Investment Date: 4/1/2014
End Date: 4/1/2024
Cost per Share: $37.2
End Date Price: $92.56
Total Return: 173.66%
Total Dividends Received: $9.24
Compound Annualized Growth Rate: 11%
_______________
5 Year Return Results if Invested in NKE:
Initial Investment Date: 4/1/2019
End Date: 4/1/2024
Cost per Share: $85.23
End Date Price: $92.56
Total Return: 15.45%
Total Dividends Received: $5.84
Compound Annualized Growth Rate: 3%
_________________
From these scenarios, we have produced results from 3% to 11%. I feel that if you’re a long-term patient investor and believer in NKE, and its existing products (footwear and sports apparel), you could expect NKE to provide you with around at least 11% annual return over the long haul. But for the short-term swing trader or impatient investor, the near future of NKE, might show some volatility as inflation, increased costs, and increased competition could keep Nike’s share price down.
As a comparison, the S&P 500’s average return from 1928 – 2014 is about 10%. So, in a typical scenario with NKE, you could expect to earn as much as the S&P 500 or higher if you are able to buy at a bargain, hold long-term, and sell when the stock climbs to its premium share price.
Does Nike Pass My Checklist?
- Company Rating 70+ out of 100? Yes (83.75)
- Share Price Compound Annual Growth Rate > 12%? No (8.25%)
- Earnings history mostly increasing? Yes
- ROE (5-year average 16% or greater)? Yes (41%)
- ROIC (5-year average 16% or greater)? Yes (22.4%)
- Gross Margin % (5-year average > 30%)? Yes (44.5%)
- Debt-to-Equity (less than 1)? Yes
- Current Ratio (greater than 1)? Yes
- Outperformed S&P 500 during most of the past 10 years? Yes
- Do I think this company will continue to successfully sell the same main product/service for the next 10 years? Yes
Nike scored 9/10 or 90%. Therefore, Nike has strong investment potential.
Is Nike currently selling at a bargain price?
- Estimated Value greater than the Current Stock Price? Yes (Value $116.3 >$93 Stock Price)
- Detailed Valuation Analysis greater than the Current Stock Price? Yes (Value $100 >$93 Stock Price)
Nike remains a strong leader in the footwear and apparel industry even with the recent headwinds. Growth has slowed and operating costs have risen. The operating costs increase is more concerning compared to the slowing growth. Technological investments and increased marketing costs have not improved top and bottom-line growth for the company in recent years. I believe this could be due to consumer spending decline and should reverse in 2025. If the growth does not return, then competitive pressure could become a major concern on the long-term growth prospects. The headwinds that Nike faces do not deter me from looking at this stock as a potential winner.
I would consider entering a position in this company. I think Nike will eventually start entering oversold territory and that would be an opportune time to pick up shares. I trust in the brand and the technology that Nike is developing to continue to generate a competitive advantage for the company. If interest rates fall, consumer spending will increase, and net income should rebound.
Analyst’s Disclosure: I/we have no stock, option or similar derivative position in any of the companies mentioned, but may initiate a beneficial Long position through a purchase of the stock, or the purchase of call options or similar derivatives in NKE over the next 72 hours. I wrote this article myself, and it expresses my own opinions. I am not receiving compensation for it (other than from Seeking Alpha). I have no business relationship with any company whose stock is mentioned in this article.
Seeking Alpha’s Disclosure: Past performance is no guarantee of future results. No recommendation or advice is being given as to whether any investment is suitable for a particular investor. Any views or opinions expressed above may not reflect those of Seeking Alpha as a whole. Seeking Alpha is not a licensed securities dealer, broker or US investment adviser or investment bank. Our analysts are third party authors that include both professional investors and individual investors who may not be licensed or certified by any institute or regulatory body.
If you want to find good companies at bargain prices that will provide you with long-term returns and dividends in any investing climate, then my Seeking Alpha Marketplace service (Good Stocks@Bargain Prices) is a good match for you.


