Summary:
- NIKE’s Q1 2024 financial performance showed a modest increase in revenue, driven by growth in EMEA, Greater China, and APLA regions.
- The North American market posed challenges for NIKE, with a decline in revenue.
- NIKE’s stock price looks poised to rise, with a bullish technical outlook and potential for significant upward movement.
code6d
NIKE, Inc. (NYSE:NKE) disclosed a multifaceted financial performance in Q1 2024, mirroring the intricacies of the worldwide economic environment. The company experienced a modest increase in revenue, demonstrating its resilience across diverse market conditions. The NIKE Brand witnessed revenue growth, primarily fueled by its performance in the EMEA (Europe, Middle East, and Africa), Greater China, and APLA (Asia Pacific and Latin America), underscoring its enduring appeal amidst economic uncertainties. However, this growth was tempered by a decline in the North American market, indicating some regional challenges. This piece examines NIKE’s financial stability and conducts a technical analysis of its stock price to identify future trends and investment prospects. It has been determined that the stock price’s correction in 2022 has established a base, suggesting that the price is poised to rise.
NIKE Navigates Economic Headwinds in Q1 2024
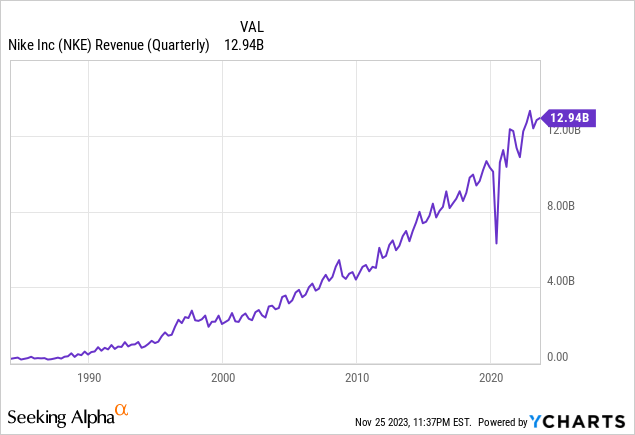
NIKE’s financial performance for the Q1 2024 quarter showcased mixed results, reflecting the dynamic and challenging global economic environment. The company recorded a modest rise in revenue, with a 2% increase to $12.94 billion compared to Q1 2023. This growth was consistent on a reported and currency-neutral basis, indicating resilience in NIKE’s diverse global operations. The chart below displays NIKE’s quarterly revenue, showcasing a robustly bullish trend.
The NIKE Brand experienced a 3% increase in revenues, reaching $12.4 billion, driven primarily by growth in the EMEA, Greater China, and APLA regions. This growth suggests that NIKE’s brand resonates with consumers in these markets despite economic uncertainties. However, it’s notable that this was partially offset by a decline in North America, hinting at challenges in this crucial market. Moreover, Converse did not perform as well, with revenues dropping 9% to $588 million. This decline was attributed mainly to reduced sales in North America, although some growth was reported in Asia. The North American market appears to be a challenging area for both NIKE and Converse brands.
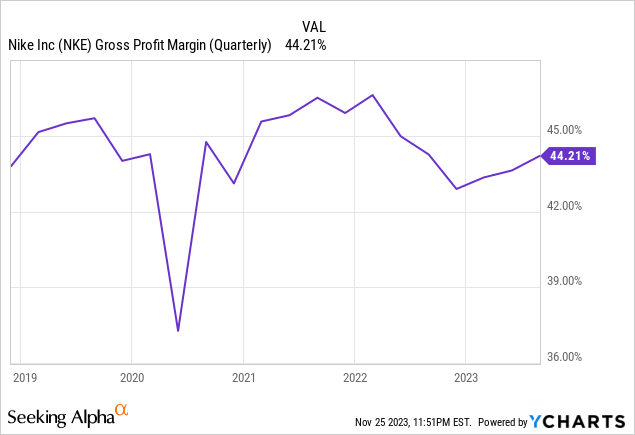
Regarding profitability, NIKE’s gross margin slightly declined, dropping 10 basis points to 44.2%, as shown in the chart below. This reduction was primarily due to increased product costs and unfavorable foreign currency exchange rates, although strategic pricing actions helped mitigate some of these impacts. Selling and administrative expenses rose by 5% to $4.1 billion, with demand creation expenses jumping 13%, reflecting higher advertising and marketing expenditures. Operating overheads also increased at a slower rate of 2% due to wage-related fees and direct costs associated with NIKE’s retail operations.
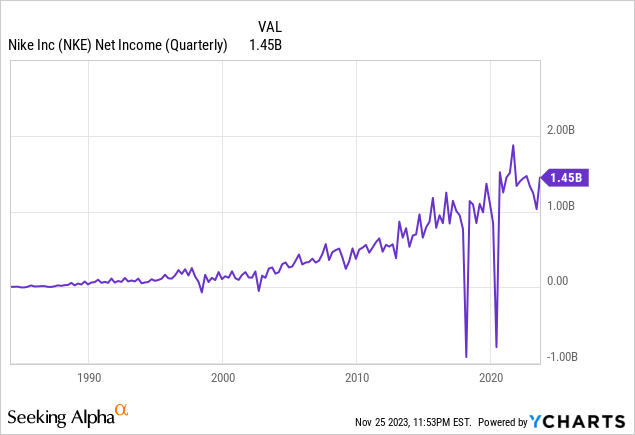
The effective tax rate for the quarter was significantly lower at 12.0%, compared to 19.7% in the previous year, aided by a one-time benefit related to U.S. foreign tax regulations. Despite these challenges, net income only slightly decreased by 1% to $1.45 billion, and diluted earnings per share saw a marginal increase of 1% to $0.94. The chart below illustrates NIKE’s quarterly net income, highlighting the long-term growth in profitability.
From a balance sheet perspective, NIKE demonstrated effective inventory management, with a 10% reduction in inventory levels, suggesting an efficient response to shifting consumer demands and supply chain dynamics. However, a notable decrease in cash, equivalents, and short-term investments dropped by about $3.1 billion from the previous year. This reduction is attributable to significant shareholder returns through dividends, share repurchases, and capital expenditures.
Moreover, NIKE’s commitment to shareholder returns remained strong, with a 9% increase in dividends and substantial share repurchases under its $18 billion program. These actions reflect confidence in the company’s financial health and prospects.
Overall, NIKE’s financial performance in Q1 2024 presents a nuanced picture of resilience amid global economic challenges. While the company saw modest revenue growth and maintained robust global operations, it faced hurdles in North America and its Converse brand, alongside a slight dip in profitability due to increased costs and unfavorable currency exchange rates. However, NIKE’s strategic financial management, evident in effective inventory control, strong shareholder returns, and overall stability in net income and earnings per share, underscores its adaptability and strength in a complex and evolving market landscape.
Exploring Technical Price Developments
The monthly chart below presents a robustly bullish technical outlook for NIKE. The stock has exhibited significant growth, displaying a robustly bullish trajectory that emerged after the Great Recession. NIKE’s stock price experienced a remarkable recovery and surge after reaching a low in 2009 at $8, culminating in a record high in 2021 at $175.21, with the most significant rally occurring in 2020 and 2021.
This impressive growth was attributed to several key factors. Firstly, NIKE’s relentless focus on innovation and brand strengthening played a pivotal role. The company consistently introduced cutting-edge products and leveraged digital technology to enhance customer experience and operational efficiency. This innovation extended to their marketing strategies, where the company embraced social media and digital platforms, effectively engaging with a younger, more tech-savvy consumer base. Additionally, NIKE’s commitment to sustainability and social causes resonated well with consumers, particularly millennials and Gen Z, who increasingly prefer brands that align with their values.
NIKE Monthly Chart (StockCharts.com)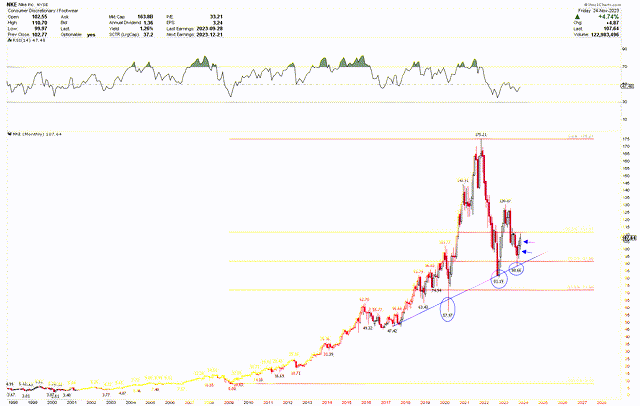
The surge in NIKE’s stock in 2020 and 2021 was further fueled by the company’s exceptional adaptability during the COVID-19 pandemic. NIKE accelerated its digital transformation as the pandemic disrupted traditional retail and consumer habits. The company invested heavily in its online platforms and direct-to-consumer channels, which paid off significantly as e-commerce experienced a global boom. This shift helped offset the decline in physical store sales and improved profit margins, as direct-to-consumer sales are generally more profitable. Furthermore, NIKE’s global brand appeal and diverse product range allowed it to capitalize on the increased interest in health and fitness during the pandemic, as people sought comfortable, high-quality athletic wear for home workouts and outdoor activities. This holistic approach to navigating the challenges presented by the pandemic and the strategic emphasis on digital and direct-to-consumer channels were key drivers behind the stock’s strong performance during this period.
The remarkable rally in NIKE’s stock during 2021, marked by significant volatility, led to a substantial correction that brought prices back to the critical blue trend line. This line has historically acted as a robust support level, as indicated by the blue circles where the stock has repeatedly rebounded. In September 2023, the stock reached a low of $88.66 but has since shown signs of recovery. Furthermore, applying the Fibonacci retracement tool from the 2009 low of $8 to the record high of $175.21 reveals a notable resistance level at the 38.2% Fibonacci mark of $111.37. Overcoming this resistance, especially with a monthly close above it, could signal the beginning of a significant upward movement.
This bullish sentiment is echoed in the weekly chart, which displays a double-bottom pattern with lows at $81.19 and $88.66 and a neckline around $130. The RSI also bolsters this view, which has risen above the pivotal 50 mark and suggests increasing bullish momentum. Notably, the RSI dipped into oversold territory at the points of the double bottom, indicating a potential reversal point. As the RSI climbs past the midpoint following an oversold condition, it further confirms the potential for a price bottom.
NIKE Weekly Chart (StockCharts.com)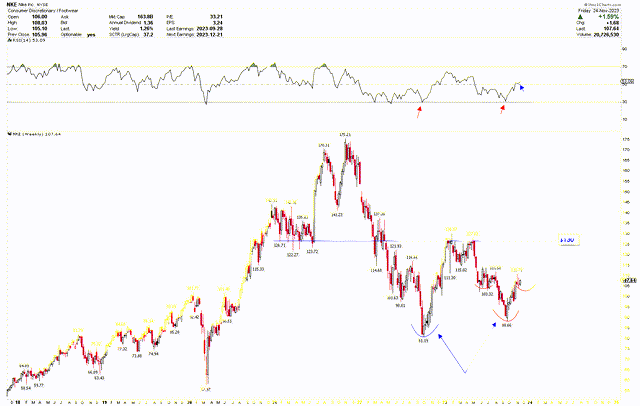
The short-term price pattern also hints at an emerging inverted head and shoulders formation, discernible through the red arcs in the weekly chart. These technical patterns and indicators collectively paint a bullish picture for NIKE’s stock. Given these bullish price configurations, investors might consider this an opportune moment to buy the stock, anticipating further upward movement in its price.
NIKE Daily Chart (StockCharts.com)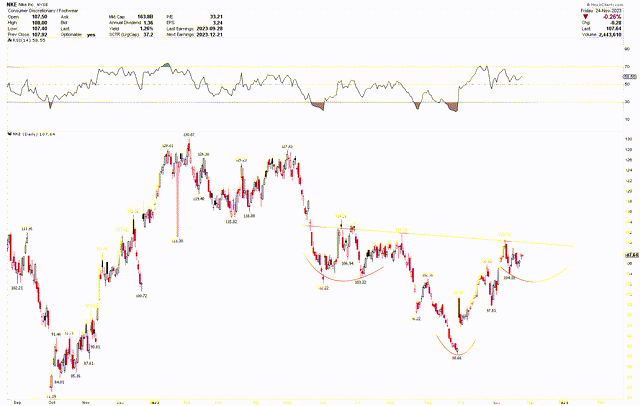
Market Risks
NIKE’s financial results for Q1 2024 highlight several market risks rooted in the current economic landscape. Firstly, while indicating resilience, the modest revenue increase also points to a challenging global economic environment that could dampen consumer spending. This is particularly evident in the North American market, where Converse experienced declining revenue. Given North America’s critical market significance, continued weakness could impact future revenues. Moreover, the steady growth in EMEA, Greater China, and APLA regions, despite being positive, may face volatility due to geopolitical tensions, local economic uncertainties, and currency fluctuations. These external factors could disrupt NIKE’s growth trajectory in these increasingly important markets.
On the operational front, NIKE faces risks associated with increased costs and margin pressures. The slight decline in gross margin, primarily due to heightened product costs and adverse foreign currency exchange rates, reflects the susceptibility of NIKE’s profitability to external economic forces. While essential for brand strengthening, the rise in selling and administrative expenses, notably in advertising and marketing, also increases the company’s cost burden. This scenario could become more challenging if economic headwinds lead to a margin squeeze.
From a technical perspective, the bullish outlook of NIKE’s stock, with a history of solid performance and current recovery signs, suggests investor confidence. However, this optimism must be tempered with caution, considering the potential for market volatility and corrections, as evidenced by the substantial correction in 2021 that brought prices back to a key support level. The stock’s performance will likely continue to be influenced by broader market sentiments, NIKE’s ability to navigate economic challenges, and its success in strategic areas like digital transformation and direct-to-consumer channels. A monthly close below $71.94 will negate the NIKE’s bullish outlook and initiate further declines.
Bottom Line
In conclusion, NIKE’s financial performance in Q1 2024 reflects a company adept at navigating the complexities of a challenging global economic landscape. Despite a modest increase in overall revenue and a resilient performance in several key markets like EMEA, Greater China, and APLA, NIKE faces notable hurdles, particularly in the North American market and with the Converse brand. The slight decline in gross margin and the challenges posed by increased costs and unfavorable currency exchange rates further highlight the economic pressures.
Nevertheless, the long-term technical analysis for NIKE continues to be overwhelmingly positive. The stock currently exhibits a robust price action pattern, characterized by a double bottom and an inverted head and shoulders formation, consolidating at a critical support level. Should the stock price breach the $130 mark, it is poised to trigger a significant upward rally. The intense price action makes it a suitable time for investors to consider entering positions. Additionally, should the stock experience further dips, it presents an opportunity to increase holdings, provided the price consistently closes above $71.94 monthly, maintaining its bullish momentum.
Analyst’s Disclosure: I/we have no stock, option or similar derivative position in any of the companies mentioned, and no plans to initiate any such positions within the next 72 hours. I wrote this article myself, and it expresses my own opinions. I am not receiving compensation for it (other than from Seeking Alpha). I have no business relationship with any company whose stock is mentioned in this article.
Seeking Alpha’s Disclosure: Past performance is no guarantee of future results. No recommendation or advice is being given as to whether any investment is suitable for a particular investor. Any views or opinions expressed above may not reflect those of Seeking Alpha as a whole. Seeking Alpha is not a licensed securities dealer, broker or US investment adviser or investment bank. Our analysts are third party authors that include both professional investors and individual investors who may not be licensed or certified by any institute or regulatory body.
