Summary:
- Bill Ackman recently purchased $229 million worth of Nike shares.
- Nike is a profitable business with high margins, strong cash generation, and consistent growth.
- Despite being labeled as a growth company, Nike’s growth numbers are slow and consistent compared to its competitors.
- I evaluate Nike as worth about $90 a share, making it fairly valued.
- NKE stock is a good candidate for selling puts.
filadendron/E+ via Getty Images
Bill Ackman, recently made a large purchase of 3M Nike (NYSE:NKE) shares, worth $229 million. This is a fairly large stake, worth ~2% of Pershing Square’s capital, making Nike their 8th largest investment. Ackman is one of the gurus with an amazing track record that I follow. All of the other seven investments have great returns (between 40 and 170%; note that Chipotle had a 50-1 stock split). Further, his average buy price was $92.94 and the shares are now around $85, so maybe we can buy the shares even cheaper. So I decided to dig into Nike.
Pershing Square Investment Returns (Stock Circle)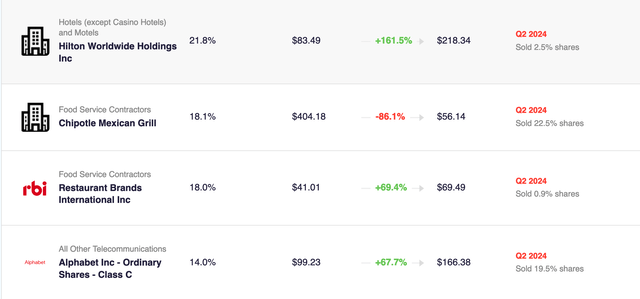
After looking at the company, I am hesitant to ‘go jogging with Bill’ and make an investment in Nike. Nike has been one of the strongest consumer brands in the world, but in more recent years it looks to me like Nike’s moat is weaker than it used to be.
After looking at the numbers, Nike looks like a profitable, stable business with slow consistent growth. However, my worry is that the company is being evaluated by the market as a growth company and that the shares were overvalued and are now fairly priced, even with the YTD 31% drop.
Nike’s Business
Nike sells a dream. Their brand is connected with the ideals of victory, perseverance; with doing something great. Their marketing strategy involves getting the ‘swoosh’ onto high-profile athletes with the message, ‘Our products are connected with greatness.’ They then turn around and say to the customer: ‘You can be great with our products.’
Nike’s brand does not get them a brand premium. Nike shoes cost the same as the adidas (OTCQX:ADDYY) equivalent. Their brand helps them push volume. They sell way more shoes than adidas because their brand is stronger.
Nike’s Advantage is Scale
Nike is the largest shoe and athletic company in the world. The only larger clothing companies are the luxury brands LVMH (OTCPK:LVMHF) and Hermès (OTCPK:HESAY). As a result, they have the largest advertising budget, at $4.1, almost double adidas and dwarfing new entrants like On Holding (ONON). Nike calls its ad-spend, ‘demand creation’ in its reports.
| 2023 Revenue (Billion USD) | 2023 Ad Spend (Billion USD) | Ad Spend as % of Rev | |
| Nike | $51.4 | $4.1 | 8.0% |
| adidas | $23.6 | $2.8 | 11.8% |
| On Holding | $2.2 | $0.20 | 9.1% |
The result is the Nike fly-while: Nike is able to retain the best athletes as sponsors and produce the best advertising. Check out their recent ads with Kobe Bryant or the ‘Am I A Bad Person’ ad with an all-star roster of athletes voiced over by Willem Dafoe.
Compare this to Lululemon’s (LULU) ads which are about feeling good but have no famous sponsors, or to On’s ads and Hoka’s ads which are just about the shoes, not about the great athletes who wear them.
The only company that is similar is the adidas ads with Lionel Messi. These are great, but Nike has more athletes across more sports. The Nike ads seem more inspirational and better made. This company is focused on its brand message and has the budget to make it work.
Nike’s scale is also about their manufacturing and distribution channels. They have
Nike Is Profitable
Nike has maintained a high-margin business throughout the years. Over the last ten years, the ROE has averaged 34.7% and the ROIC has averaged 23.7%, and these numbers are still holding. Comparing the ROE of Nike to its competitors, we can see that it is the most profitable business. This ROE is a good sign that Nike has a moat.
ROE of Nike and Competitors (Author)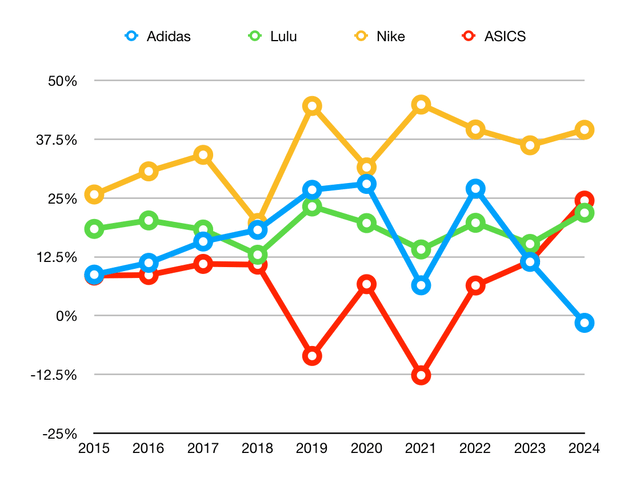
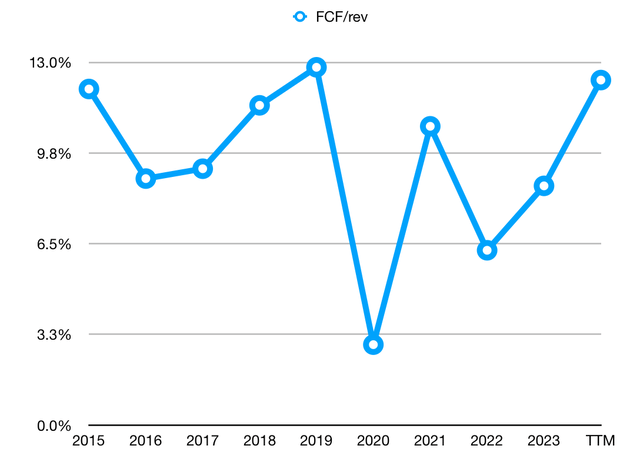
Nike has a good FCF conversion rate. FCF/Rev has been between 6-13%, with the average at 9.5%.
On the back of this cash generation, Nike has built a nice cash position. They have $11.6 B of cash and $3.6 B of net cash. Further, they are buying back shares, having bought $1.8 B of shares back already this year. Even further, the company is paying a dividend. The last four quarters yield a dividend of $1.48, with a yield of 1.8%.
The cash generation of this business looks secure. Nike should continue to grow its cash position and support its dividend and share buybacks.
Nike is Growing Slowly
Right on their investor relations page, Nike has a banner that declares, “Nike, inc. is a growth company.” In the early days, the company (then called “Blue Ribbon”) was doubling its revenue annually and was indeed a growth company.
Nike Investor Relations Homepage (Nike Investor Relations Homepage)
However, when I look at the numbers, Nike does not look like a growth company. It looks like a stable and mature company that is growing slowly and consistently. The problem for me is that Nike seems like it is priced as a semi-growth, and I think the shares are overvalued.
I look at four growth numbers: revenue, income, book value, and cash from operations. A company with a strong moat will be able to grow all four. For Nike, revenue has a 6.6% CAGR, and income has a 5.6% CAGR.
| 5 yr CAGR | 10 Yr CAGR | |
| Revenue | 5.5% | 6.6% |
| Income | 4.7% | 5.6% |
| Book Value | 9.1% | 1.2% |
| Cash from Operations | -0.2% | 2.8% |
When we compare Nike to its peers, it does not look to be like a growth company. Lululemon stands out as a growth company, compared to the established players. Nike has grown more than adidas (OTCQX:ADDYY) and ASICS (OTCPK:ASCCF), but not much more.
Nike Peers Revenue Growth (Author)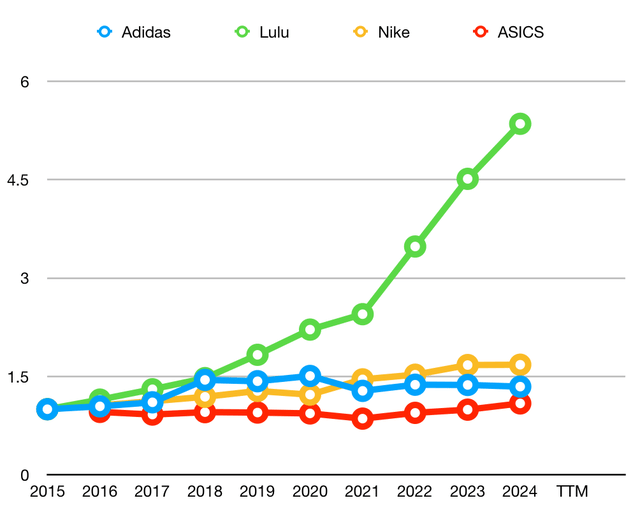
Comparing the income growth tells a similar story. Lululemon has demonstrated robust income growth. adidas and ASICS have both been quite volatile. Nike has been more consistent than those two, but it is slow consistent growth.
Nike Peers Income Growth (Author)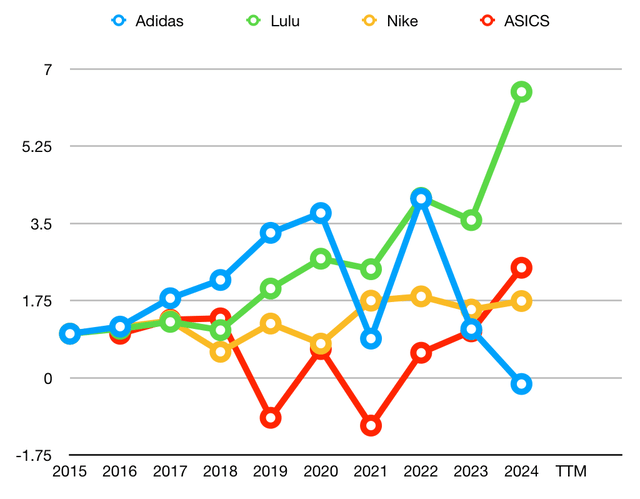
Nike Are On the Backfoot
The recent results of Nike have been disappointing. Last quarter their revenue was down 2% YoY. In the quarter before, revenue was flat and income was down 5% YoY.
The management team recognizes that their business is in a slump, and are saying they are building a ‘come back.’ The 2024 shareholder letter said, “We underperformed our expectations for the past three quarters and lowered our outlook.” The language from their recent earnings call acknowledges these problems.
This quarter, we saw softer traffic in our factory stores, highlighting increasing pressure being felt by the value consumer… [with] declines in Lifestyle and Jordan [segments]…We are managing a product cycle transition, with complexity amplified by shifting channel mix dynamics. A comeback at this scale takes time…Taking all of this into consideration, we now expect Fiscal 25 reported revenue to be down mid-single-digits, with the first half down high single-digits. One, our lifestyle business declining more pronounced on NIKE Digital, specifically in April and in May, and those trends continuing into June…
There are several reasons for the recent slowdown. Here are four. First, there is a general downturn in some consumer goods and in particular retail. Barclay’s has just downgraded the retail sector. This downturn may be due to inflation. While Nike is down 31% from their recent high, Lululemon is down 47%.
Second, is that there are several new and exciting shoe companies, like On and Hoka, which are counter-positioned to Nike and are growing rapidly. On Holding has a 50.4% 5-year CAGR in their revenue growth, and are now firmly cash positive, based on their new shoe technology and appeal to young runners. These new brands have made real gains in the last five years and may now be eating into Nike’s share of the market.
Third, for all their great marketing, Nike may have been sleeping at the wheel. These other brands have been present more in places like running clubs, where runners really are. Ironically, this is the strategy the Phil Knight initially used to get Blue Ribbon off the ground.
Fourth, it might just be that Nike is at a point of market saturation, or nearing a point of saturation. Nike, really, created the market for jogging and running shoes. The days of explosive growth are behind them.
Nike’s Future Growth
To put a value on the shares, it is important to wrestle with Nike’s future growth.
If we look at the analysts’ estimates, they predicted 2025 to be a down year for both revenue and earnings. The long-term revenue growth is predicted around 5-6%. This is copacetic with their history of the last ten years.
Nike Revenue Estimates (Seeking Alpha)
For income, the analysts the down of 2025 is worse (-20%), with a recovery in 2026. This follows the comeback narrative of Nike management. However, there are not many analysts, but they predict long-term income growth of 10-20%.
Nike Income Estimates (Seeking Alpha)
This is well above their historical growth of 5.6% and would signal that Nike is going into a long-term structural change. While I think that Nike’s brand could potentially support a comeback and 2026 recovery, I cannot see long-term growth of 10% or more. I will use a 6% growth for income after 2027 to evaluate Nike.
Nike Evaluation
I use three evaluation methods, taught by Phil Town and RuleOne Investing.
Margin of Safety
The first method is about the earning power of a business. A business with a durable competitive advantage will be able to grow its earnings over time. You need to have a sense of what their earnings growth rate has been and what it will likely be in the future, which requires understanding the business. Once you can estimate the earnings growth rate, you can grow the earnings ten years out.
Nike currently has an EPS of $3.73. We follow the analysts for 2025 and 2026, so EPS is 3.62 them 3.96. Then we grow their earnings by 6%. The future EPS will be $71.20 in 2035.
If you look at Nike’s historical PE, apart from two down income times, their max PE has been 43. We can take 38 as an ambitious PE sell target in the future. The share would be valued then at $296.65 in the future. Discounting this by a rate of 15% today gives a ‘fair value’ of $73.33, indicating that the shares are still overvalued. Phil Town looks for a margin of safety, buying below the fair value, which would be somewhere around $50.
Payback Time
The second method is called Payback Time. This method looks at the free cash flow growth over time. Basically, you think of yourself as owning the business. If you owned it, how much FCF would you get per year? You add up the growing FCF over the years. Town argues that eight years is considered a great amount of time to get your investment returned. We are looking for a deal. The fair value is double this deal price, giving us a margin of safety. If an investment can ‘pay you back’ in eight years in FCF, then it’s a great investment. This can be returned to us in dividends or buybacks or growth capex.
Nike currently produces $5.39 FCF/share. However, this FCF needs is probably a bit skewed. Their cash has gotten a boost as they are seeking to clear through their inventory. Due to supply chain issues, they had an inventory swell, and have reduced their inventory by about $200 M a quarter since Aug 22, about 12.7% of the FCF. The inventory is now at proper levels. Their current FCF is probably a little ‘juiced’. Their TTM FCF conversion is 12.5%, but their long-term average is 9.3%. I will handicap this their FCF/share by 9%.
We follow a similar path as income, falling in 2025, recovery in 2026, and then 6% growth for six more years, $44.72 in eight years. This would be the ideal which is the ‘buy price’ for PBT, meaning that the fair value in this view is $89.44.
This analysis is probably a bit skewed. Their cash has gotten a boost as they are seeking to clear through their inventory. Due to supply chain issues, they had an inventory swell, and have reduced their inventory by about $2 B a quarter, since Aug 22. I will handicap this their FCF/share
Ten Cap
The third method is called the Ten Cap. In this lens, we imagine the business is like a rental property that we own. Each year there is cash coming off the property, which may not be growing, but is a dependable stream of income. However, we need to pay for maintenance fees. This is like Warren Buffett’s concept of Owner Earnings. Phil Town does a similar calculation to FCF, but he takes cash from operations and subtracts only the maintenance Capex, which is a proxy for depreciation, and adds back to the tax benefit. This is the annual owner earnings. If a property pays 10% of its invested capital back a year, it is called a ten cap. Anything that is a ten cap or higher is a good investment.
(In millions) the operating cash flow of Nike is $7,429. As per the inventory discussion, this is ‘juiced’ by inventory drawdown. I will take $6,760 as a better estimate the depreciation is $796; the tax benefit is $1000.0. These numbers yield owner earnings of $7633 million or $5.80 per share. If you held these shares for ten years, they would throw off $58.00, which would be a ‘good deal.’ This evaluation implies a fair value of $116.07.
Summary of Evaluation
Nike shares are currently trading at around $85. If we account for the ~$3/share of net cash, we set the EV at $82. We get the following table
| Fair Value | Upside | |
| MOS | $73.33 | -11% |
| PBT | $89.44 | 9% |
| Ten Cap | $116.07 | 42% |
These three analysis methods do not always line up, and for Nike, they don’t. Nike is great at cash conversion, so the PBT and Ten Cap methods really shine. The Ten Cap suggests that if you are willing to hold the company and expect a dividend, you could have a great upside. However, if the market is looking for a growth story, there are downside risks.
I would be comfortable setting a $90 target price, along with the PBT which is the middle rating.
Conclusion
To me, there are downside risks in the short term. The company is in a weak market and is seeking a ‘come back.’ There is a risk that Nike doesn’t execute perfectly, and the comeback is push-back a quarter or two or more.
At the end of the day, I think that Nike’s brand and scale will produce a comeback. As the shares are near the fair price, I see this as a great company that has had a hard time. However, because of the strong brand, Mr. Market isn’t really worried or depressed yet. Mr. Market is still hoping for the brand to pull through.
If you are looking for a wonderful business to pay a great dividend, Nike is a great investment. If you are looking for an undervalued opportunity, Nike isn’t it. This is still not a company you can buy with a margin of safety.
If you wanted to own Nike, but are willing to wait for a better price, I would be interested in selling long-dated puts, around $75. Nov 15 puts are selling for ~$1.24 today.
Analyst’s Disclosure: I/we have no stock, option or similar derivative position in any of the companies mentioned, and no plans to initiate any such positions within the next 72 hours. I wrote this article myself, and it expresses my own opinions. I am not receiving compensation for it (other than from Seeking Alpha). I have no business relationship with any company whose stock is mentioned in this article.
Seeking Alpha’s Disclosure: Past performance is no guarantee of future results. No recommendation or advice is being given as to whether any investment is suitable for a particular investor. Any views or opinions expressed above may not reflect those of Seeking Alpha as a whole. Seeking Alpha is not a licensed securities dealer, broker or US investment adviser or investment bank. Our analysts are third party authors that include both professional investors and individual investors who may not be licensed or certified by any institute or regulatory body.

