Summary:
- Nike is set to report their fiscal Q4 ’23 results on June 29th, with analysts expecting a year-over-year decline in EPS of -26% on +3% revenue growth. The company has been dealing with issues similar to other retailers post-Covid, including a surge in inventory due to supply chain backups, which has affected cash flow growth.
- Despite a 36% drop in Nike’s stock from November ’21, the company’s valuation remains high. If Nike meets consensus estimates, the actual year-over-year growth would be +9% in revenue, while full-year EPS fell 14%. Analysts expect Nike to average 8% revenue growth and 17% EPS growth over the next three fiscal years.
- Nike’s strength lies in the power of its brand and dominance in the footwear and apparel markets. Despite current challenges, I believe the risk-reward ratio for Nike has improved over the last 18 months and recommend adding more to the Nike position on this pullback, depending on the results announced on Thursday.
hapabapa
Nike (NYSE:NKE) is scheduled to report their fiscal Q4 ’23 on Thursday, June 29th after the closing bell. Analyst consensus is expecting $0.67 in EPS (earnings per share) on $12.59 billion in revenue for an expected year-over-year decline in EPS of -26% on +3% revenue growth.
In fiscal Q3 ’23, Nike saw gross margin and China issues were the two weaker spots in the quarter, even though Nike raised their revenue estimate for fiscal ’23 from low-single-digit to high-single-digits.
(With this being the last quarter of the fiscal year, the boosted revenue guide doesn’t mean much, but you’d think Nike management would not have raised revenue guidance for ’23 without seeing it carry through into ’24. Still the guidance for the new fiscal year on Thursday night, will be interesting.)
To be frank, Nike has or had the same issues as Walmart and Amazon and a bunch of other retailers post-Covid: the back-up in the supply chain in late 2021, early 2022, caused a big surge in inventory at Nike, which results in a drag on working capital and then cash-flow growth. (A table of Nike’s inventory growth relative to revenue growth, will be shown a little further down the article.)
From a longer-term perspective, after playing with longer-term “annual returns” look where Nike’s stock ranked from 1/1/2000 through 12/31/2022:
- Nike: +15.03% average, annual, return
- Amazon: +14.39%
- Berkshire (Class B): +9.71%
- Microsoft: +8.51%
- JPMorgan: +7.30%
- S&P 500: +6.26%
Source: YCharts performance software
(There was no systematic way the above list was put together. Playing around with the software I was looking for prominent names that readers might be familiar with to compare Nike’s long-term returns against, and this was what was derived. )
Nike hit a high of $179.10 in November of 2021, supported by a nosebleed valuation, and has since corrected 36% from peak-to-trough or -24.6% annualized.
Nike: trends in EPS and revenue estimate revisions:
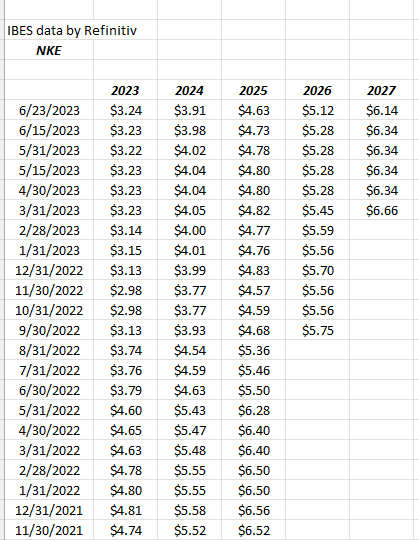
Nike EPS estimate revisions (IBES data by Refinitiv )
Readers rarely comment on the EPS and revenue estimate revisions of companies that are about to report, which I’ve always found puzzling, because the above table represents – quantitatively – the positioning or thinking of the sell-side analyst community on a particular stock.
The above table shows how the consensus EPS estimate for Nike’s fiscal years have weakened since late November ’21 or the period where the stock peaked at $179 per share.
Here’s the percentage decline in fiscal year EPS estimates since the stock peak:
- 2024: -32%
- 2025: -29%
- 2026: -29%
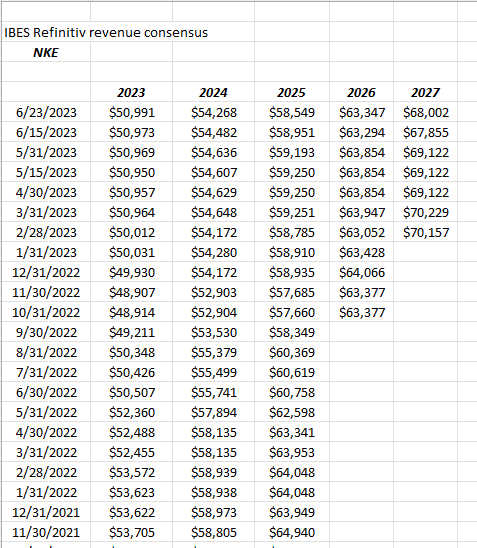
Nike trend in revenue revisions (IBES data by Refinitiv )
The revenue revisions are far less steep than Nike’s EPS revisions, but that’s typically the case.
Still the trends are lower for both Nike EPS and revenue coming into fiscal Q4 ’23 financial results.
Gross Margin and China are the issues:

Nike Gross Margin (Quarterly earnings / 10-Q)
Readers can see how gross margin peaked in late 2021, but had declined since pressuring operating and net margins.
The cause of the gross margin pressure likely came from this:

Nike revenue vs inventory growth (Quarterly earnings / 10-Q)
Readers have to click on the above link to expand the spreadsheet, but you’ll see how for the last 6 quarters for Nike, year-over-year inventory growth has greatly exceeded year-over-year revenue growth, never a good thing for a retailer.
Any time inventory swells relative to revenue growth, like being seriously constipated, the internal wheels start to come off and breakdown. This condition impacts cash-flow (as I’ve written about Walmart the last two quarters) and if not rectified quickly, can continue to cause issues.
Nike’s gross margin declined 316 bp’s y.y in the fiscal 3rd quarter, 2023, thus I’d like to see the situation begin to remedy itself with fiscal q4 ’23 numbers Thursday night.
China:
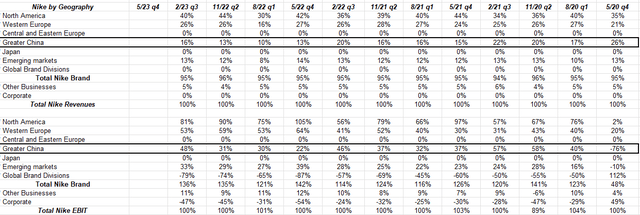
Nike revenue and EBIT by geography (quarterly earnings / 10-Q )
This table shows Nike’s revenue and EBIT by geography, and while I’d prefer not to see EBIT, but rather operating income, that’s the way Nike chooses to disclose their geographic information, and as readers can see while China has slowed a little in terms of percentage of revenue since the onset of Covid-19 in May ’20, the percentage of EBIT from the region is still much greater than the percentage of revenue meaning that Nike continues to “leverage” China’s growth.
Here’s the problem:
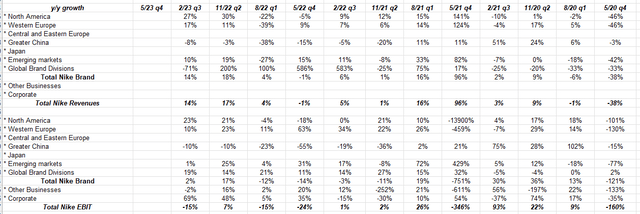
Nike y.y growth in revenue and EBIT (quarterly earnings / 10-Q’s )
China revenue and EBIT, while falling at a decelerating rate, are still falling year-over-year.
Given the size of China too, you have to think the inventory issue is part of the China slowdown as well.
Valuation: From Obscenely Overvalued to Very Overvalued:
With the 36% drop in Nike’s stock from November ’21, you’d think the valuation would look a little better for the footwear and athletic apparel giant, but the valuation went from ridiculously or obscenely overvalued in late 2021, to just very overvalued at present.
If Nike hits the consensus estimates on Thursday night, June 29th, the actual year-over-year growth for Nike would be +9% in revenue, while full-year EPS fell 14%.
For the next three fiscal years, from fiscal ’24 to ’26, Nike is expected to average 8% revenue growth, and 17% EPS growth, so the analyst consensus is expecting Nike’s inventory, gross margin and China issues to be put behind them.
Nike’s PE in late 21 was about 50x the near estimate versus 34x today, while price-to-cash-flow and price-to-free-cash-flow was 38x and 43x then, versus the 40x and 49x today.
If we “ex cash” from the valuation and compare late ’21 to today, we come up 37x and 41X, versus 38x cash-flow and 48x free-cash-flow today.
Cash-flow and free-cash-flow “per share” have actually declined over the last 18 months, much like EPS, which gets back to the damage a clogged up inventory situation does to a retailer.
Qualitative summary:
The valuation on Nike kept me from owning it for clients for years, but since the drop from the $179 high in late ’21, clients are now seeing some Nike positions in their accounts – in small sizes – given the return-on-invested capital generated by the apparel giant.
The inventory issues have to get fixed and when they are we will likely see improved cash-flow and free-cash-flow although the “constipation” so to speak was not as dramatic as that experienced by a Walmart or an Amazon.
The true strength of Nike is in the power of the brand and their absolute dominance in their niche footwear and apparel markets. Both Nike and Adidas put the upstart Under Armour under the hammer, which was interesting to watch (I actually think it was more Adidas than Nike, that unhinged Under Armour’s growth run, but either way – as the old saying goes – you shouldn’t poke the bear, and Under Armour got mauled for sure.)
Personally, I don’t think you’d ever find Nike at a truly cheap valuation, so you have to take these opportunities when you get them, and at least on a technical basis today – Nike is as oversold as it was in 2008, on the monthly Worden chart.
If by chance, Nike does lower guidance or is cautious about fiscal ’24 guidance which started June 1 ’23, I’d prefer the stock not fall too far below $100 per share.
The late September ’22 lows were down near $82 per share, but because it was a small position for clients, the stock was kept. To get down there again would be a cause for some concern since the SP 500 and the general equity market has rallied smartly off its mid-October ’22 lows.
A trade above $130, and a heavier-volume close above $130 would pop the stock out of a range it’s been in since mid-April ’22.
The risk – reward has greatly improved on Nike the last 18 months, although it’s never truly cheap on a valuation basis.
Depending on what’s heard Thursday night, the inclination is to continue to add more to the Nike position on this pullback.
Analyst’s Disclosure: I/we have a beneficial long position in the shares of NKE either through stock ownership, options, or other derivatives. I wrote this article myself, and it expresses my own opinions. I am not receiving compensation for it (other than from Seeking Alpha). I have no business relationship with any company whose stock is mentioned in this article.
NKE reports 6/29 after the bell
Seeking Alpha’s Disclosure: Past performance is no guarantee of future results. No recommendation or advice is being given as to whether any investment is suitable for a particular investor. Any views or opinions expressed above may not reflect those of Seeking Alpha as a whole. Seeking Alpha is not a licensed securities dealer, broker or US investment adviser or investment bank. Our analysts are third party authors that include both professional investors and individual investors who may not be licensed or certified by any institute or regulatory body.
