Summary:
- Nike’s stock, previously rated as a “Sell” due to high valuation, has declined 37% since 2020, making its valuation multiples more reasonable.
- Despite recent revenue and earnings declines, Nike’s long-term fundamentals remain strong, with a wide economic moat and consistent performance.
- Analysts expect Nike’s bottom line to grow at a CAGR of 9.09% over the next decade, supported by market share gains and share buybacks.
- Given its current valuation and strong support levels, Nike is now rated as a cautious “Buy” for long-term investors.
ozgurdonmaz
My last article about Nike, Inc. (NYSE:NKE) was published four years ago in October 2020 and back then I rated the stock as a “Sell” – and among the nearly 800 articles I have written in last eight years, there are only a few companies (and stocks) I rated as a “Sell”. In the article I wrote the following conclusion:
Don’t get me wrong – Nike is a great business. But the question is, if we should buy the stock right now or if we should wait a few months or quarters and hope for lower prices. Nike is trading for extremely high valuation multiples and also seems to be overvalued when using a discount cash flow analysis. And especially short-term oriented investors might probably buy at the wrong time.
And in the first few quarters after my “Sell” rating, the stock continued to increase, and it was certainly possible to argue that I got it wrong and did underestimate Nike. But in late 2021, the stock peaked around $180 and since summer 2022, the stock is now trading at a lower price (or at best, the same price) compared to the point when my last article was published.
At the time of writing, the stock has declined 37% since the article was published and the logical question now seems: Is Nike cheap enough to be a “Buy” again? In the following article we will examine Nike from different perspectives – including valuation multiples, which became more reasonable, we look at the chart, and we look at fundamentals and growth potential in the years to come. We start by looking at the valuation multiples.
Valuation Multiples
Nike was one of those companies rated as “Sell” due to the extremely high stock price. Or to be more precise: the stock price was extremely high in comparison to the fundamental business, which resulted in very high valuation multiples for the stock. However, since its all-time high, Nike declined almost 60% and this steep decline also had an impact on the P/E ratio and P/FCF ratio (especially as the fundamental business continued to perform well – we will get to this).
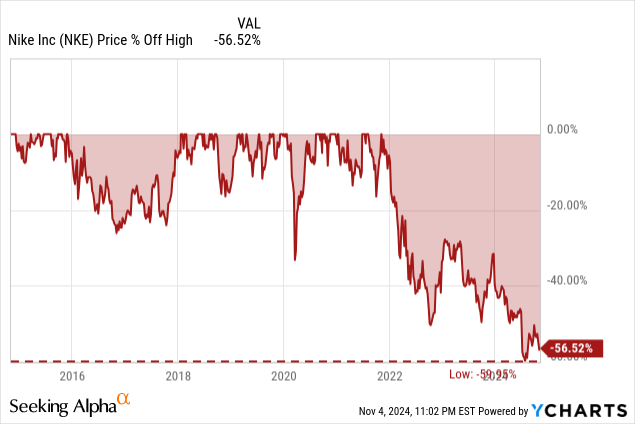
At the time of writing, the stock is trading for 22 times earnings and 16 times free cash flow. When looking at the last 10 years, the stock is now trading for the lowest valuation multiples.
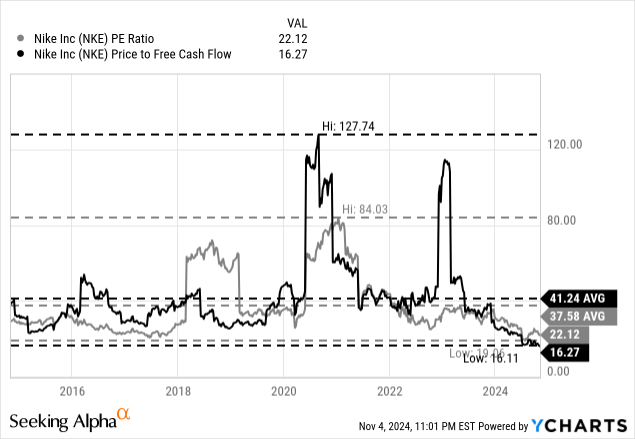
We can argue that 22 times earnings is still not an extreme bargain, but considering the high quality of Nike’s business (we will get to this) is making the stock also not expensive at this point. And 16 times free cash flow for a business that has a wide economic moat and is growing with a solid pace and high levels of consistency (at least the top line) seems certainly justified and might already deserve the label “bargain”. But let’s first look at the quarterly results and the long-term solid performance before we return to an intrinsic value calculation at the end.
Quarterly Results
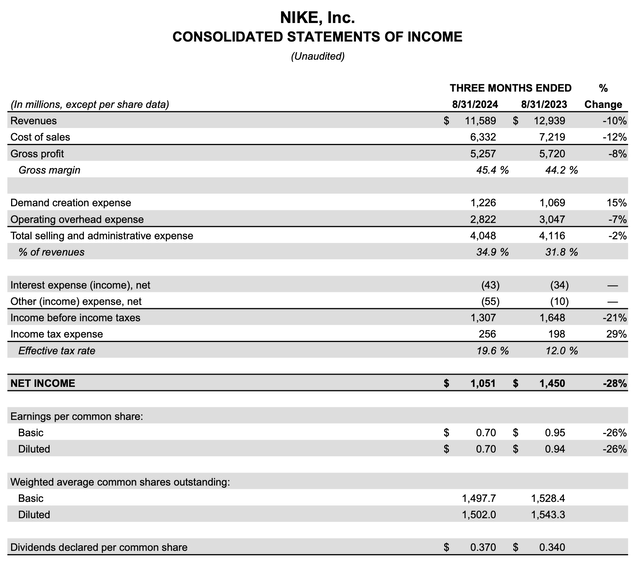
We could argue that Nike’s stock price declined mostly due to the high valuation that was not justified anymore and investors got more cautious. But we can also look at the last quarterly results and the declining top and bottom line was also not helpful for the business and stock price. On October 01, 2024, Nike reported first quarter results and while the business did beat expectations for earnings per share it missed revenue expectations slightly.
When looking at the numbers in comparison to the same quarter last year, the earnings were rather a disappointment. Revenue declined 10.4% year-over-year from $12,939 million in Q1/24 to $11,589 million in Q1/25. Income before income taxes also declined from $1,648 million in the same quarter last year to $1,307 million this quarter – resulting in a decline of 20.7% year-over-year. And diluted earnings per share also declined from $0.94 in Q1/24 to $0.70 in Q1/25 – a bottom-line decline of 25.5% year-over-year.
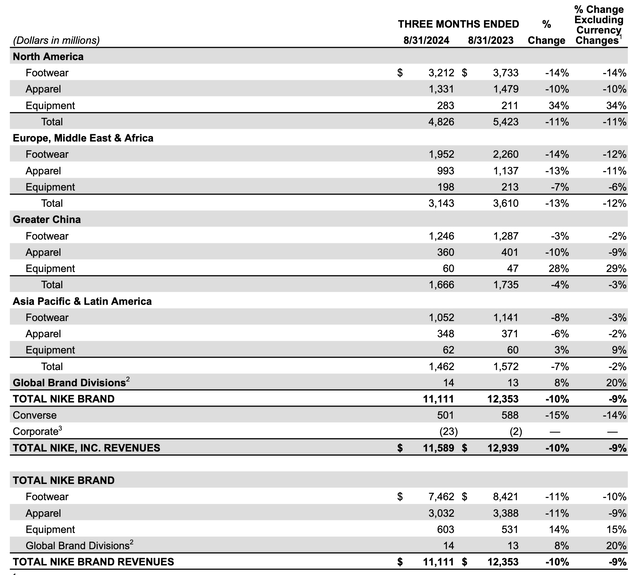
When looking at the different regions all four declined, but it was especially North America as well as Europe, Middle East & Africa struggling. Both declined in the low double digits in the first quarter of fiscal 2025. Greater China declined 4% year-over-year, and Asia-Pacific & Latin America declined 7% (though adjusting for currency exchange rates, the decline was only 2%).
And when looking at the different categories, Equipment increased revenue 14% year-over-year to $603 million, while Apparel as well as Footwear both declined 11% year-over-year.
Solid Performance
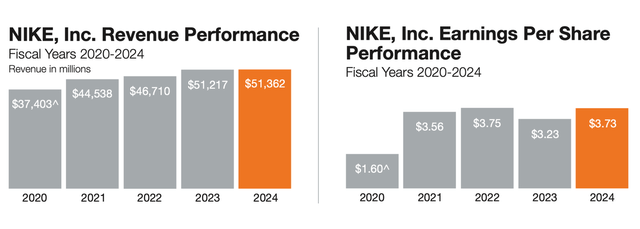
When looking at the last few years, Nike still performed solid. Revenue on an annual basis has continued to increase although top-line growth in fiscal 2024 was only 0.3% year-over-year. Earnings per share fluctuated a little more in the last few years, but EPS for fiscal 2024 was still solid and at a similar level as fiscal 2021 and fiscal 2022. Compared to fiscal 2023, the bottom line increased 15.5% year-over-year.
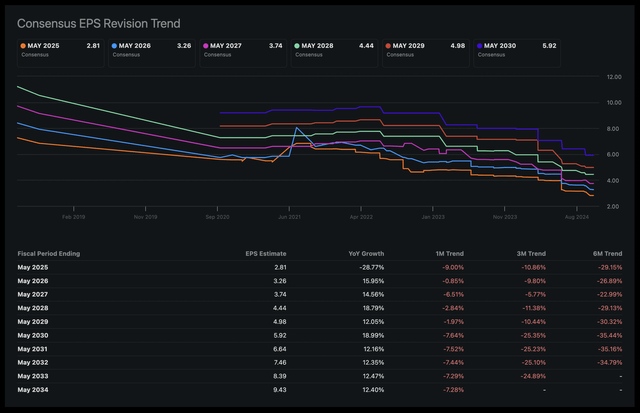
When looking at the earnings revisions in the last few quarters, we see that analysts are constantly getting more pessimistic and assumptions for the next few years are constantly lowered. For example, about three years ago, analysts were still expecting earnings per share for fiscal 2025 to be as high as $6.80 – now analysts are only expecting $2.81 in earnings per share.
But while expectations were constantly lowered in the last few years, analysts are still expecting Nike to grow its bottom line in the years to come. Following a decline in fiscal 2025, analysts are expecting double-digit growth rates again. And between fiscal 2024 and fiscal 2034, Nike’s bottom line is expected to grow with a CAGR of 9.09%.
Different studies expect the apparel market to grow only in the mid-single digits in the years to come. Grand View Research is expecting the global apparel market to grow with a CAGR of 4.1% until 2030 and the U.S. market to grow only 3.3%. Another study from Mordor Intelligence is a little more optimistic and expecting an annual growth rate of 4.6% for the same timeframe. And other studies focusing especially on the sports apparel market are more optimistic and are expecting growth rates of 6.5% annually.
If we assume that the overall market will grow only in the mid-single digits and analysts are expecting high single-digit to double-digit growth rates for the bottom line, we must ask where the higher growth rates should come from. One simple answer is: by taking market shares from competitors, which seems likely and might actually contribute to higher top-line growth.
Share Buybacks
Bottom-line growth can also stem from share buybacks and in the last few decades management used the tool of share buybacks frequently. In the last ten years, Nike decreased the number of outstanding shares with a CAGR of 1.63% and in the last 20 years, the number of outstanding shares decreased with a CAGR of 1.81%. In the last quarter, Nike spent $1.2 billion on share buybacks
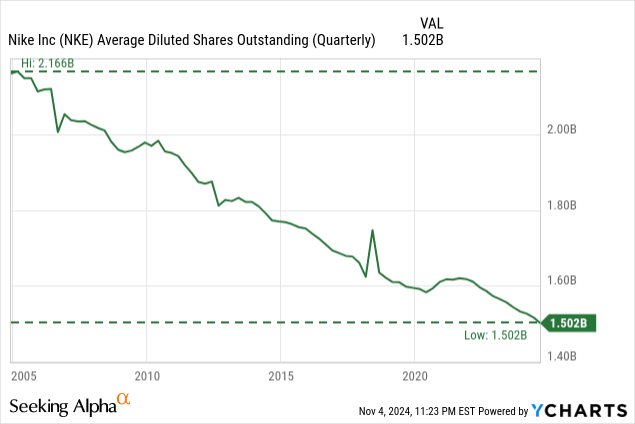
And we can assume share buybacks to contribute in a similar way to bottom-line growth in the years to come, and about 1.5% to 2% annual growth might stem from share repurchases. By the way, share repurchases are more effective right now – in the last few years, Nike bought back shares for rather high prices as the stock was mostly trading for extremely high valuation multiples. Right now, the company might be able to repurchase about 4% of outstanding shares with the generated free cash flow and still have enough cash to keep the dividend at current levels.
Margin Improvement
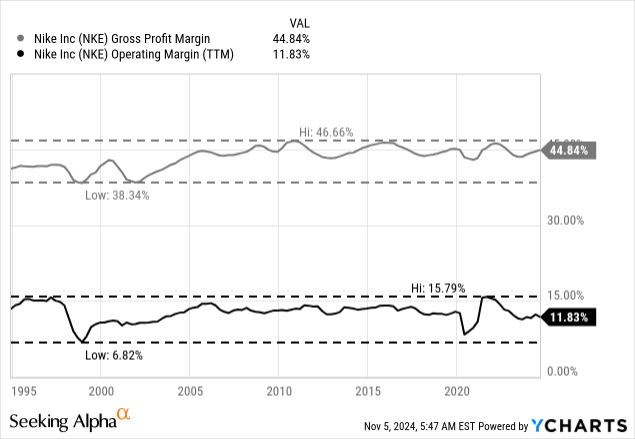
Aside from top-line growth and share buybacks, bottom-line growth can also stem from higher margins and the company being more efficient. But I don’t know if we can assume margin improvement in the years to come. Of course, this could be a huge contributor to bottom-line growth, but when looking back at the last 30 years, we can describe the gross margin as very stable in the last 20 years (which is a good sign as it is showing pricing power) and operating margin was fluctuating over the last 30 years, but we don’t see a clear uptrend.
Performance During Recessions
When talking about growth, we should also look at the opposite site and talk about the risk we are seeing for Nike. And one major risk I see for the business in the coming quarter is the looming recession. This is a risk not only Nike is facing, but as a consumer goods company, it is rather cyclical and often reacting to recessions. Nike is mostly selling products, which are not essential, and a purchase can sometimes be postponed a few quarters or months.
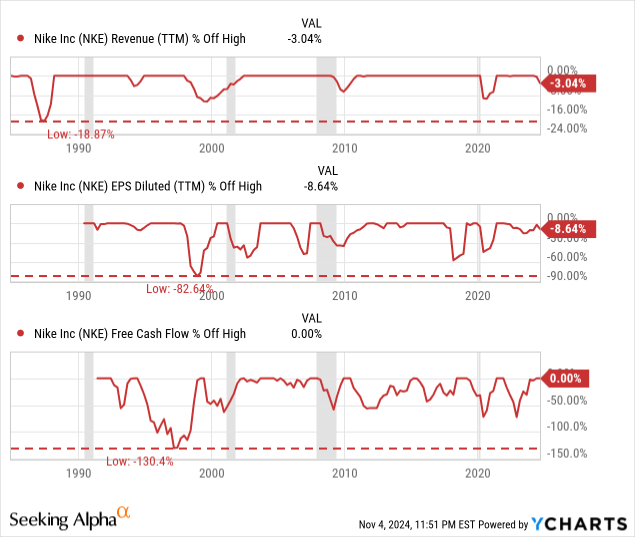
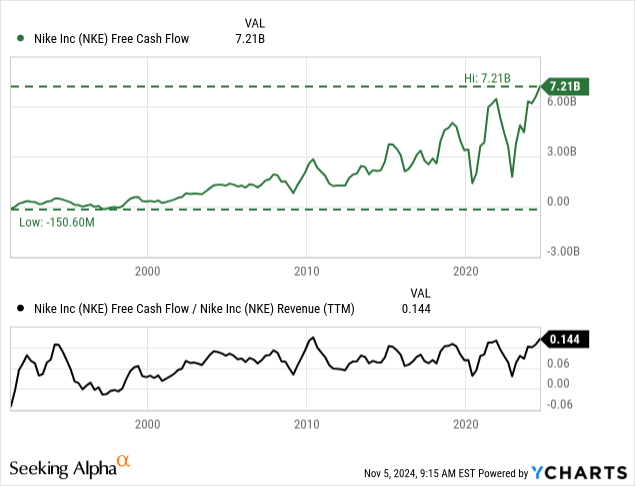
And when looking at data from the last few decades – especially for revenue, earnings per share and free cash flow – we see the business reacting to recessions in the past. It is not always the same pattern, but we see revenue declining around a recession almost every time. In a potential looming recession, we could see a similar pattern. We already see revenue declining for Nike, and the first quarter results for fiscal 2025 (see section above) were certainly not great.
And while sales in Greater China might improve again in the next few quarters – as the situation in China might overall get better (see my article Tencent (OTCPK:TCEHY) and Alibaba (BABA) for more details) – sales in the United States and Europe might come further under pressure. But that is only a temporary decline. Over the long run, I am rather optimistic about Nike growing its business.
High-Quality Business
The reason I am long-term optimistic about Nike is very simple. Nike is a high-quality business with a wide economic moat. In my first article about Nike, I described the moat in more detail, which is mostly based on the brand name as well as cost advantages the company has.
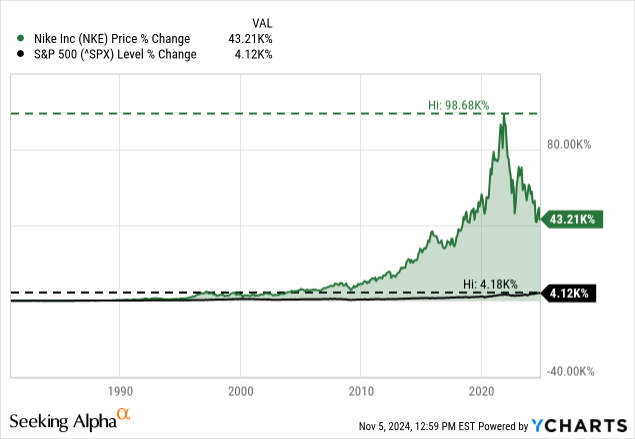
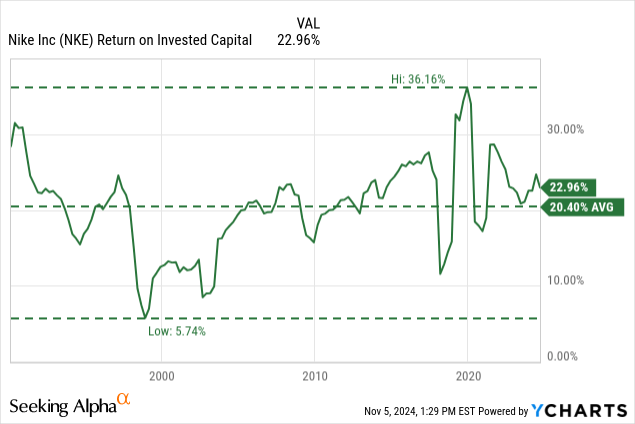
When looking at the outperformance of Nike vs. the S&P 500 during the last four quarters, we see a really impressive outperformance of Nike, which is a strong hint for a wide economic moat around the business. A second major metric we can look at is the return on invested capital, which was above 10% in almost every year since the early 1990s and 20.4% on average in the last three decades and 24.24% on average in the last ten years
And finally, a stable (or improving) gross and operating margin is also a strong sign for a wide economic moat. And as I have mentioned above, especially Nike’s gross margin is showing strong signs of stability and consistency.
All these points make me optimistic about the long-term potential of Nike, as a wide economic moat is leading to pricing power and the ability to fend off competitors.
Intrinsic Value Calculation
I already mentioned above that Nike’s valuation multiples declined in the last few quarters, and we can describe the current P/E ratio and especially P/FCF ratio as reasonable. Additionally, we are using a discount cash flow calculation to determine an intrinsic value for the stock. As always, we are calculating with a 10% discount rate (that is the annual return we like to achieve at least) and the last reported number of diluted outstanding shares (1,502 million). As a basis, we can use the free cash flow of the last four quarters and although free cash flow is at an all-time high, I would still see it as a reasonable assumption for Nike.
For the next ten years, I assume similar growth rates as analysts, and we are calculating with 9% growth followed by 4% growth till perpetuity. When calculating with these assumptions, we get an intrinsic value of $111.57 for Nike and the stock could be considered undervalued at this point, and it might even be a bargain.
Technical Picture
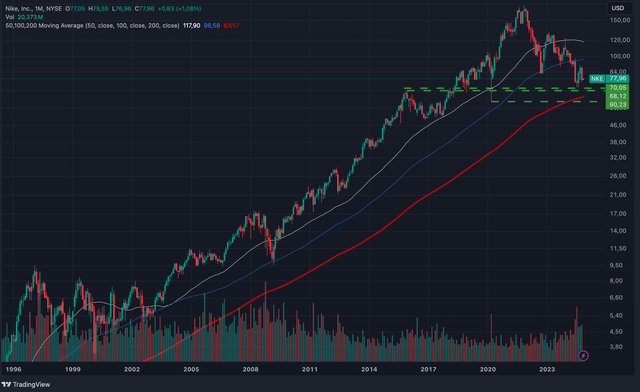
When trying to answer the question at which price we should buy Nike, we can also look at the chart. And the stock seems already close to a major support level, but might decline a little lower. For starters, we have the 200-months simple moving average at $64, which is often a strong support and the bottom in a major correction. Additionally, we find the highs of 2015 as well as the lows of December 2018 around $68 – generating another strong support level. Finally, around $60 we have got to COVID-19 lows, but that was rather a single spike and maybe not such a strong support level.
And Nike already declined close to $70, and therefore I don’t know if the stock will decline much lower again or if it has found its bottom, but between $65 and $70 (if the stock should drop there again) we find the buying range.
Conclusion
At this point, I certainly must change my rating, as Nike is not a “Sell” anymore. I though long about whether Nike is now a “Buy” or if we should rate it as a “Hold” but in the end, Nike is trading about 20% below its intrinsic value and seems close to a strong support level, which makes it a cautious “Buy” in my opinion.
Of course, Nike is struggling right now, and the next few quarters will not be easy for a company that is depending on consumer sentiment. But in the long run, the wide economic moat will lead to high-growth rates. And this makes Nike a cautious “Buy” at this point.
Analyst’s Disclosure: I/we have a beneficial long position in the shares of BABA, TCEHY either through stock ownership, options, or other derivatives. I wrote this article myself, and it expresses my own opinions. I am not receiving compensation for it (other than from Seeking Alpha). I have no business relationship with any company whose stock is mentioned in this article.
Seeking Alpha’s Disclosure: Past performance is no guarantee of future results. No recommendation or advice is being given as to whether any investment is suitable for a particular investor. Any views or opinions expressed above may not reflect those of Seeking Alpha as a whole. Seeking Alpha is not a licensed securities dealer, broker or US investment adviser or investment bank. Our analysts are third party authors that include both professional investors and individual investors who may not be licensed or certified by any institute or regulatory body.
