Summary:
- NIKE has proven itself time and time again to be a high-quality company with a bright future ahead of it.
- This is in spite of the fact that margins have come under pressure, weakening the bullish claim that shareholders might have.
- NKE stock is pricey, and most probably the stock has limited room to run as a result.
littleny/iStock Editorial via Getty Images
I believe that few people would disagree with me in saying that NIKE (NYSE:NKE) is one of the truly great American businesses. These days, the company has grown to be a global player in the production and sale of athletic footwear, apparel, equipment, accessories, and services, all dedicated to an active and stylish lifestyle, though less than 40% of its revenue still comes from North America. In the long run, the company has done quite well for itself and its investors, and that trend looks set to continue in the years to come. For anybody with a very long-term investment horizon, I have a difficult time thinking that a real loss of capital could be achieved by buying stock in the business. But there is a difference between generating a loss and missing out on even more attractive prospects.
Recently, the financial picture for the company has been less than ideal. Revenue growth has been impressive, but high costs have put margins under pressure. The good news is that these margin issues should be transitory. But even with this factored in, shares of the company do look to be quite pricey at this time. I wouldn’t go so far as to say that the business is overvalued. After all, high-quality companies that serve as industry leaders often deserve a loftier multiple than the companies they are dominating over. But I would say that NKE stock is expensive enough to justify investors looking elsewhere for opportunity.
A solid, but lumpy track record
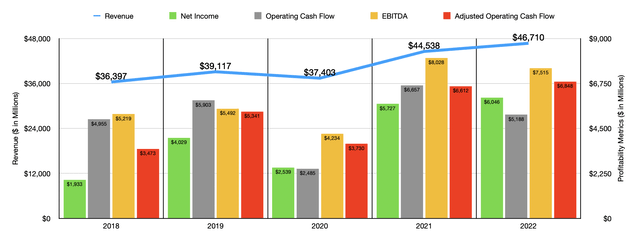
Over the past several years, the financial trajectory seen by Nike has been quite solid. From 2018 through 2022, revenue of the company grew from $36.40 billion to $46.71 billion. That translates to a year-over-year growth rate of 6.4%. Even during the COVID-19 pandemic, the business fared well, with revenue in 2020 coming in only 4.4% below what it was in 2019. The growth the company has experienced over this time has largely been the result of higher pricing and an increase in the number of units sold. But this has varied some from year to year. In 2022, for instance, footwear sales saw a volume decrease of 3%, while average selling price increases contributed 7% to that category’s growth. That alone makes a huge impact when you consider that 66% of the company’s revenue comes from its footwear products. That compares to just 30% for apparel and the remaining 4% for equipment.
On the bottom line, the picture has been far more volatile. This can be seen in the chart above. What we do know is that the 2021 and 2022 fiscal years were particularly positive for the company. Last year, for instance, management reported profits of $6.05 billion. Beyond any doubt, the increase in revenue contributed to this. But the company also benefited from higher prices, foreign currency fluctuations, and other factors, that all increased its gross profit margin from 44.8% to 46%. One really bright spot for the company seems to be what it calls NIKE Direct. This portion of the business consists of its company-owned retail stores and sales through its digital platforms.
Under the Nike brand name, sales under the NIKE Direct set of operations totaled $18.73 billion in 2022. That’s 14.4% higher than the $16.37 billion reported only one year earlier. And much of this growth is associated with the digital sales that the company achieves. Last year, digital sales under Nike came out to roughly $10.7 billion. That’s significantly higher than the $9.1 billion reported one year earlier. Obviously, this is a massive endeavor by the company and one that management acknowledges requires a significant investment. But it gives the company more control over its distribution, what it charges, and permits it to capture profits that otherwise would go to other distributors.
There are, of course, other profitability metrics that warrant consideration. Operating cash flow is one. As the initial chart in this article demonstrates, it has also been quite volatile. But some of that volatility goes away when we adjust for changes in working capital. With the exception of the 2020 fiscal year when the metric fell to $3.73 billion, the overall trend over the past five years has been higher. The metric has gone from $3.47 billion to $6.85 billion over this window of time. Along the way, EBITDA has followed a similar trajectory. The only difference is that it experienced some weakness in 2022, falling to $7.52 billion from the $8.03 billion it ended in 2021.
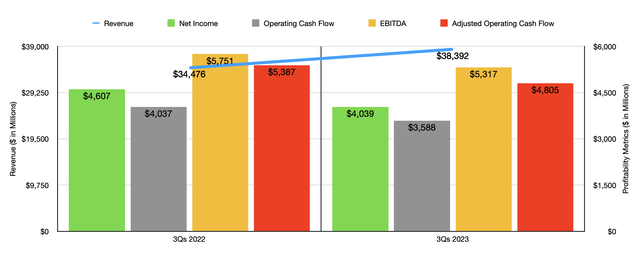
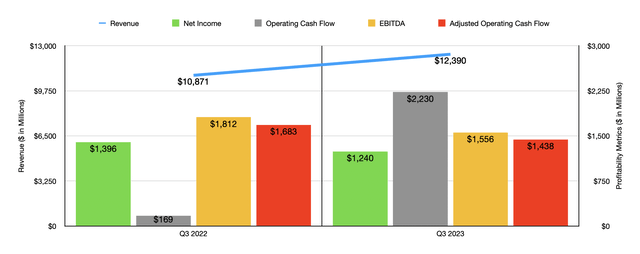
From a revenue perspective, the 2023 fiscal year has been quite solid for the company. In the chart above, you can see results covering the first three quarters of the fiscal year. And in the chart below, you can see results covering just the most recent quarter. Revenue is up soundly relative to what it was one year earlier. During the first three quarters of the 2023 fiscal year, revenue of $38.39 billion was 11.4% higher than the $34.48 billion reported one year earlier. Footwear fared remarkably well, with sales spiking approximately 16%, and with NIKE Direct sales shooting up approximately 13%. Growth would have been even stronger had it not been for foreign currency fluctuations. According to management, unit volume jumped 15% on its own, while higher average selling prices per pair added 9% to the company’s top line on a currency-neutral basis.
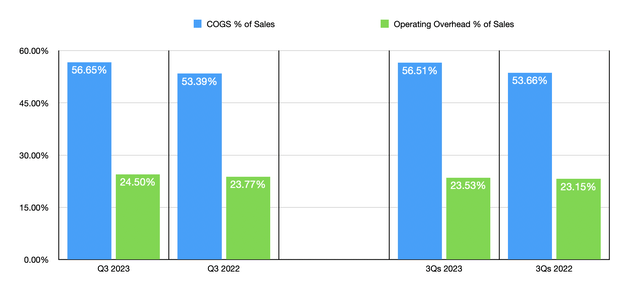
You would think that this would be a recipe for success for the company’s bottom line as well. But this has not been the case. In the first nine months of 2023, for instance, net profits were only $4.04 billion. That’s actually down 12.3% compared to the $4.61 billion reported one year earlier. This is a multifaceted problem that requires some digging. Part of this problem relates to a significant contraction regarding the company’s gross profit margin. In the first nine months of the 2023 fiscal year, this number came out to 43.5%. That’s down from the 46.3% reported one year earlier. Although this may not seem like a significant difference, when applied to the revenue generated during that window of time, it translated to $1.07 billion of missed profits. Management attributed this to a combination of factors. For instance, higher product costs, driven by an increase in input costs and elevated inbound freight and logistics costs, proved to be problematic. A change in product mix, as well as the lower margins associated with NIKE Direct, we’re also instrumental in hurting the company. There were other factors as well, such as greater promotional activity aimed at liquidating inventories, foreign currency fluctuations, and more.
During this window of time, the company also saw a modest increase in its selling and administrative costs relative to sales. That number came out to roughly 0.1%, hitting the company’s pretax profits to the tune of $38.4 million. While investors can and should debate how long elevated pricing will last, a truly one-time event for the company that should be positive for bulls involves the company’s effective tax rate. This number was 18.5% during the first nine months of 2023, up from the 12.7% seen one year earlier. This alone impacted bottom line results negatively to the tune of $246 million. An eventual reversion back to lower tax rates should help the company down the road.
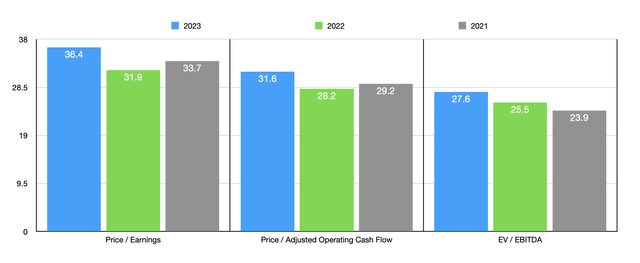
It’s unclear at this time what the rest of the 2023 fiscal year would look like. But by annualizing results experienced during the first nine months, I estimated profits for the 2023 fiscal year at $5.30 billion. Adjusted operating cash flow should be around $6.11 billion, while EBITDA should come in at around $6.95 billion. Based on these numbers, the company is trading at a forward price to earnings multiple of 36.4. The forward price to adjusted operating cash flow multiple should be 31.6, while the forward EV to EBITDA multiples should be around 27.6. As you can see in the chart above, these numbers are higher than what we get using data from 2021 or 2022. But even if results were to revert to what they were, the stock would still look a bit lofty. As part of my analysis, I also compared the company to five similar firms. Using both the price to earnings approach and the EV to EBITDA approach, I calculated that it was trading as the highest of the group. Meanwhile, using the price to operating cash flow approach, three of the four companies with positive results were cheaper than it.
| Company | Price / Earnings | Price / Operating Cash Flow | EV / EBITDA |
| Nike | 36.4 | 31.6 | 27.6 |
| Deckers Outdoor (DECK) | 26.4 | 31.0 | 17.0 |
| Crocs (CROX) | 16.9 | 15.1 | 12.5 |
| Skechers U.S.A. (SKX) | 21.1 | 33.1 | 11.0 |
| Steven Madden (SHOO) | 12.6 | 10.2 | 8.0 |
| Wolverine World Wide (WWW) | 5.6 | N/A | 8.2 |
Takeaway
From all that I can see at this point in time, Nike still remains a great growth business. In the long run, I suspect the company will continue to grow in both its top and bottom lines. For somebody going into a coma for, say, the next 10 or 20 years, it could very well make sense to put money into it. But given how pricey the stock is at the moment and how pricey it is even if results revert to what they were in prior years, I would argue that there is a risk of underperformance from a shareholder return perspective. Given this, I do believe that the company makes for a better ‘hold’ prospect than a ‘buy’ prospect at this time.
Analyst’s Disclosure: I/we have no stock, option or similar derivative position in any of the companies mentioned, and no plans to initiate any such positions within the next 72 hours. I wrote this article myself, and it expresses my own opinions. I am not receiving compensation for it (other than from Seeking Alpha). I have no business relationship with any company whose stock is mentioned in this article.
Seeking Alpha’s Disclosure: Past performance is no guarantee of future results. No recommendation or advice is being given as to whether any investment is suitable for a particular investor. Any views or opinions expressed above may not reflect those of Seeking Alpha as a whole. Seeking Alpha is not a licensed securities dealer, broker or US investment adviser or investment bank. Our analysts are third party authors that include both professional investors and individual investors who may not be licensed or certified by any institute or regulatory body.
Crude Value Insights offers you an investing service and community focused on oil and natural gas. We focus on cash flow and the companies that generate it, leading to value and growth prospects with real potential.
Subscribers get to use a 50+ stock model account, in-depth cash flow analyses of E&P firms, and live chat discussion of the sector.
Sign up today for your two-week free trial and get a new lease on oil & gas!

