Summary:
- NIKE is the largest athletic footwear and apparel brand in the world, with revenues more than double its nearest competitor.
- The company generates the majority of its revenues from sports footwear and sporting/leisurewear apparel.
- NIKE’s direct-to-consumer strategy has led to significant growth in digital sales, but has not yet resulted in overall sales growth or higher margins.
littleny
Company Description
NIKE (NYSE:NKE) is a US based multinational company which operates in the sports apparel industry. It designs, develops, markets and sells athletic footwear, apparel, equipment, accessories and services. It is the largest athletic footwear and apparel brand in the world – with revenues more than double its nearest competitor.
NIKE sells its products directly to consumers through company-owned stores and an online portal called NIKE Direct. It also sells to retail accounts and a mix of independent distributors, licensees, and sales representatives in many countries throughout the world. The products are mainly manufactured by independent third parties on a contract basis with the majority taking place outside of the US in relatively low-labor cost countries.
NIKE’s key markets include:
- Running (athletics).
- Apparel.
- Sports equipment.
- Basketball.
- The Michael Jordan brand (known as Jordan).
- Soccer (also known as football).
The company reports revenues for NIKE products (including Jordan) as 4 geographic areas and it also reports the revenues of its Converse brand and its licensing division.
The most recent annual report showed the following revenue and margin breakdown:
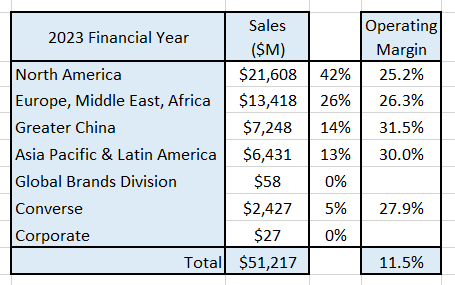
Author’s compilation using data from NIKE’s 2023 10-K filing.
Note that NIKE’s overall operating margin is much lower than the individual segment operating margins because it chooses not to allocate corporate overhead to the operating divisions.
Business Overview
In the last reporting year NIKE generated the bulk of its revenues from sports footwear (65%) and sporting / leisurewear apparel (27%). Footwear is becoming a larger slice of the revenue pie as NIKE is growing these revenues significantly faster than apparel (5-year CAGR 8% vs 5%).
According to GlobeNewswire the global sports footwear market size in 2021 was $197 Billion and is expected to grow at 5% per year through to 2030.
Fortune Business Insights believes that in 2022 the global sports / leisure apparel market was $196 Billion and is expected to grow at 4% per year through to 2030.
Who are the major sector players?
As most of the major companies in this sector are publicly listed, I was able to generate a table showing the historical revenues of the 15 largest brand-owning companies in the sector:
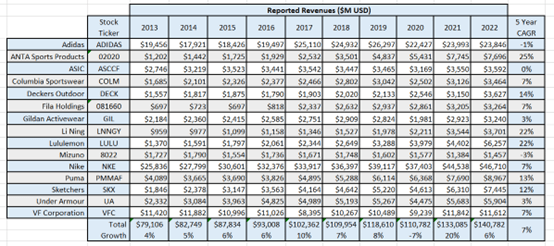
Author’s compilation using data from GuruFocus.
There are a couple of notes to go with the table:
- Over the last 10 years some companies have shifted their financial reporting periods. In those cases, I have shifted their data back one year to avoid any gaps in the table.
- There are 2 private companies of significant size which aren’t shown in the table – New Balance Athletics and Diadora.
The data indicates that the sector is dominated by NIKE and Adidas with NIKE being more than double the size of Adidas. The remaining companies are orders of magnitude smaller than NIKE and Adidas.
These 15 companies comprise about 35% of the sector’s revenues (based on a total sector size of $393 Billion). This leads me to conclude that the sector is very fragmented and with a forecast sector growth rate of 4% to 5% it leads me to conclude that it is close to maturity. This implies that the 15 largest companies have an aggregate growth rate higher than the sector because of market consolidation.
NIKE’s Historical Financial Performance
NIKE’s historical revenues and adjusted operating margins are shown in the chart below:
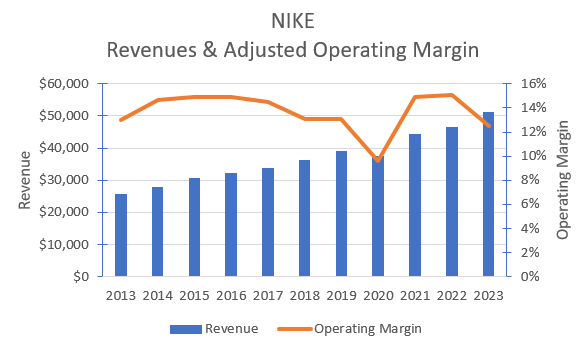
Author’s compilation using data from NIKE’s 10-K filings.
The operating margins have been adjusted for the impact of:
- One-off extraordinary expenses.
- Operating leases (converting the lease payments to debt and depreciation).
- Expensing of demand creation (this expense has been converted back to a capital investment and a notional Demand Creation asset was created with a 3 year expected life).
The chart indicates that NIKE has consistently grown revenues in-line with the other major sector participants (even allowing for the impact of COVID-19) but margins are under some pressure. Like many others, NIKE was able to increase margins during the pandemic, but operating margins peaked at the end of the 1st quarter in 2021 and have now returned to the pre-pandemic trajectory.
NIKE’s operating margins are falling because gross margins are declining and the operating overheads to sales ratio is increasing. NIKE does not provide any breakdown in the composition of its operating overheads, making it difficult to understand what is driving the additional expenses.
I suspect that this is a sign that price competition and costs are rising.
Is NIKE’s current strategy delivering for them?
In 2017 NIKE announced its Consumer Direct strategy. The strategy contained 2 main initiatives:
- establish a direct-to-consumer digital sales channel.
- reduce the number of wholesalers to those prepared to co-invest and grow the NIKE brand.
This also led to a series of divestments of NIKE owned stores in several South American countries.
In 2020 NIKE announced the next stage of the strategy called Consumer Direct Acceleration. This initiative was designed to create the digital marketplace of the future. It led to the enhancement of NIKE’s decision-support capabilities around demand forecasting, consumer insight gathering and inventory management.
In my opinion the key measures of success for this strategy are revenue growth and increasing margins. I have already shown that margins have been declining and the following chart provides further insight into revenues:
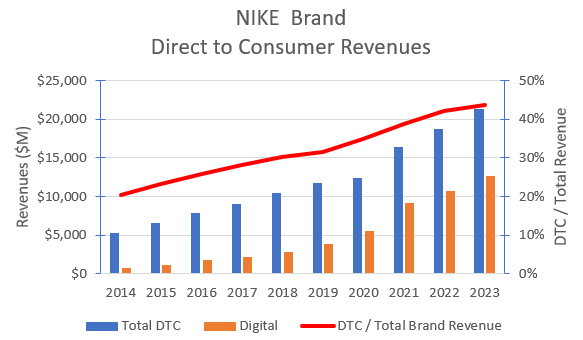
Author’s compilation using data from NIKE’s 10-K filings.
The chart shows that over the last 10 years NIKE has grown its direct to consumer (DTC) revenues from $5 Billion to $23 Billion. DTC now represents almost 44% of total NIKE brand revenues (a 10-year CAGR of 17%).
Although NIKE does not show its digital revenues in its public filings but the high-level revenue numbers are discussed in the quarterly earnings conferences (which is where I have sourced the data). The chart indicates that digital now represents 59% of DTC revenues.
NIKE only discloses profitability for NIKE Brands by region and not by route to market, thus making it impossible to draw specific conclusions about the profitability of the Consumer Direct strategy. However, we do know from the earlier chart that operating margins (except for the COVID period) are showing a declining trend.
Has the Consumer Direct strategy delivered for NIKE?
NIKE has successfully built a DTC business with a strong digital sales channel, but this has not yet led to additional total sales growth (a previous table showed that NIKE’s revenues have grown in-line with their major competitors) or higher margins.
It is not surprising that margins have not significantly increased given that NIKE has not changed its retail footprint (as shown in the following chart):
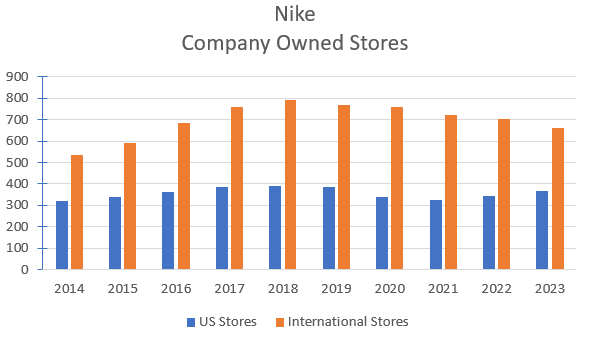
Author’s compilation using data sourced from NIKE’s 10-K filings and quarterly earnings’ transcripts.
The chart shows that the total number of stores has peaked and there is certainly a significant downward trend in the number of international stores (I suspect that the reductions are from the change in South American arrangements). This has yet to be replicated in the US.
A more useful metric would be the total retail area that NIKE occupies (this metric is standard amongst retailers because there is a clear link between retail area, cost and revenue) but this metric is not provided by NIKE, so I am left to draw conclusions based on the absolute number of stores.
In my opinion there is still another phase of the DTC strategy to come where NIKE must start closing large numbers of company-owned stores and direct more traffic through their digital channel if profitability is to increase. I term this “DTC phase 3”.
Clearly my proposed DTC phase 3 strategy is not without risk. There is a significant risk that not all existing store customers will transition across to the digital channel and this may result in sales leakage to other brands.
To significantly reduce operating costs not all stores would need to be closed (although that could provide the highest margin benefit) but nevertheless I think that at least 20% of the stores would need to go. NIKE could execute this strategy over several years starting with the lowest performing stores. This would allow the strategy to be reassessed if the conversion rate of customers from store to digital was unacceptable.
NIKE’s Capital Structure
I do not have any significant concerns over NIKE’s capital structure. The following chart shows the shift in the mix of debt and the market value of equity over time:
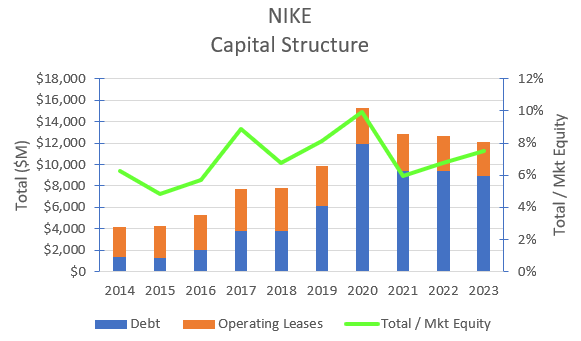
Author’s compilation using data sourced from NIKE’s 10-K filings.
The chart shows that NIKE took on more debt to strengthen its balance sheet during COVID, but they have begun to take this down. NIKE’s debt ratio is currently around 8% whilst the sector’s median ratio is closer to 15%.
NIKE’s Cash Flows
The following table summarizes NIKE’s cash flows over the last 10 years:
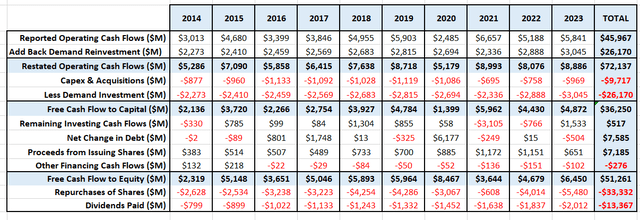
Author’s compilation using data sourced from NIKE’s 10-K filings.
It should be noted that I have made some adjustments to the published Cash Flow statement. In my opinion much of NIKE’s reinvestment back into its business is not adequately represented in the published Cash Flow statement.
A large portion of NIKE’s value is associated with its brand image. NIKE invests in its brand image via its demand creation expense. I have assumed that 75% of the demand creation expense is a capital asset which generates benefits over 3 years.
This means that potentially NIKE’s Income statement understates the true operating profit and the Cash Flow statement understates the true reinvestment requirements of the business.
These adjustments come together in the historical return on invested capital (ROIC) chart:
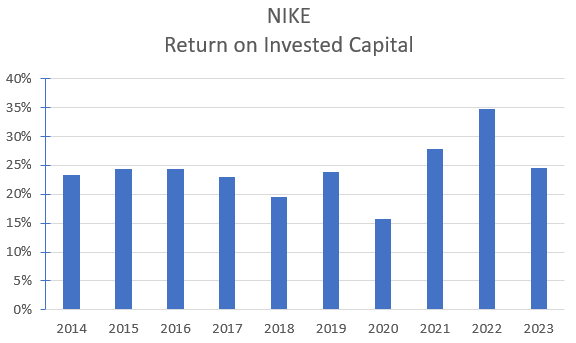
Author’s compilation using data sourced from NIKE’s 10-K filings.
There are 3 key takeaways from the table and chart:
- NIKE has consistently increased its dividend payment year on year. I see no reason for this to stop.
- The current level of share buybacks is unsustainable. Unless the company’s profitability significantly increases then the level of buybacks will need to decline (particularly if the dividend level is maintained).
- NIKE’s ROIC is in the highest decile of the sector where I estimate the median ROIC is 8%.
My Investment Thesis for NIKE
My scenario for NIKE involves my DTC phase 3 strategy. I think that NIKE will begin to reduce their retail footprint and encourage direct retail customers to buy through their digital channel.
Growth Story
The sector is reasonably mature, and the consensus estimate for the sector’s annual growth rate over the next few years is 4% to 5%. The sector is extremely fragmented, and the larger players are consolidating the market which means they are growing faster than the sector. This will continue.
I have used consensus estimates for the next 2 years of revenues (which takes account of the changes caused by the new channel arrangements in South America). For the following 4 years I assume that NIKE’s growth rate will decline slightly from its historical levels. NIKE’s revenues have been growing at 7% per year for the last 10 years but I am forecasting a 5% growth rate into the future because there will be some sales loss caused by the store closures. I have used a terminal growth rate of 4%.
Margin Story
Notwithstanding the margin benefits that NIKE managed to gain during COVID, the long-term trend for margins has been down. NIKE’s current operating margin is above the sector average (around the 66th percentile). As NIKE begins to close some stores, margins will increase, and I expect that they will settle at around 18% in the long term (which is the sector’s 90th percentile).
Growth Efficiency
NIKE will need to continue to invest in its brand particularly as it reduces its presence in some shopping centers. NIKE’s current sales / invested capital ratio is currently near 2.3 which is close to the sector’s 90th percentile (typical companies in the sector generate sales of $1.30 for every $1 invested). There can be no reduction in the level of reinvestment to support the brand into the future.
Risk Story
The sector has a cost of capital which is slightly higher than the market average (I estimate that NIKE’s current cost of capital is 9.4% versus the market median 8.6%). NIKE’s cost of capital is higher due to its relatively low gearing. I have assumed that NIKE’s terminal cost of capital is the current market’s median thus reflecting the market risks involved in my scenario.
Competitive Advantage
I have assumed that NIKE’s brand image allows it to make returns above its cost of capital in perpetuity.
Key Assumptions in NIKE’s Valuation
The following table summarizes the key inputs into the valuation:
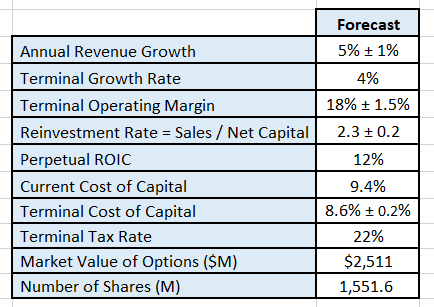
Author’s model inputs.
Discounted Cash Flow Valuation
The output from my DCF model is:
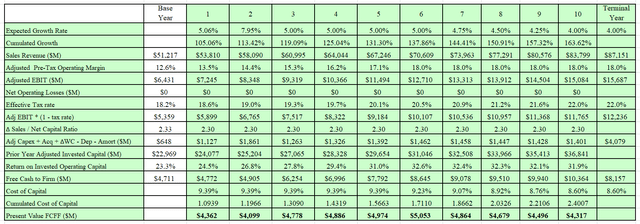
Author’s model output.
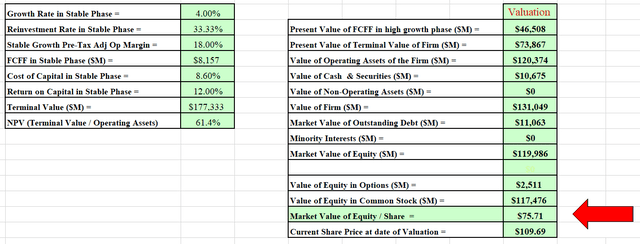
Author’s model output.
I also developed a Monte Carlo simulation for the valuation based on the range of inputs for the valuation. The output of the simulation was developed after 100,000 iterations.
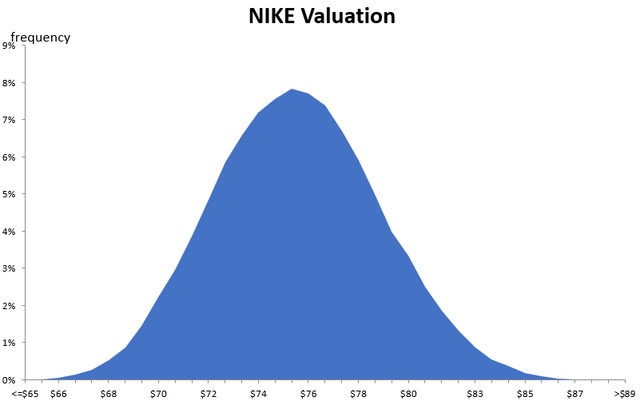
Author’s model output.
The Monte Carlo simulation not only indicates the extremes of the valuation, but it can be used to help understand the major sources of sensitivity. In this scenario the valuation is most sensitive to the stable phase operating margin.
The intrinsic value for NIKE in this scenario is between $65 and $89 per share with an expected value around $76.
Based on my scenario I conclude that NIKE shares are currently expensive and that the stock is over-priced.
Inputs Required to Justify Current Price
My model can also be used to reverse engineer the current share price and see what inputs are required to generate a value equivalent to the current share price.
To test what inputs would be required to justify NIKE’s current market price ($110) I constructed the following table which shows the resulting valuation if either the terminal operating margin or the expect sales growth were changed:
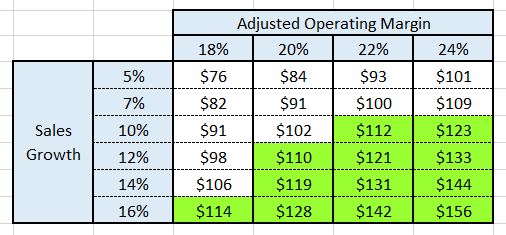
Author’s model.
Readers should remember:
- NIKE’s current adjusted operating margin is 12.5% and prior to COVID was 13.1%. During COVID margins expanded to 15.4%.
- NIKE’s 10-year and 5-year revenue CAGR are almost identical at 7.1% per year.
The table indicates that to justify the current share price, NIKE’s sales growth and operating margins must increase to levels which appear to be highly improbable.
For these reasons I conclude that NIKE is currently more than likely to be expensive relative to its intrinsic value.
Final Recommendation
NIKE is one of the world’s leading brands and as a result it has been able to generate higher average margins and higher returns on capital relative to its competitors.
The footwear and accessories sector is relatively mature but the larger companies in the sector have had the benefit of market consolidation to keep growth rates relatively high. This situation should continue.
The problem for companies in a maturing market is that margins tend to compress as competition intensifies for the declining sector’s revenue growth. There is certainly evidence that this is occurring in this sector. As a result of NIKE’s brand power it has taken the opportunity to break the traditional retail paradigm by selling both directly to consumers and via a limited number of wholesalers.
In NIKE’s case its strategy to date has not led to revenue growth above its competitors or has it stopped the long-term trend of margin decline.
In my opinion NIKE must shrink its retail footprint and convert those customers to its digital channel if it wishes to significantly increase its margins. This strategy is not without risk and could lead to lower sales growth which would also be difficult for investors to accept.
Management has a tough problem to solve.
Is NIKE today a buy, hold or sell?
From an investment perspective, long-term shareholders have suffered lower returns than a comparable investment in the SPDR S&P 500 ETF (SPY) for many years. The table below shows the relative performance of the stock:

Author’s compilation using data from Yahoo Finance.
The table shows that investors need to be very careful about the price that they pay for their investments. I have valued NIKE every year since 2016 and it is rarely cheap. On the few occasions where it was cheap, I purchased the stock and made money on the investment, but I have always sold down when the share price rallied and I found the stock to be expensive.
I believe that NIKE is a SELL at today’s prices. My analysis suggests that the company is currently priced about 23% higher than the upper limit of my valuation. Now that is not to suggest that the market price could go higher but it would not be driven by economic fundamentals.
The current macro environment is quite uncertain. This is a good time for NIKE investors to reduce risk and to take some cash to the sidelines until a clearer economic path is established for NIKE.
Analyst’s Disclosure: I/we have no stock, option or similar derivative position in any of the companies mentioned, and no plans to initiate any such positions within the next 72 hours. I wrote this article myself, and it expresses my own opinions. I am not receiving compensation for it (other than from Seeking Alpha). I have no business relationship with any company whose stock is mentioned in this article.
Seeking Alpha’s Disclosure: Past performance is no guarantee of future results. No recommendation or advice is being given as to whether any investment is suitable for a particular investor. Any views or opinions expressed above may not reflect those of Seeking Alpha as a whole. Seeking Alpha is not a licensed securities dealer, broker or US investment adviser or investment bank. Our analysts are third party authors that include both professional investors and individual investors who may not be licensed or certified by any institute or regulatory body.
