
Summary:
- Nike Inc. is a solid company with 21 consecutive years of increasing dividend payouts and repurchase programs.
- Peer analysis raises concern that the Company is overvalued compared to its competitors, but its high PEG ratio may justify the high multiples.
- NKE has to prove its growth prospects in order to justify the current market price level.
Robert Way
Searching for a solid company that pays dividends is the cornerstone of current market reality. Increasing inflation and interest together with macroeconomic and political instability make investors switch to a “risk-off” strategy and move to “quality” shares. Such a company may be a Nike Inc. (NYSE:NKE) in your portfolio. Being a beneficiary of post-pandemic demand and recent positive earnings together with 21 consecutive years of increasing dividend payouts and the recent repurchase program caught my eye and made me dive deeper into their valuation. Through peer analysis, the latest quarter results, and past performance I will show why I gave it a “Hold” rating and provide my price target.
Company Overview
Nike Inc. is one of the world’s well-known companies that designs and distributes athletic footwear, apparel, equipment, and accessories for various sports and fitness activities. Nike sells its products directly and indirectly. So it has its own stores and digital platform as well as independent distributors. Besides its brand goods, Nike designs products specifically for Jordan Brand and Converse. A variety of products and brands together with interactive services enhance the consumer experience and accelerate growth opportunities. The company has a “Hold” Quant rating with SA and Wall St. Analysts suggesting a “Buy”. NKE provided a 13.17% Total Return to its shareholders in the last 12 months.
Nike 1-Year Total Return (SeekingAlpha)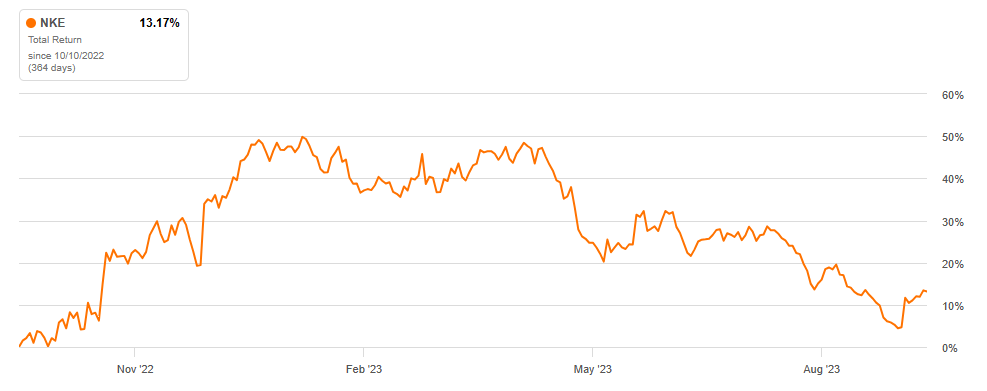
Peer analysis
| NKE | Sector Median | ADDYY | PMMAF | UA | LULU | Average | |
| P/E (FWD) | 25.99 | 14.56 | 25.42 | 21.82 | 12.59 | 30.16 | 22.50 |
| EV/Sales | 2.84 | 1.11 | 1.49 | 1.09 | 0.62 | 4.85 | 2.01 |
| PEG (FWD) | 1.94 | 1.38 | 0.87 | 1.13 | 1.33 | 1.86 | 1.30 |
| P/S (FWD) | 2.9 | 0.82 | 1.23 | 0.9 | 0.5 | 4.85 | 1.87 |
| P/B (FWD) | 11 | 2.22 | 6 | 3.31 | 1.37 | 11.36 | 5.51 |
| Dividend Yield | 1.40% | 2.62% | 0.45% | 1.52% | – | – | 0.99% |
| 1-Year Total Return | 13.17% | 1.23% | 49.99% | 25.85% | 0.64% | 27.69% | 26.04% |
Source: Author, with data from Seeking Alpha
Sector median numbers suggest that Nike is significantly overvalued. It is true even if we calculate an average for the closest competitors, even though these numbers are closer to Nike’s multiples. Average numbers suggest a price of around $85 with the current level of performance. But NKE has also the highest PEG ratio, which means higher growth expectations and may justify high multiples. To confirm the current valuation, I will continue with an alternative technique. Overall NKE’s share performance was in line with Dow Jones Footwear Index and slightly lower than the S&P Index Total Return.
5 -Year Total Return comparison (the company’s statements)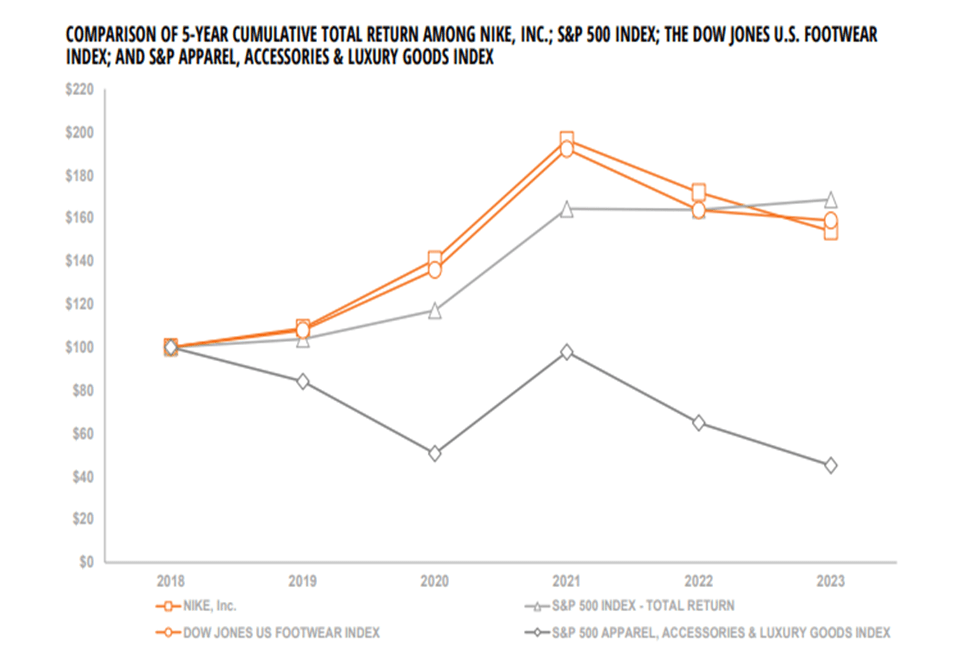
Latest Quarterly Results
• First quarter revenues were $12.9 billion, up 2 percent compared to prior year on a reported and currency-neutral basis
• NIKE Direct revenues were $5.4 billion, up 6 percent compared to prior year on a reported and currency-neutral basis with growth across all geographies
• NIKE Brand Digital sales increased 2 percent on a reported and currency-neutral basis
• Wholesale revenues were $7.0 billion, flat compared to prior year on a reported basis and up 1 percent on a currency-neutral basis
• Gross margin decreased 10 basis points to 44.2 percent
• Diluted earnings per share was $0.94 for the first quarter, up 1 percent
|
Year |
1Q 2023 |
1Q 2022 |
2023 |
2022 |
2021 |
2020 |
2019 |
|
Operating revenue |
100% |
100% |
100% |
100% |
100% |
100% |
100% |
|
Cost of sales |
56% |
56% |
56% |
54% |
55% |
57% |
55% |
|
Gross margin |
44% |
44% |
44% |
46% |
45% |
43% |
45% |
|
Demand creation expense |
8% |
7% |
8% |
8% |
7% |
10% |
10% |
|
Operating overhead expense |
24% |
23% |
24% |
23% |
22% |
25% |
23% |
|
Selling and administrative expenses |
32% |
31% |
32% |
32% |
29% |
35% |
32% |
Source: Author’s compilation based on data from the Company
Despite the revenue increase, the company faced a 1% in selling and administrative expenses compared to last year’s first quarter, but it was in line with last year’s results. Gross margin stayed flat, but operating income was affected by a slight increase in costs. The company expects a further increase in expenses, outpacing revenue growth, but at the same time, gross margin should expand 140-160 basis points.
|
Year |
Q1 2023 |
Q1 2022 |
2023 |
2022 |
2021 |
2020 |
2019 |
|
Operating assets |
|||||||
|
Cash and equivalents |
0% |
0% |
1% |
1% |
1% |
1% |
1% |
|
Accounts receivable, less allowance for doubtful accounts |
17% |
19% |
15% |
17% |
18% |
12% |
22% |
|
Inventories |
31% |
37% |
31% |
31% |
28% |
32% |
29% |
|
Prepaid expenses and other current assets |
7% |
9% |
7% |
8% |
6% |
7% |
10% |
|
Property, plant and equipment, net |
18% |
18% |
19% |
17% |
20% |
21% |
25% |
|
Goodwill |
1% |
1% |
1% |
1% |
1% |
1% |
1% |
|
Identifiable intangible assets |
1% |
1% |
1% |
1% |
1% |
1% |
1% |
|
Deferred income taxes and other assets |
14% |
15% |
14% |
14% |
12% |
10% |
10% |
|
Total operating assets |
100% |
100% |
100% |
100% |
100% |
100% |
100% |
|
Operating liabilities |
|||||||
|
Accounts payable – non-interest-bearing |
25% |
26% |
25% |
27% |
23% |
22% |
23% |
|
Accrued liabilities |
47% |
49% |
50% |
50% |
50% |
50% |
45% |
|
Income taxes payable |
3% |
3% |
2% |
2% |
3% |
2% |
2% |
|
Deferred income taxes and other liabilities |
25% |
21% |
23% |
21% |
25% |
27% |
30% |
|
Total operating liabilities |
100% |
100% |
100% |
100% |
100% |
100% |
100% |
Source: Author’s compilation based on data from the Company
The balance sheet analysis in the table above shows that the company decreased its inventory compared to Q1 2022, but was in line with the yearly figure. The number of receivables was also lower, but close to its average levels. This all confirms the further balance sheet composition used in the valuation segment.
| Year | Q1 2023 | Q1 2022 | 2023 | 2022 | 2021 | 2020 | 2019 |
| Return On Common Equity (ROCE) | 10% | 9% | 34% | 48% | 51% | 29% | 32% |
| Return On Net Operating Assets (RNOA) | 9% | 11% | 32% | 49% | 43% | 25% | 37% |
| Asset Turnover (ATO) | 0.82 | 0.92 | 3.28 | 3.36 | 3.55 | 3.60 | 3.56 |
Source: Author’s compilation based on data from the Company
As can be seen from the table above, despite the declared increase in per-share earnings, the return on net operating assets continues to decrease. EBIT margin, as well as net income, decreased compared to last year. Positive per-share results were reached due to the share repurchase program. Asset turnover decreases with a flat gross margin affects the return on net operating assets.
Risks and Red Flags
Global economic conditions may continue to affect the company’s performance, impacting sales and future growth perspectives. Reduced demands will increase inventories, lower revenues, and gross margins.
Transactions in various currencies are exposed to fluctuations in foreign currency exchange rates, affecting the US dollar results.
Volatility in raw material prices can negatively affect the cost of sales. Due to increasing financial difficulties, certain retailers may cease their operations directly affecting the company’s sales.
Constant share repurchases and dividend payout increases may be a signal that the company is boosting its share price.
The continuing decrease in return on net operating assets may result in decreasing growth perspectives.
Valuation methodology
I used the same methodology as in my previous article. I forecasted balance sheets till 2028. The required return is WACC-calculated, which was outsourced but modified because I use the weighted average cost of debt after tax provided by the company’s statements. Balance inputs depend on the company’s sales figures and the latest earnings transcript.
Valuation inputs and results
| 2023A | 2024E | 2025E | 2026E | 2027E | 2028E | 2028E and after | |
| Gross margin | 43.5% | 45.0% | 45.0% | 45.0% | 45.0% | 45.0% | 45.0% |
| SG&A expense ratio | 31.4% | 33.0% | 33.0% | 33.0% | 33.0% | 33.0% | 33.0% |
| Tax rate | 22.5% | 22.5% | 22.5% | 22.5% | 22.5% | 22.5% | 22.5% |
| Sales growth | 4.0% | 6.0% | 6.0% | 6.0% | 6.0% | 4.0% |
Source: Author’s compilation based on data from the Company
First I start by simulating the income statements till the year 2028 and after. Operating expenses are expected to rise, and so is the gross margin. I assume that the sales will continue to grow 4% this year and will rise to their average growth levels afterward.
Taking into consideration that the company will continue similar performance till the end of the fiscal year, it will reach a return on operating assets of 36%.
The growth rate for residual operating income is an average for the past years. The required return is WACC- calculated and equals 8.05%.
| Year | 2023 | 2024E | 2025E | 2026E | 2027E | 2028E |
| Return On Net Operating Assets | 32% | 36% | 36% | 36% | 36% | 36% |
| Residual Operating Income (ReOI) | 4818 | 4452 | 5316 | 5635 | 5973 | 6331 |
| Growth in ReOI | -8% | 19% | 6% | 6% | 6% | |
| Cost of operations | 8.05% | |||||
| Total Present Value (PV) of ReOI to 2023 | 21821 | |||||
| Continuing value (CV) | 162525 | |||||
| PV of CV | 110349 | |||||
| Net Operating Assets as of 2023 | 15929 | |||||
| Value of operations | 148099 | |||||
| Net Financial Obligations | -1804 | |||||
| Value of common equity | 146295 | |||||
| Number of shares outstanding | 1552 | |||||
| Value per share | $94.26 |
In Millions of United States dollar (USD) except per share items
Valuation risk
The growth rate is an average for the past years. If the growth rate continues to rise this year, it will result in a higher price target. Due to accounting principles, some of the figures I used in my reformulation might be slightly off, but I tried to minimize their influence. The structure of the future balance sheets is based on past statements, but as it may be seen it stays more or less the same. WACC calculations are outsourced, but reasonably match my own.
Conclusion
With the current market price of around $98, it seems to me overvalued. My price target is $94.26, which confirms the concern that it is overpriced now. The company has to prove its sales and margin growth to support the overall market growth forecasts. I give Nike a “Hold” now and will continue to follow its performance.
Analyst’s Disclosure: I/we have no stock, option or similar derivative position in any of the companies mentioned, and no plans to initiate any such positions within the next 72 hours. I wrote this article myself, and it expresses my own opinions. I am not receiving compensation for it (other than from Seeking Alpha). I have no business relationship with any company whose stock is mentioned in this article.
Seeking Alpha’s Disclosure: Past performance is no guarantee of future results. No recommendation or advice is being given as to whether any investment is suitable for a particular investor. Any views or opinions expressed above may not reflect those of Seeking Alpha as a whole. Seeking Alpha is not a licensed securities dealer, broker or US investment adviser or investment bank. Our analysts are third party authors that include both professional investors and individual investors who may not be licensed or certified by any institute or regulatory body.