Summary:
- Nikola’s stock is in a severe downtrend with no support levels, indicating further weakness and bearish sentiment.
- Moving averages and Bollinger Bands confirm the stock’s persistent weakness, with significant resistance levels preventing a potential rally.
- Indicators like MACD, RSI, and stochastics are predominantly bearish, suggesting continued dominance by bears.
- Overall, the technical outlook for Nikola remains highly bearish, with all analyses pointing towards further stock decline.
- Cash burn is also a significant concern, as current cash and equivalents may run out in the near future, making bankruptcy a very real possibility.
Chris Tobin/DigitalVision via Getty Images
Thesis
There is nothing to like about Nikola Corporation (NASDAQ:NKLA) stock. In the below analysis, I determine that the technicals are overwhelmingly bearish for both the nearer term as well as the longer term. Note that a monthly analysis is not provided as the company only went public in 2020. The charts show that the stock is in severe downtrends while the moving averages show strong bearishness. The vast majority of indicator signals were also negative, making further weakness in the stock likely. For the fundamentals, while there is some improvement in revenues and EPS over the past couple of years, the main story is their lack of cash. I determine that with their current cash burn, they may run out of funds in the very near future, making the case that the company may have to declare bankruptcy. When combining the technical and fundamental factors, I believe investors should take what they have left and run as this ship seems to be sinking fast. Therefore, I initiate Nikola at a strong sell rating.
Daily Analysis
Chart Analysis
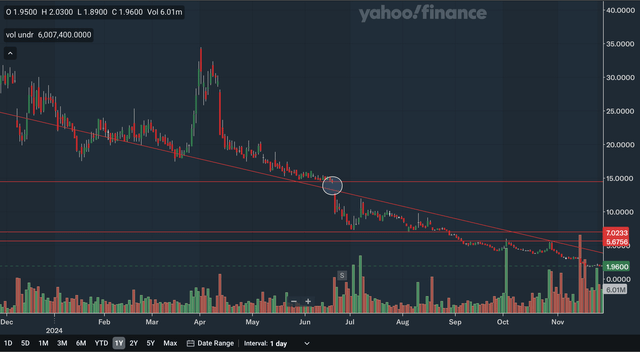
The daily chart is a highly negative one for Nikola as the stock is in a punishing downtrend with no support levels below as the stock continues to hit fresh all-time lows. The downtrend line is the nearest source of resistance, but has only just moved past 5, so the stock still has a chance to bounce as this trend line catches up. Other areas of resistance include the mid-5.6s as that level has been resistance in recent months and the low 7.0s as that level was support earlier in the year. Lastly, there is also very distant resistance at around 15 as that represents a major downside gap. Overall, I believe there is not much to like here, as further weakness in the stock seems likely due to the highly bearish chart.
Moving Average Analysis
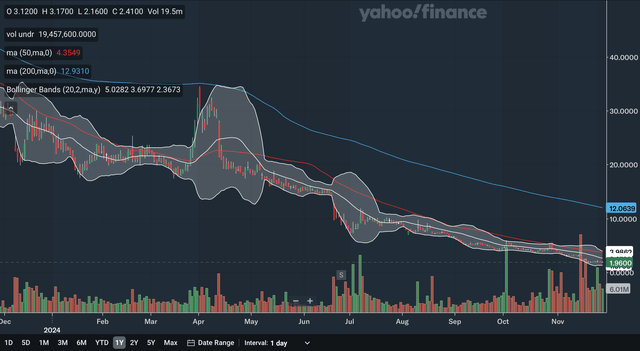
There have been no crossovers between the 50-day SMA and the 200-day SMA in the past year, with the 50-day SMA being below the entire time. The gap between the SMAs continues to be very large, indicating strong bearishness in the stock. The stock trades beneath both of these SMAs, another sign of weakness. For the Bollinger Bands, the stock recently bounced off the lower band, showing that it was oversold. However, since we are in a severe downtrend, the 20-day midline is likely to act as strong resistance on any rally. The midline also currently is the nearest source of MA resistance, as it is below the 50-day SMA. As a whole, these MAs show continued weakness in Nikola stock, as there are no signs here that the stock will wake up and stage a comeback.
Indicator Analysis
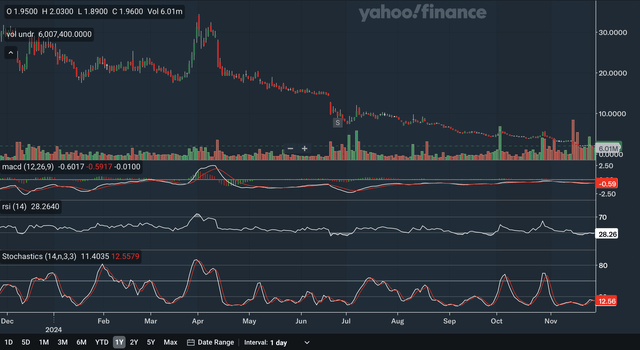
Currently, the MACD and the signal line are virtually at the same level. The MACD line was below the signal line just recently, however. There is no crossover signal here but there seems to be some positive divergence. The stock is currently much below the early July trough but the MACD is much higher than back then. I would warn against getting too optimistic about this signal as I believe that the trough in the MACD back in July is reflecting the sharp decline. The improvement in the MACD since then is merely showing that declines are occurring at a slower pace due to the stock nearing zero. The stock remains in a solid downtrend and I believe this positive divergence signal may not be reliable. For the RSI, it is currently at 28.26 and is therefore in the oversold zone. Being below 50 also means that the bears are in control of the stock and being below 30 shows that the bears are crushing the bulls at the moment. Lastly, for the stochastics, the %K just recently failed to sustain its bullish crossover and has fallen below the %D again, a high bearish signal. The stochastics has not exited the 20 zone in recently weeks, showing that there is sustained bearish momentum in the stock. As a whole, I find that these indicators are mainly bearish as the MACD positive divergence is likely to be a false signal.
Takeaway
The overall near term technical outlook for Nikola is a highly bearish one as all three analyses point towards further weakness in the stock. The chart shows that the stock is in a severe downtrend while the MAs and Bollinger Bands confirm the stock’s weakness. The indicators, as discussed above, are mainly bearish with many indications that the bears are continuing their dominance of the bulls.
Weekly Analysis
Chart Analysis
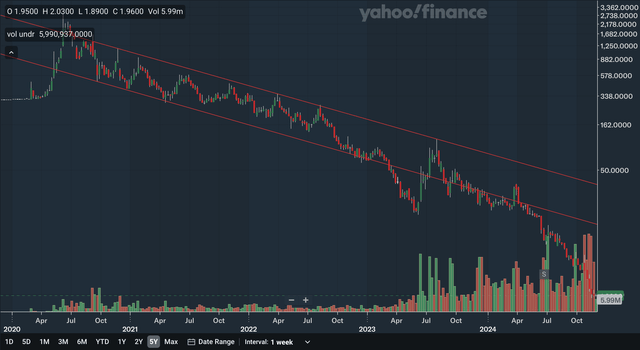
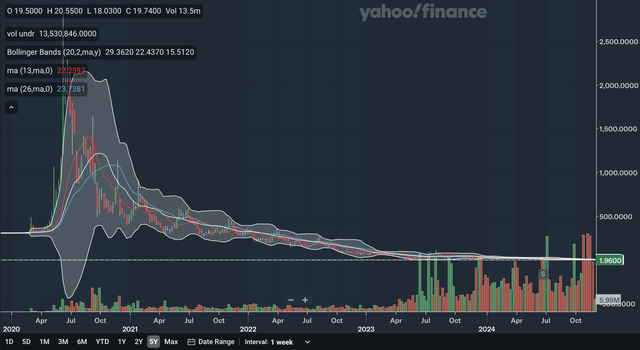
This chart is in a log scale to better show the trend of the declines in the stock. The weekly chart is no better than the daily chart, as the stock has broken down below a downward channel and is in an accelerated downtrend. This downward channel began back in 2020 and the stock decisively broke below it during the middle of this year, an indication that things are getting worse for the stock. The only positive that can be taken here is that the resistance of the lower channel line remains far away, and so the stock does have some room to stage a bear rally. If you look at the recent volume, it is also very concerning as the red volume bars recently are the highest bars in Nikola’s trading history, confirming the recent plunge to all-time lows. Like in the daily chart, I believe there is not much to like here, as the stock’s trajectory has only worsened.
Moving Average Analysis
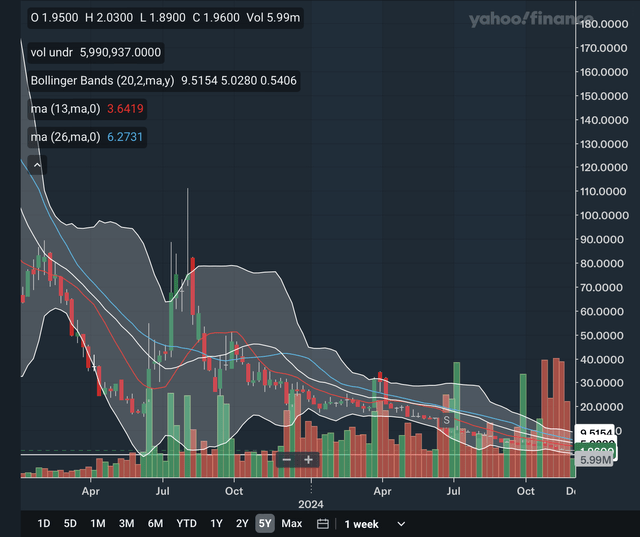
Above is the long-term view of the weekly MAs and on the right I have provided a zoom in so that we can see the recent developments. The 13-week SMA crossed below the 26-week SMA late last year, a bearish indication. Although the gap between the two SMAs has narrowed, I don’t find it to be a significantly positive signal since it merely reflects that the stock has fallen near zero, making the dollar declines lower than before. The stock trades below both of the SMAs. For the Bollinger Bands, the stock is quite the near the lower band currently and could potentially indicate a slightly oversold stock. Note that the bands are in a volatility contraction state currently, and an expansion of volatility could see the lower band move below zero, making room for further declines in the stock. The 20-week midline would likely be resistance on any significant rally. From my analysis, the bearish theme continues into these weekly MAs as there continues to be signs of weakness in the stock.
Indicator Analysis
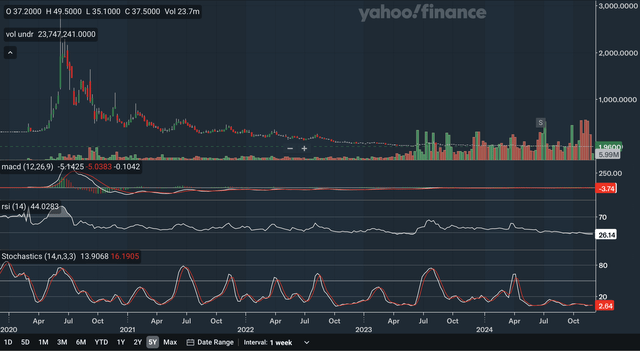
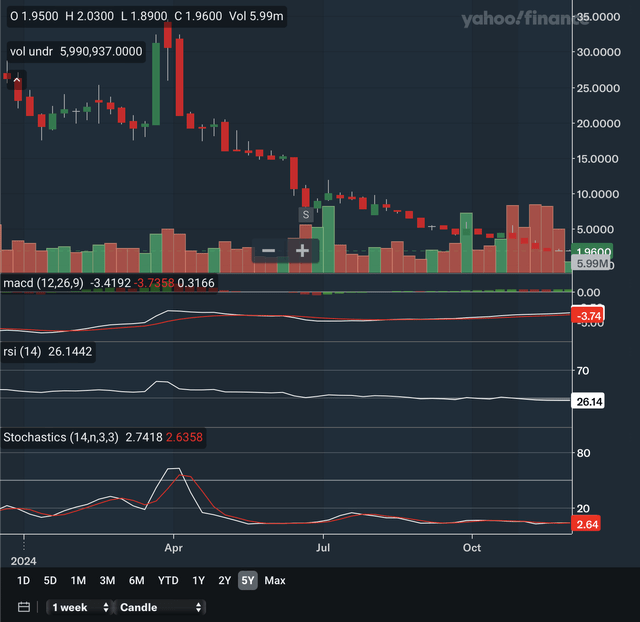
Again, the chart on top is the long-term view and a zoom in is on the right. The MACD is above the signal line after a crossover earlier in the year, the first positive sign for Nikola stock. However, the gap between the lines have remained very small showing that bullish momentum is unable to truly pull away from the bears. Similar to the daily analysis, the MACD here also has positive divergence. I would also take this signal with a grain of salt as again this merely reflects the stock’s dollar declines getting smaller as the stock nears zero. For the RSI, it is currently at 26.14, one of the lowest readings in its trading history. Again, being below 30 here indicates that the bears are dominating the bulls. Lastly, for the stochastics, there has not been a meaningful crossover signal for quite a while. However, the stochastics has remained below 20 since early this year showing that there has been sustained strong bearishness in the stock. Overall, in my view, despite some minor positive indications in the MACD, the majority of signals here point towards continued weakness in the stock.
Takeaway
The long-term technical outlook for Lucid is not pretty as once again all three analyses point towards further weakness in the stock. The charts show that the stock has entered into an accelerated downtrend while the MAs reflect strong bearishness. Lastly, the indicators, although slightly mixed in their signalling, were mainly negative.
Fundamentals & Valuation
Earnings
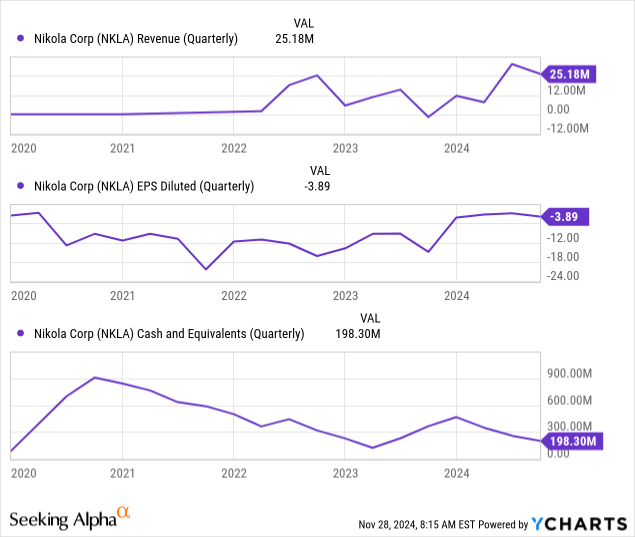
Nikola reported their Q3 earnings back in late October and despite showing some improvement in their operational results, their cash position shows that they are in a grave situation. They reported revenues of $25 million, much better than the negative revenue of $1.7 million in the prior year period. Loss per share also narrowed from $14.90 to $3.89. Both revenue and EPS missed expectations with revenue missing by $11.47 million and EPS missing by $1.57. As you can see in the charts above, revenue and EPS has generally improved from the past couple of years. However, the main concern is with Nikola’s cash burn. The net loss per share reported above translates into a total net loss of $199.781 million. In addition, their adjusted free cash flow for the quarter was -$162.935 million. As you can see above, their cash and equivalents only stand at $198.3 million. This is a grave situation for Nikola as the remaining cash on their balance sheet may not even last them for the current quarter. To avoid bankruptcy, they will likely need to raise more cash and dilute current shareholders. It also won’t be easy to raise cash given that their EPS still has no signs of turning positive any time soon. In fact, adjusted FCF worsened YoY as it was only -$111.949 million in Q3 2023. Raising funds through debt is also unlikely to be successful as even seniority won’t protect creditors given the current cash burn. Therefore, funding options will likely be severely limited, making a bankruptcy a very real possibility.
Valuation
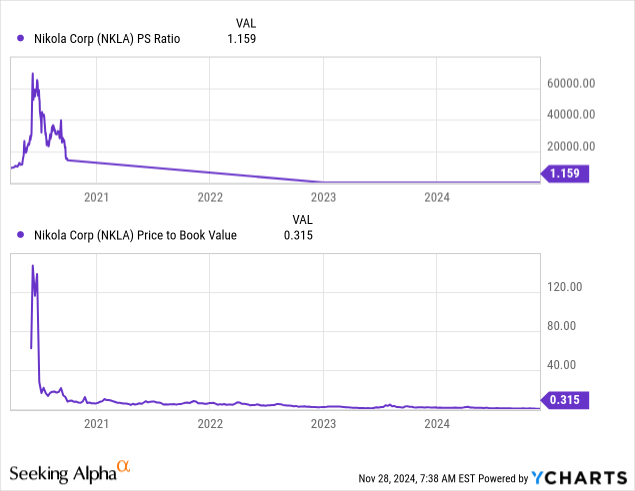
As shown above, the P/S and P/B ratios are at rock bottom levels. If you look at the revenue and EPS charts above, the level in these multiples may seem like they are too low as there has been some improvement in both revenue and EPS over the past couple of years. However, as explained above, Nikola is in a grave cash position and the latest improvements may be too little too late to save the company from bankruptcy. I conclude that this stock is a major value trap as the above P/S and P/B ratio charts fail to capture the full picture. Equity investors are looking at the very real possibility that this stock could drop to zero with cash running out likely in the near future. The valuation multiples are at rock bottom levels for a reason and do not indicate a bargain by any means.
Conclusion
Take your money and run. There really isn’t any other way to put it. The technical analysis showed an extremely bearish picture in both the near and long term with virtually all analysis pointing towards continued weakness in the stock. For the fundamentals, as discussed above, while revenue and EPS has shown some improvement over the past couple of years, it is very likely that it is too little too late as the company risks running out of funds in the very near future. In my view, bankruptcy is the most likely scenario since it will be difficult to raise funds with FCF worsening YoY in the most recent quarter. While investors have already been crushed by Nikola’s steep declines, they may lose their entire investment if they wait any longer to get out of the stock. Therefore after considering the technicals and fundamentals, I believe Nikola now deserves a strong sell rating.
Analyst’s Disclosure: I/we have no stock, option or similar derivative position in any of the companies mentioned, and no plans to initiate any such positions within the next 72 hours. I wrote this article myself, and it expresses my own opinions. I am not receiving compensation for it (other than from Seeking Alpha). I have no business relationship with any company whose stock is mentioned in this article.
Seeking Alpha’s Disclosure: Past performance is no guarantee of future results. No recommendation or advice is being given as to whether any investment is suitable for a particular investor. Any views or opinions expressed above may not reflect those of Seeking Alpha as a whole. Seeking Alpha is not a licensed securities dealer, broker or US investment adviser or investment bank. Our analysts are third party authors that include both professional investors and individual investors who may not be licensed or certified by any institute or regulatory body.

