Summary:
- Rocket Lab stock has surged recently but is likely to experience near-term weakness due to bearish technical indicators and stretched valuations.
- Technical analysis shows distant support levels and bearish patterns, suggesting a pullback is imminent, though long-term prospects remain strong.
- Fundamentals indicate strong revenue growth but widening losses, with the P/B ratio suggesting overvaluation despite promising company developments.
- I rate Rocket Lab as a hold, recommending investors wait for a better entry point once the current correction stabilizes.
Klaus Vedfelt/DigitalVision via Getty Images
Thesis
Rocket Lab USA, Inc. (NASDAQ:RKLB) stock has been on a tear lately, with the stock more than doubling in the past month. Some have referred to this surge as a ‘rocket launch’ but even rockets are subject to gravity. In the technical analysis below, I determine that in the near term Rocket Lab stock is likely to experience weakness as the charts, moving averages, and indicators have turned net bearish in the short term. The stock is likely to fall back to earth to a degree, but my technical analysis also indicates that the long-term future for the stock is bright are there are key signs of strength in the longer time frame. As for the fundamentals, while the P/S ratio is likely justified due to the increasingly strong revenues, the P/B ratio seems to be a bit too high even accounting for the promising developments in the company recently. The P/B has more than quintupled over the past months, an overreaction in my view. Therefore, I believe the technicals and fundamentals agree that a pullback in the stock is likely, and so investors should wait for a better entry point. Nonetheless, the long-term outlook for Rocket Lab is strong, and so I initiate the stock at a hold rating.
Technicals
Charting
Overview
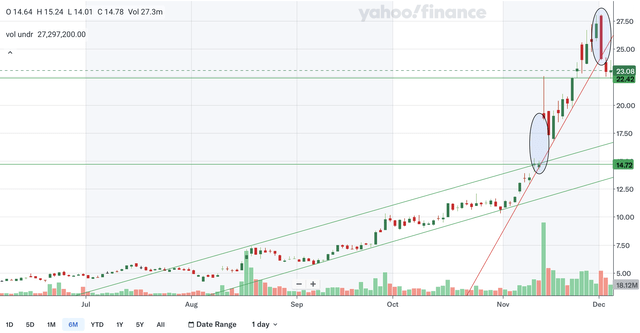
The chart shows a mixed technical picture for Rocket Lab stock since it broke out of an upward channel in November but seems to have reached a near term top in the past couple of trading sessions as it broke below the accelerated uptrend line.
Support Levels
The nearest support level would be in the 22.4s, as that area appears to be highly significant in the past month or so. The next level of support would be the former upper channel line. It is currently nearing 17.5 and could become more relevant as it continues to slope upwards. Moving down, 14.7 could be a key support level as it is a major unfilled upward gap that I have circled above. Note that the volume on that day was extremely high, increasing its significance even further. Lastly, the lower channel line is distant support as it is still far from reaching 15.
Resistance Levels
For resistance, other than the accelerated uptrend line, there is none. The accelerated uptrend line, given its extreme trajectory, is moving out of range. One other thing worth mentioning is that I circled a bearish engulfing pattern that occurred just recently. This indicates that there is a trend reversal and could mean that the near term top is in.
Takeaway
Overall, in my view, for the near term I would say that the outlook is net bearish since other than the support level at 22, the other support is quite far down and with the bearish engulfing pattern, it is unlikely the stock will move back into an accelerated uptrend any time soon. For the longer term, the outlook is still positive as the stock remains above the former upper channel line, indicating overall strength in the stock.
Moving Averages
Simple Moving Average (SMA)
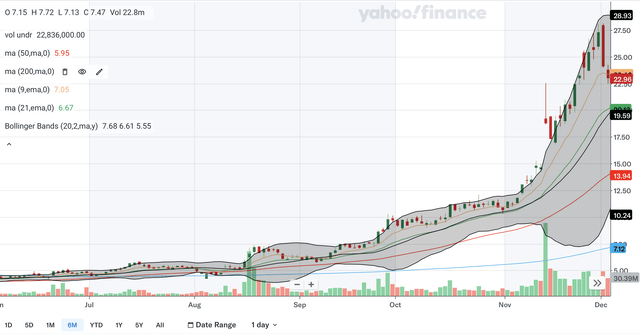
The 50-day SMA and the 200-day SMA had a golden cross back in the middle of the year, a bullish signal. The gap between the SMAs has accelerated its widening, demonstrating relentless bullish momentum in the stock. The stock does trade miles above the SMAs with the 50-day SMA’s support being only at 13.94 currently, showing that the stock is likely overbought.
Exponential Moving Average (EMA)
For the EMAs, the 9-day EMA has not had a crossover with the 21-day EMA for quite a long time. The 9-day EMA has been clearly on top in the past few months, indicating sustained bullishness in the stock. The gap between the EMAs is large currently, but the 9-day EMA’s trajectory has flattened as the stock now trades below it. This means that the gap between the EMAs is likely to contract, indicating receding bullishness as of late.
Bollinger Bands
For the Bollinger Bands, the stock has been riding up the upper band for virtually the entire month of November until the bearish engulfing pattern. The stock finally exited this overbought state and is now undergoing a pullback. The 20-day midline’s support is still very distant with it still below 20, meaning that a further decline in the stock in the near term is likely with support from the midline and other MAs, being distant.
Takeaway
As a whole, like in the chart analysis, I would be bearish in the near term but still long term bullish on Rocket Lab stock. In the near term there are enough signs of weakness in the EMAs for me to believe the outlook is net negative and as discussed above, with the stock breaking below the 9-day EMA, other sources of support are quite distant. For the long term, the SMAs and Bollinger Bands’ midline are likely to be strong support, and so the stock willy likely be fine in the longer time frame.
Indicators
Moving Average Convergence Divergence (MACD)
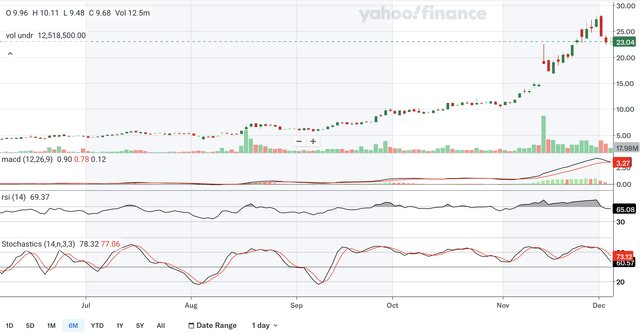
The MACD line is still above the signal line, but a bearish crossover seems imminent as the MACD’s trajectory is severely downward as demonstrated by the bearish histogram. On the brighter side, the MACD did confirm the recent surge in the stock as it too made one-year highs.
Relative Strength Index (RSI)
For the RSI, it is currently at 65.01 after dropping out of the overbought zone. The RSI is still significantly above the 50 level, showing that the bulls remain in clear control of the stock. Like the MACD, the RSI also confirms the recent surge in the stock, as it reached one-year highs recently as well.
Stochastics
For the stochastics, the %K line crossed below the %D line within the overbought 80 zone, a highly bearish signal. The gap between the lines is accelerating, indicating increasing bearish pressure. Another thing worth monitoring is how the stochastics interacts with the 50 level. It has been above the level since mid-September, showing that bullishness has been overall sustained. If the stochastics manages to bounce from this line in the near future, it would indicate that the longer-term uptrend is still intact.
Takeaway
From my analysis, the indicators show a similar outlook to the chart and moving averages as it too shows long term bullish signals but near term weakness. There are major signs of immediate weakness, such as the imminent MACD bearish crossover and the highly bearish stochastics signal. However, there are long term bullish signals as the MACD and RSI confirm the recent surge and the stochastics has held above 50 for an extended period.
Fundamentals
Earnings
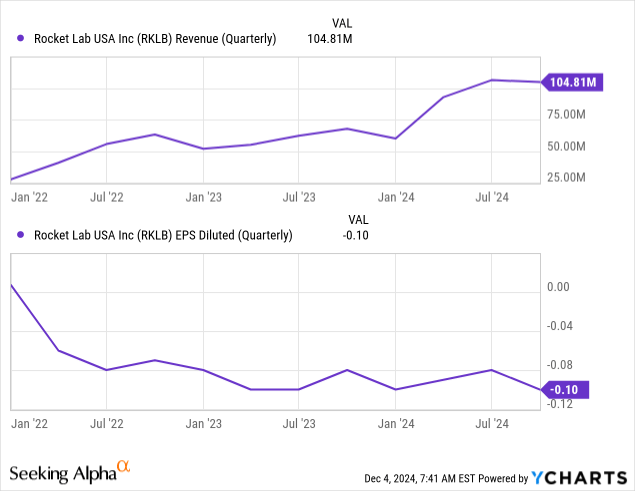
Rocket Lab showed satisfactory results in their most recent earnings report, released back in November. They reported that revenues were up 55% YoY to $104.808 million, while diluted GAAP EPS worsened YoY from -$0.08 to -$0.10. Both revenue and EPS slightly beat expectations, with revenue beating by $2.42 million and EPS beating $0.01. As you can see in the charts above, revenue growth has been quite strong this year. Revenues have been much stronger than back in 2023. For EPS, losses have widened slightly this quarter and there does not seem to be signs that breaking even is imminent. Losses will likely carry on into the current quarter, as they provided guidance of an adjusted EBITDA loss of between $27 million to $29 million for Q4.
The financials do not tell the full story, however, as there are significant developments that Rocket Lab should get credit for. That includes being selected by NASA for a Mars mission and breaking the record for the number of annual Electron launches this year. These developments are likely to translate into long-term growth for Rocket Lab, and so long-term investors should be confident in this company’s future despite mixed financial results currently.
Valuation
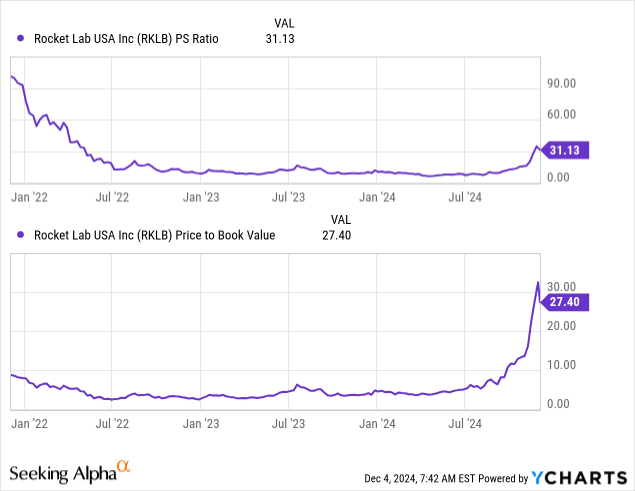
The P/S and P/B ratios have soared lately for Rocket Lab stock. The P/S ratio is currently at 31.13 after being below 10 earlier this year. For the P/B ratio, it is now at 27.4 after being below 5 also earlier this year. Both ratios are down slightly from their recent peak, however. I believe the surge in the P/S ratio is justified by the strong revenues. After very weak growth in 2023, the company’s revenues are getting back on the right track, and so it deserves a premium. The other developments discussed above also helps to justify this surge in the P/S ratio. For the P/B ratio, the surge does seem a bit overdramatic. To quintuple the ratio in a matter of months is extreme to say the least. While I agree Rocket Lab does deserve much credit for their significant achievements lately, with net losses still widening, I would argue that the P/B has gotten a bit ahead of itself. I would say that this ratio reflects overvaluation in the stock. After evaluating both valuation multiples, recent earnings, and latest developments for the company, I would conclude that the stock is moderately overvalued at current levels.
Conclusion
Recent developments, as discussed above, show that the future for Rocket Lab is bright. The technicals also agree. But in the near term, the stretched valuation may catch up to the stock. The technicals also agree, as my analysis indicates that the pullback may continue to play out in the coming months. With support levels being distant from current levels in the stock, EMAs showing signs of weakness, and indicators flashing bearish signals, investors may want to wait for a better entry point in this high potential business. Therefore, I would currently rate Rocket Lab as a hold until there are signs that the correction has run its course
Analyst’s Disclosure: I/we have no stock, option or similar derivative position in any of the companies mentioned, and no plans to initiate any such positions within the next 72 hours. I wrote this article myself, and it expresses my own opinions. I am not receiving compensation for it (other than from Seeking Alpha). I have no business relationship with any company whose stock is mentioned in this article.
Seeking Alpha’s Disclosure: Past performance is no guarantee of future results. No recommendation or advice is being given as to whether any investment is suitable for a particular investor. Any views or opinions expressed above may not reflect those of Seeking Alpha as a whole. Seeking Alpha is not a licensed securities dealer, broker or US investment adviser or investment bank. Our analysts are third party authors that include both professional investors and individual investors who may not be licensed or certified by any institute or regulatory body.

