
Summary:
- Thesis: Previous analysis indicated strong undervaluation, while current evaluation suggests a fair price with significant future potential.
- Overview: Norwegian Cruise Line exhibits resilience and growth potential, outperforming market trends in recent years.
- Financials: Q4 2023 earnings revealed mixed results, with positive improvements in revenue and margins, yet declining cash reserves and increased debt.
- Valuation: According to my DCF model, NCLH stock currently trades at a fair valuation. However, average analysts’ estimates suggest an even higher fair price.
- Risks and Conclusion: Despite potential dilution and market sentiment risks, NCLH remains an attractive investment opportunity, offering a combination of industry resilience and pricing power.
imagewerks
Thesis
In my previous article (released before Q3 2023 reported in November 1) about Norwegian Cruise Line Holdings Ltd. (NYSE:NCLH), I explained how Norwegian was still undervalued despite a 20% dilution, in which case the stock’s future price for 2028 would be $47.43 and if there was no dilution, the future price would be $56.92. These targets suggested annual returns in the range of 35-46%. For that reason, I rated the stock as a strong buy.
In this article, I will reevaluate NCLH based on the recent Q4 2023 earnings released in February 27. After the valuation, I arrived to a fair price of $18.30 and a future price of $55.24. However, what makes Norwegian a strong buy is that, when comparing my results with the average consensus, you can observe that the stock is offering a huge safety margin since the fair price indicated by the average consensus is $35.62.
Furthermore, if an 88% dilution was applied to the stock, half of total debt would disappear and the fair price would stand at $18.65, and future price at $35.62, which is a huge hit, however annual returns stand at a reasonable 17.8%.
Seeking Alpha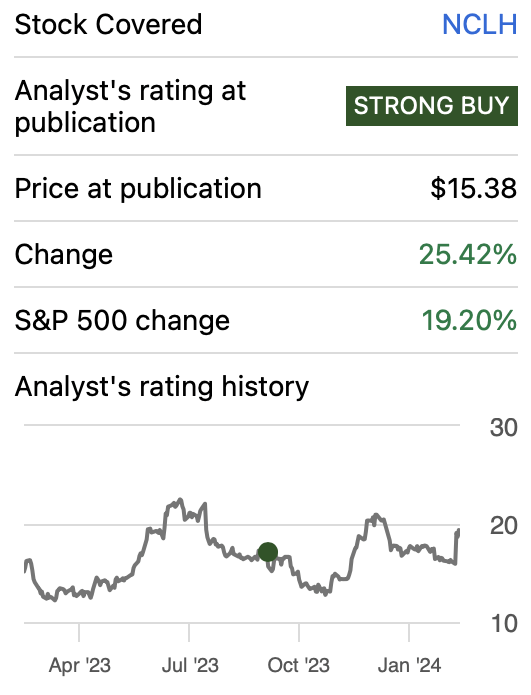
Overview
Norwegian is one of the big three cruise operators. Norwegian specializes on catering to wealthier clients, and this offers it more pricing power and more resilience during economic downturns.
Norwegian has outperformed the market in three out of four years. For 2020 its revenue slumped by 80.19% while the overall market revenue decreased by 87.77%. In 2021, the market recovered with force, but Norwegian’s revenue decreased. Nevertheless, in 2022, Norwegian’s revenue grew by 647.5% which compensates the results for 2021. Lastly, for 2023, Norwegian outperformed the market by 35.97%.
| Company’s Revenue Growth | Market Revenue | Difference | |
| 2020 | -80.19% | -87.77% | 7.58% |
| 2021 | -49.37% | 305.95% | -355.32% |
| 2022 | 647.50% | 31.16% | 616.34% |
| 2023 | 76.49% | 40.53% | 35.97% |
| 148.61% | 72.47% | 76.14% |
Since the release of my previous article, Norwegian has added three ships to its fleet: 1 Norwegian Prima, 1 Explorer, and 1 Allura. With these additions, the total amount of lower berths has increased from 62,000 to 66,500 as of FY 2023. It remains the delivery of four Prima class for 2025-2028, and one Allura class that will be delivered in 2025.
NCLH 10-K 2023
Furthermore, the revenue of the worldwide cruise market is expected to grow at a CAGR of 4.35% throughout 2028. This is a reasonable growth rate, which is a great complement to the enormous growth that cruise operators can get when they expand their fleet.
Statista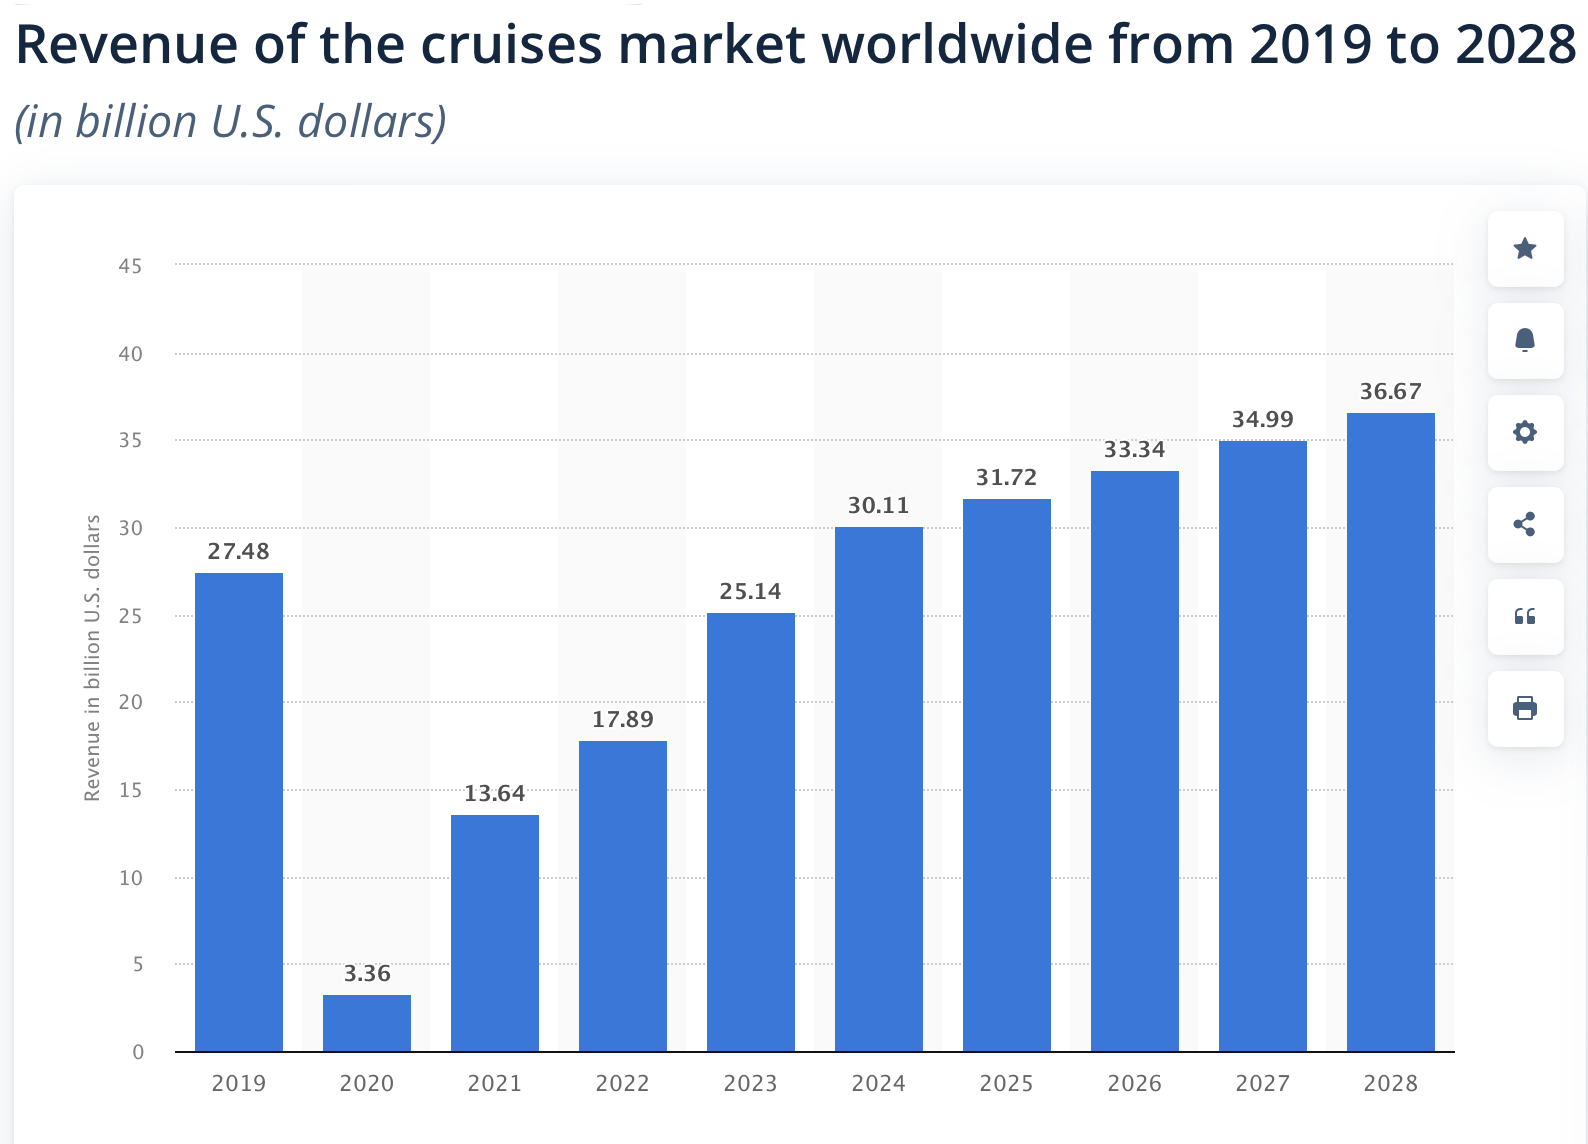
Financials
NCLH released Q4 2023 earnings in February 27. The company reported an EPS of -$0.18 which missed consensus by $0.04 ($17 million when multiplied by total shares outstanding). However, it reported revenues of $1.9 billion, which beat average consensus.
However, what moved the stock higher was that NCLH increased its outlook for FY2024. The company said that they expect FY2024 EPS to be around $1.23.
Since my previous article, released before Q3 2023, all metrics in the income statement have improved exceptionally. For instance, revenue has increased by 7.3%, operating income has turned positive and now stands at $920.9 million, much better than the previous -$18.3 million. A similar move has been witnessed in net income, which passed from -$851 million to $166.2 million.
These huge improvements are also visible in the margins, whereas operating margin has passed from -73.90% to 10.77%, and net income margin increased from -11.88% to 1.94%.
Author’s Calculations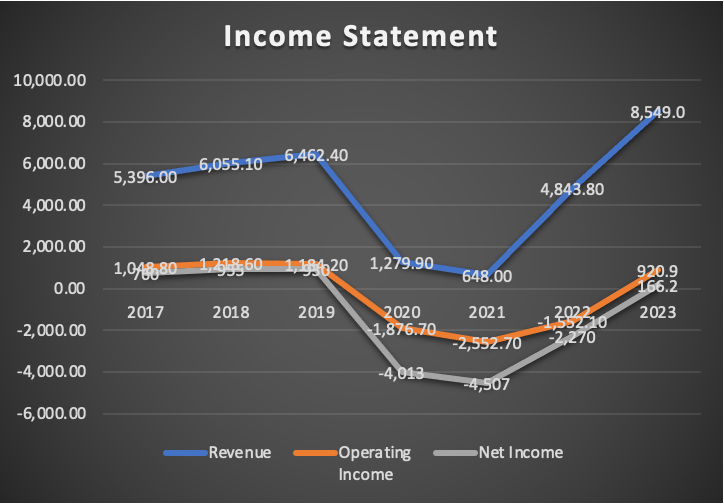
Author’s Calculations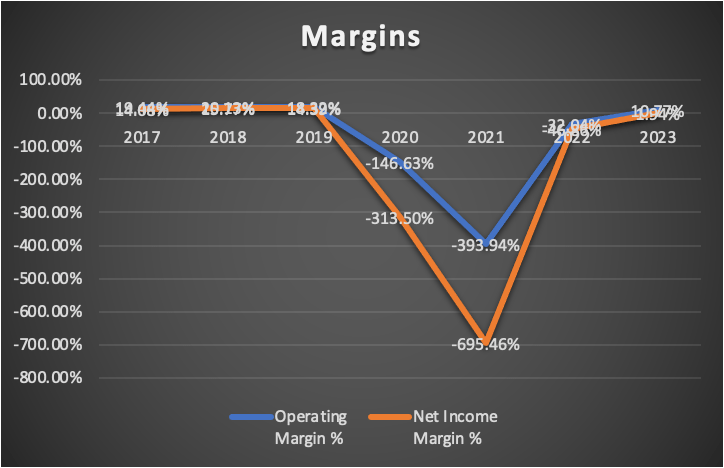
In what concerns financial condition, cash reserves have halved and now stand at $402.4 million, way lower than the previous $899.1 million in Q3 2024. Short-term debt increased from $1.12 billion to $1.74 billion and long-term debt passed from $11.9 billion to $12.31 billion,
Author’s Calculations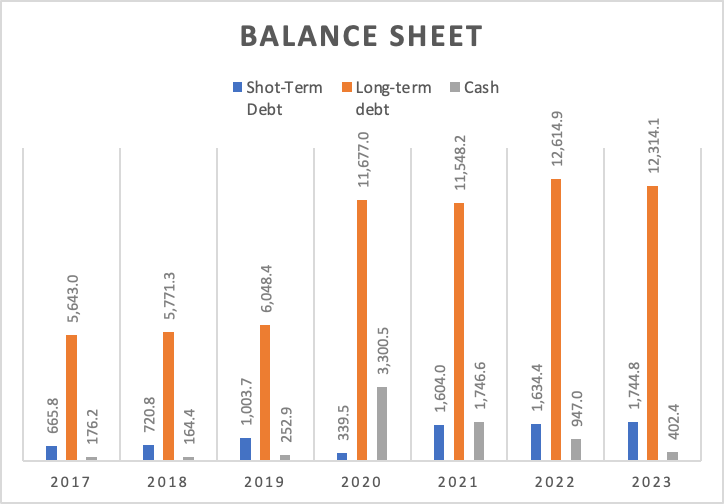
Finally, free cash flow decreased from $114 million to -$23 million. This was due to an increase in CapEx which increased from $2.4 billion to $2.7 billion, a $300 million increase that was greater than the $150 million increase in cash from operations.
Author’s Calculations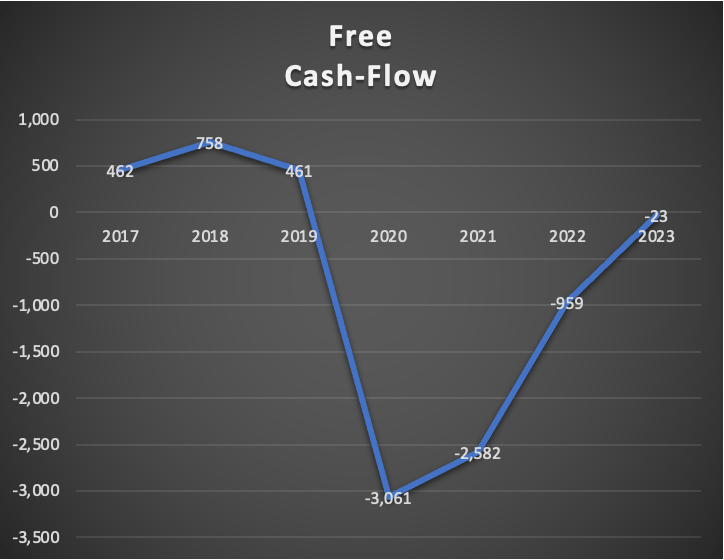
Author’s Calculations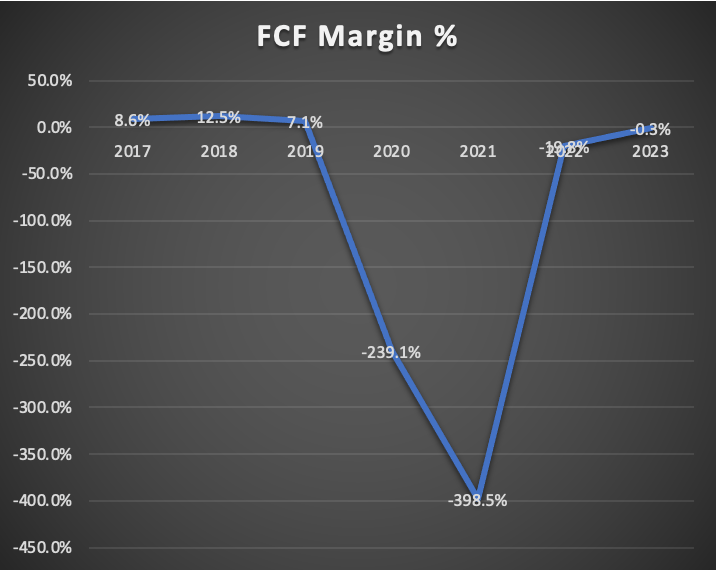
Author’s Calculations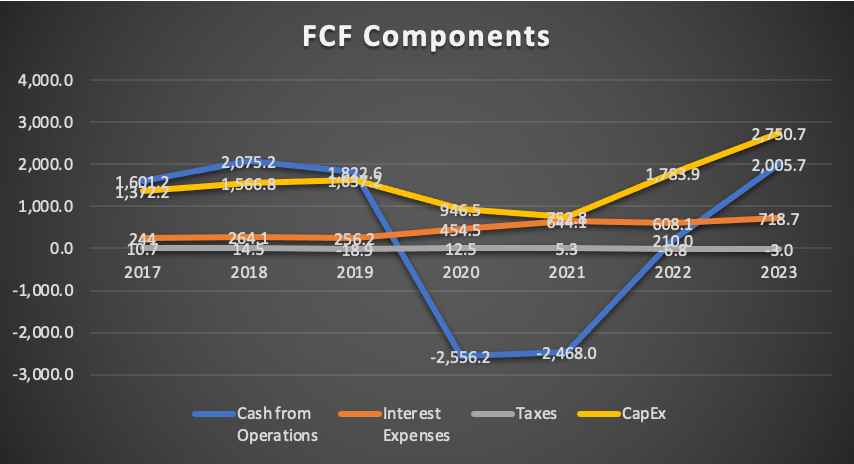
Valuation
The valuation method that I will use for NCLH is a DCF. In the table below, you can find all the necessary financial information that is needed to calculate the WACC. In this case, the WACC came out at 9.20% after using the already known formula.
Furthermore, the model will suggest which could be the stock price for 2029. This will be done by calculating the equity value in 2029. For this, I will be using the undiscounted cash flows and then assuming that long-term debt will grow at the pace displayed in 2021-2023 of 1.1%, short-term debt by 1.5% annually, and current assets by 19.96%. This last one is the average rate registered in 2019-2023. Lastly, marketable securities will remain at 0 because that has been the trend throughout 2014-2023.
Lastly, interest expenses will grow at a pace of 1.1% per year, since that’s the pace at which total debt has grown in 2021-2023. D&A will be calculated with a margin tied to revenue, in this case is 10.33%, which corresponds to FY2023.
| TABLE OF ASSUMPTIONS | |
| (Current data) | |
| Assumptions Part 1 | |
| Equity Market Price | 8,120.00 |
| Debt Value | 14,058.90 |
| Cost of Debt | 5.11% |
| Tax Rate | -0.15% |
| 10y Treasury | 4.284% |
| Beta | 1.99 |
| Market Return | 10.50% |
| Cost of Equity | 16.65% |
| Assumptions Part 2 | |
| CapEx | 2,750.70 |
| Capex Margin | 32.18% |
| Net Income | 166.20 |
| Interest | 718.70 |
| Tax | -3.00 |
| D&A | 883.20 |
| Ebitda | 1,765.10 |
| D&A Margin | 10.33% |
| Interest Expense Margin | 8.41% |
| Revenue | 8,549.0 |
The first step to calculate revenue is predicting how much they will grow after the addition of Norwegian’s new ships. As previously said in the overview section, Norwegian is expecting 4 Prima Ships (which on average have 3,700 lower berths) to be delivered in 2025-2028, and 1 Allura ship which has 1,250 lower berths and will be delivered in 2025.
I will assume that Norwegian will receive 1 Prima ship per year. For 2025 there will be two deliveries, one Prima and one Allura. Then, I will multiply the number of lower berths by the average lower berth quarterly revenue registered in FY2023, which is of $32,129.09. Finally, I will just multiply the results by 4 and get the full-year result.
| Lower Berths Projections | Revenue projections | Full Year | |
| Q1 2024 | 66,500 | 2,137.44 | |
| Q2 2024 | 66,500 | 2,137.44 | |
| Q3 2024 | 66,500 | 2,137.44 | |
| Q4 2024 | 70,200 | 2,256.37 | 8,668.70 |
| Q1 2025 | 71,450 | 2,296.55 | |
| Q2 2025 | 71,450 | 2,296.55 | |
| Q3 2025 | 71,450 | 2,296.55 | |
| Q4 2025 | 75,150 | 2,415.47 | 9,305.11 |
| Q1 2026 | 75,150 | 2,415.47 | |
| Q2 2026 | 75,150 | 2,415.47 | |
| Q3 2026 | 75,150 | 2,415.47 | |
| Q4 2026 | 75,150 | 2,415.47 | 9,661.89 |
| Q1 2027 | 78,850 | 2,534.40 | |
| Q2 2027 | 78,850 | 2,534.40 | |
| Q3 2027 | 78,850 | 2,534.40 | |
| Q4 2027 | 82,500 | 2,651.72 | 10,254.91 |
| Q1 2028 | 82,500 | 2,651.72 | |
| Q2 2028 | 82,500 | 2,651.72 | |
| Q3 2028 | 82,500 | 2,651.72 | |
| Q4 2028 | 82,500 | 2,651.72 | 10,606.86 |
The next step is calculating net income. For this, I will assume that for 2024 and 2025 the net income margins will be of around 6.04% and 7.77% respectively. These margins are the ones that would be derived from average estimates. Then for 2026 I will assume a net income margin of 14.08%, 14.39% for 2027, 15.77% for 2028, 15.77% for 2029. As you can see, I am projecting a recovery in Norwegian’s net income margin until it arrives to the one registered in 2018 of 15.77%.
| Revenue | Net Income | Plus Taxes | Plus D&A | Plus Interest | |
| 2024 | $8,668.7 | $523.59 | $524.37 | $1,419.94 | $2,146.90 |
| 2025 | $9,305.1 | $723.01 | $724.09 | $1,619.66 | $2,354.97 |
| 2026 | $9,661.9 | $1,360.39 | $1,362.43 | $2,360.61 | $3,104.37 |
| 2027 | $10,254.9 | $1,475.68 | $1,477.89 | $2,537.33 | $3,289.64 |
| 2028 | $10,606.9 | $1,672.70 | $1,675.21 | $2,771.01 | $3,531.96 |
| 2029 | $10,606.9 | $1,672.71 | $1,675.22 | $2,771.02 | $3,540.71 |
| ^Final EBITA^ |
Before going to the results, you can observe that I am expecting that for FY2024, Norwegian will register a positive cash-flow of $173.38 million, however for 2025 and 2026 I am suggesting it will return to negative territory. The reason for this is CapEx. According to Norwegian’s 10-K, you will observe that it’s estimated that the 5 ships in order will cost around $6.4 billion, which divided by 5 means $1.28 billion. The average CapEx registered by Norwegian in 2018-2023 was $1.54 billion, for year 2025-2028, when it’s expected that these 5 ships will be integrated to the fleet, CapEx will increase from $1.54 billion to $2.84 billion.
Author’s Calculations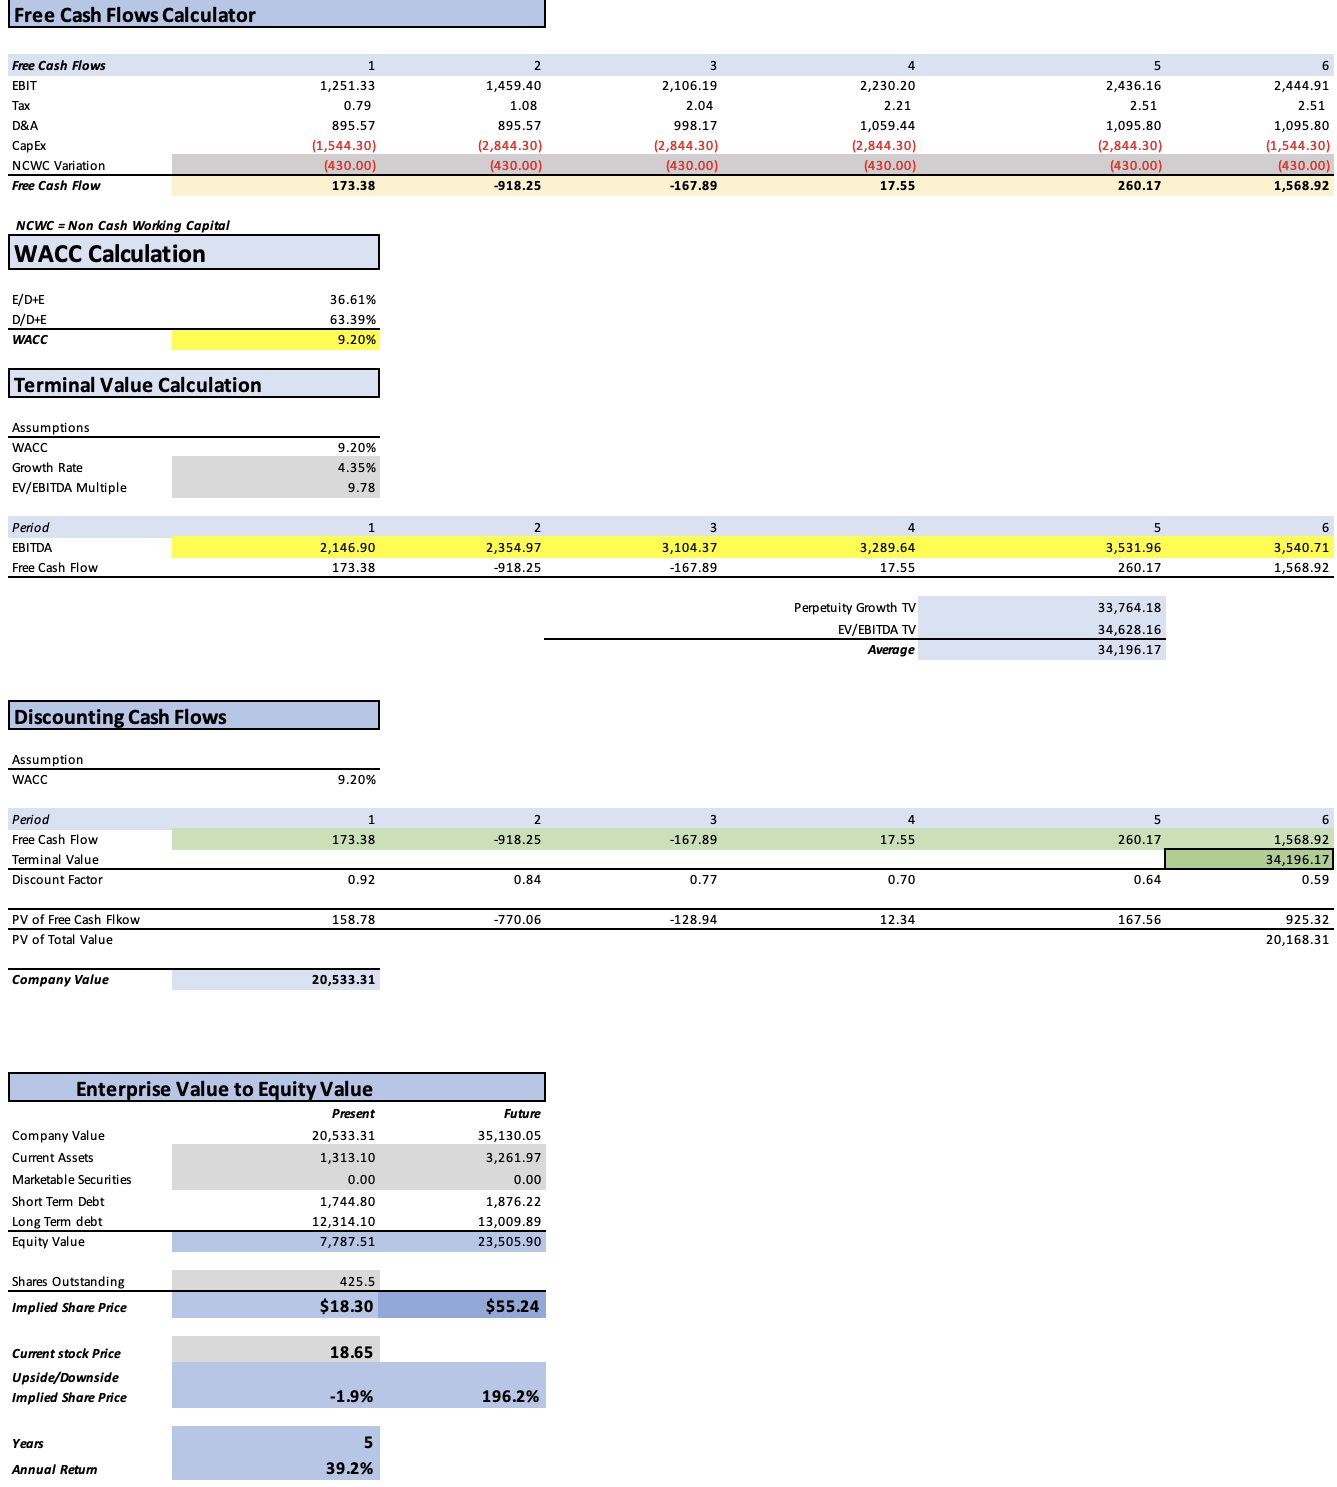
The result is a fair price of $18.30, which indicates that the stock is currently trading to fair valuation. However, the future price of 2029 stands at $55.24, which translates into annual returns of 32.7% throughout 2029.
How does my model compare with the average consensus?
The average consensus estimates an EPS of $1.23 for 2024 and $1.70 for 2025, which are the same as my model suggests. Meanwhile, for 2025 and 2027 my estimates are higher than the consensus, more specifically 32.2% and 14.9% higher. For 2028. Lastly, for 2029, my estimates are 18.63% lower than the average consensus.
Author’s Calculations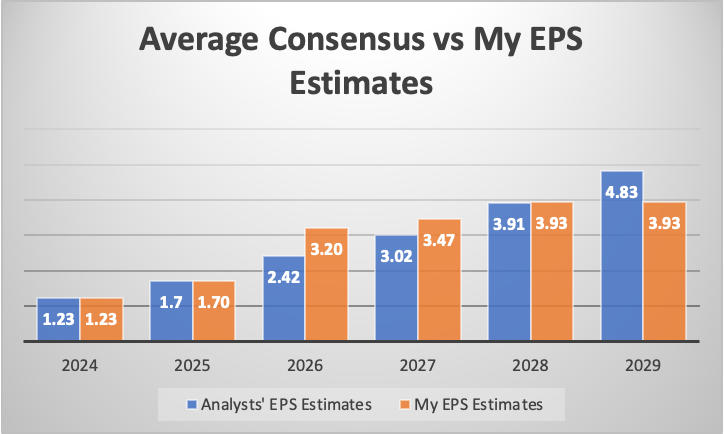
Finally, If I were to make a model entirely from the available average estimates, the fair price would come out at $35.62 which is 91% higher than the current stock price of $18.65. The future price would come out at $84.54 which suggests 70.7% annual returns throughout 2029.
With this last thing in mind, you can notice that my estimates are very conservative, however if the company goes the way as the average consensus is suggesting, the fair price could be higher. Therefore, knowing that the stock is around fair valuation, and that if things play out better than what I am expecting, the stock offers a good risk-reward situation.
Risks
I have already demonstrated several times in my articles about Carnival Corporation & plc. (CCL) and in my previous article about Norwegian that dilution would not affect that much the potential annual returns both stock could offer. In the case of Norwegian, if I apply an 88% dilution, enough to cover 50% of the debt, the fair price would stand at $18.65, future price would come out at $38.62 which still implies annual returns around 17.8%. This happened because after the dilution 50% of the debt disappeared, which helps to increase equity value.
Author’s Calculations
Furthermore, the cruise industry has demonstrated resilience during past economic downturns, even in 2008. The only reason why all cruise stock collapsed in 2020 was because the quarantine forced everyone to remain in their home. Additionally, it’s worth noting that the average salary of cruise-goers was $114K in 2014, which is double the GDP per capita of the US at that time, $55K. If this logic continues to this day, that means that the average cruise-goer salary is around $160K, double the GDP per capita of $80K registered in 2023.
Statista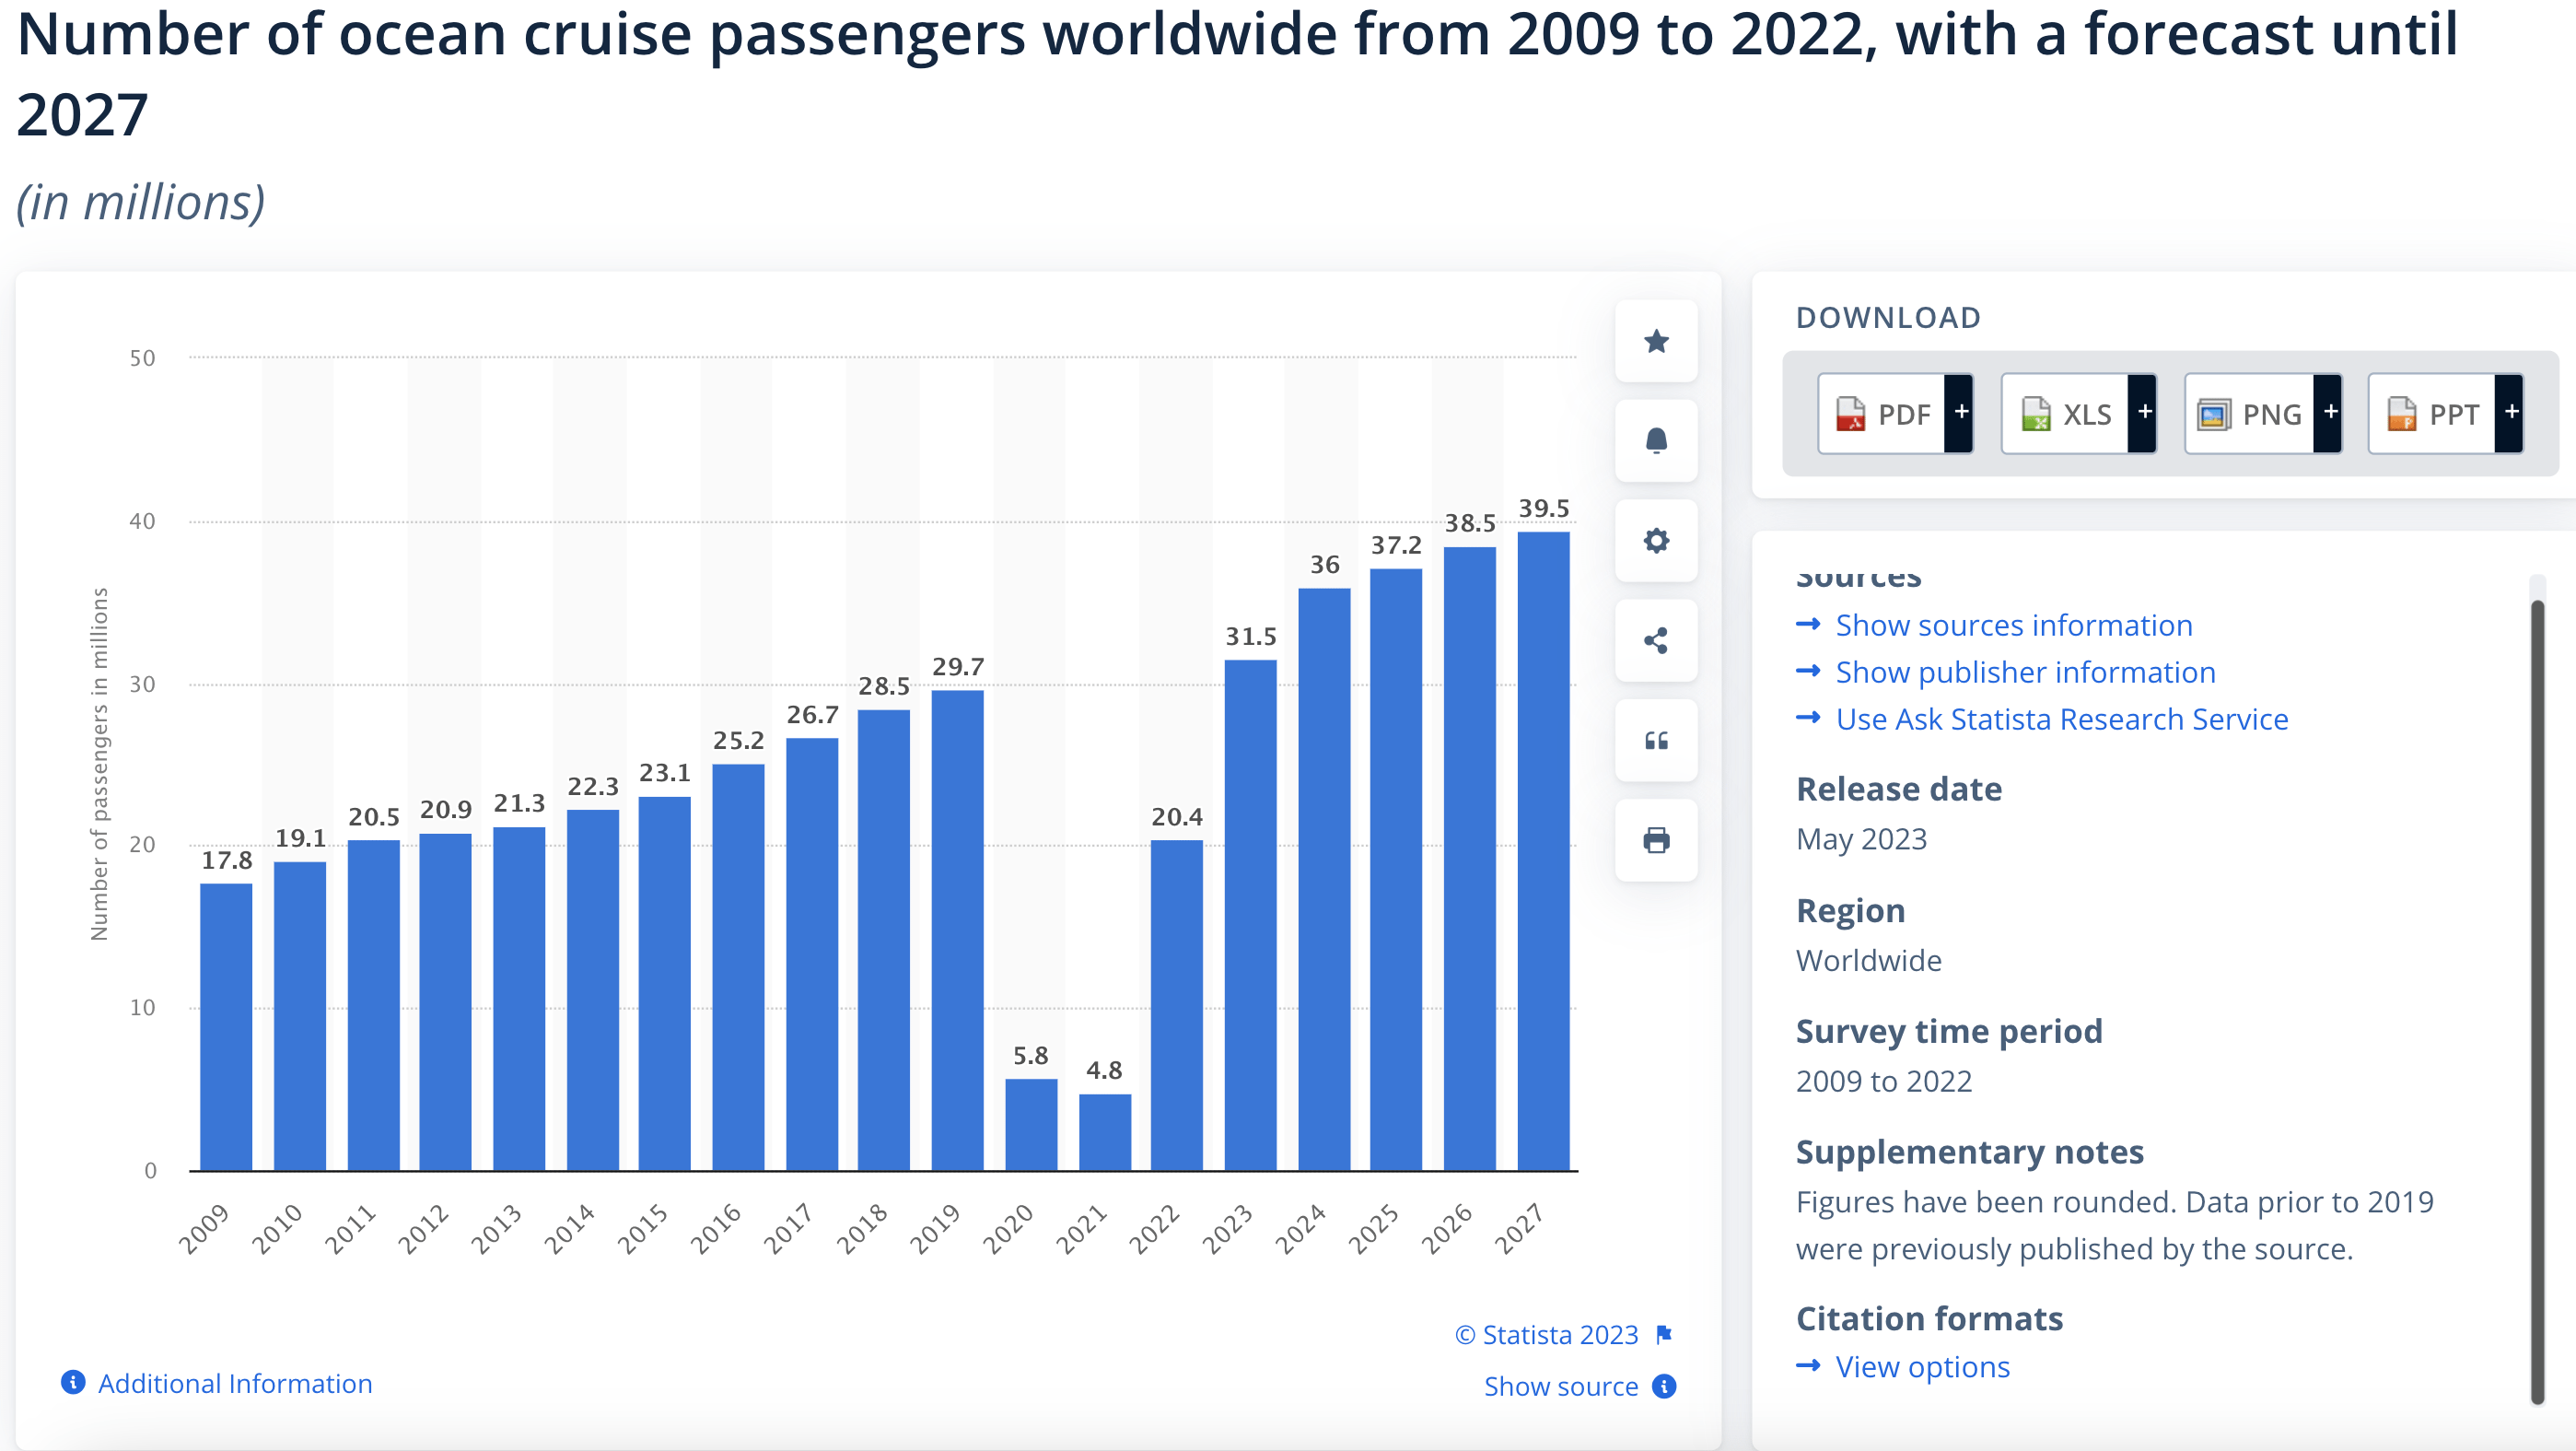
I consider that the only risk here is sentiment, since Norwegian is not a company in the best financial condition, so any lowered forecast could trigger a stock selloff.
Conclusion
NCLH stock continues to offer a compelling investment opportunity, coupled with the resilience of the cruising industry and Norwegian’s pricing power. After evaluating how Norwegian will look like after the addition of the 5 ships it’s planning to receive in 2025-2028, I have reached to a fair price of $18.30 and a future price of $55.24.
If we compare this with the average consensus, we will observe that Norwegian’s Current fair valuation (according to my model) offers a great safety margin to see if the company can accomplish the average consensus and thereby having a fair price of $35.62 and a future price of $84.54.
Finally, if the stock was diluted by 88%, half of the debt could be paid. This causes that the fair price stands at $18.49 and the future price at $38.62. This last price indicates reasonable 17.8% annual returns throughout 2029. For these reasons I reiterate my strong buy rating on NCLH.
Analyst’s Disclosure: I/we have no stock, option or similar derivative position in any of the companies mentioned, but may initiate a beneficial Long position through a purchase of the stock, or the purchase of call options or similar derivatives in NCLH over the next 72 hours. I wrote this article myself, and it expresses my own opinions. I am not receiving compensation for it (other than from Seeking Alpha). I have no business relationship with any company whose stock is mentioned in this article.
Seeking Alpha’s Disclosure: Past performance is no guarantee of future results. No recommendation or advice is being given as to whether any investment is suitable for a particular investor. Any views or opinions expressed above may not reflect those of Seeking Alpha as a whole. Seeking Alpha is not a licensed securities dealer, broker or US investment adviser or investment bank. Our analysts are third party authors that include both professional investors and individual investors who may not be licensed or certified by any institute or regulatory body.