Summary:
- The NVDY ETF offers high income by sacrificing NVDA’s upside potential, and has achieved impressive returns since its inception.
- The pattern of monthly NVDA returns has been especially accommodating for NVDY’s structure, but I don’t expect that to continue.
- Nvidia Corp itself remains a reasonable portfolio holding for patient long-term investors.
- I expect high implied volatility to finally result in substantial two-way price swings for NVDA, especially as Trump trade policy developments unfold in real time.
- NVDA price volatility seems destined to downgrade NVDY’s efficiency. Investors interested in covered call action on NVDA should consider implementing their own trade structure.
Nedrofly/iStock via Getty Images
As the topic of conversation, on a recent night out, transitioned to investment markets, a former colleague of mine asked me about the YieldMax NVDA Option Strategy ETF (NYSEARCA:NVDY). My friend was raving about the returns they were earning from this fund, and curiously I was unfamiliar with it. I decided to have a look. For the uninitiated, NVDY is constructed as a derivative of Nvidia (NASDAQ:NVDA) stock by engaging in stock options.
For background, as I’ve gotten older and begun to pay more attention to income generating investments, I’ve been drawn in by option strategies, especially covered call strategies on securities that I’ve viewed as maxed out. For those new to my work, I recommend taking a peak at my prior articles on the Global X NASDAQ Covered Call ETF (QYLD), which I not only recommend holding, but propose combining with a Short Nasdaq-100 Futures position to earn a potential 15% yield. My follow-up article on QYLD reiterated the combination trade even at a reduced contango. Meanwhile, I’ve earned some income from selling puts on Intel (INTC) in the past few months.
I’m not a novice in the world of derivatives, and today I wanted to review 70%+ yielding NVDY for the benefit of Seeking Alpha readers, while at the same time presenting useful considerations for NVDA common stock holders.
Implied Vol & No Free Lunch
As I tried, and succeeded, in remembering her name right now, I’ve sadly discovered that my favorite finance professor at UofM (Manitoba) Dr. Usha Mittoo passed away in 2019. Dr. Mittoo was famous for her good humour, and constantly impressing upon students that, in finance, “there is no free lunch”. Anything that seems like a free lunch always has an offset cost.
For covered call strategies, the investor is trading away potential capital upside for income. The more upside traded away, the higher income that can be earned. Risk mitigation (~insurance) also comes at a cost – no reasonable participant is going to inherit your risk without remuneration.
If one trades away both their upside potential and downside risk, they should theoretically earn approximately the risk-free on whatever net capital is, less transaction/management costs.
For investors trading away EITHER upside potential or downside risk, but not both, implied volatility is the key variable that determines the proceeds or cost of your options action.
QYLD
Let’s look at QYLD and implied volatility on the Nasdaq 100, represented by the Invesco QQQ Trust (QQQ). I took the following snapshot midday on November 15 when the QQQ was trading at about $496.
The above option quote is for December 13 expiry (~4 weeks from now), and carries a price of (midpoint) $11.19. That represents about 2.25% of the capital level (11.19/496). Rolling this every month would mean the investor is eligible to earn about 29.25% over a 1-year timeframe from selling away ~100% of the potential upside of their QQQ holding (while maintaining downside risk exposure). This 29.25% rate assumes that volatility remains at current levels throughout that year.
This is essentially what QYLD does; it sells monthly calls at (or just above) market prices. When the ETF writes call options slightly above market, this will lower the income yield (as compared to writing ATM). Let’s ballpark the leakage at 1.15% (it might be more), and remember that QYLD charges a management fee of 0.6%. This brings the estimated annual yield to 27.5%. That means investors can be paid ~27.5% to assume all downside risk of the Nasdaq-100 downside for a year (with essentially no upside potential). QYLD then pays ~50% of this income to unitholders via distributions, and keeps the remaining 50% within the ETF. Regardless of the distribution rate, unitowners of QYLD are getting compensated an annualized rate of ~27.5% using a one-month call writing strategy.
Understanding this, let’s now have a look at NVDY.
NVDY (Standard Strategy)
The management team of NVDY (Yieldmax ETFs) distinguishes between what they call “Standard Strategy” and “Opportunistic Strategy”. The Standard Strategy almost (but not quite) reflects a standard covered call strategy. One peculiarity is that instead of owning the underlying security – in this case NVIDIA Corp (NVDA) – outright, the ETF gains this exposure via a synthetic means.
A synthetic long position entails buying ATM (at-the-money) call options, while selling/writing ATM put options. Given the leverage characteristics of options, a synthetic position can be achieved without utilizing a capital amount equal to the notional exposure. Said another way, an investment pool of $1 million might be able to reach $1 million of exposure to NVDA (or another underlying security/index) while only locking-up, for example 5%-10% of their capital in options positions. They can then invest the remainder (90%-95%) in Treasury securities.
So the NVDY portfolio buys ~ATM call options on NVDA, and then sells/writes ~ATM put options on NVDA, to achieve exposure to NVDA stock. The managers then go on to sell NVDA call options either ATM or up to 15% above the current market price. Attentive readers will recognize that if NVDY sold ATM calls, they’d essentially be selling the same exposure they bought through the purchase of ATM calls as part of the synthetic long position.
As of today, November 15 (midday) here’s what NVDA’s ATM, and ~15% above market, 4-week options look like this:
Readers can see that the implied volatility of NVDA stock is around 60%, 3x higher than the Nasdaq 100 (as represented by QQQ) as a whole. This lends to all sorts of interesting derivatives plays on NVDA, some of them quite lucrative at face value.
Based on the above Dec 13, 2024 NVDA option quotes, the entirety of NVDY’s “Standard Strategy” can be summed up as complete NVDA stock downside exposure, coupled with:
- ~90% annualized income rate ($9.70 x 13 / $140) by sacrificing 100% of upside
- ~28% annualized income rate ($3.00 x 13 / $140) by sacrificing upside exceeding 15% monthly,
- OR anywhere in between
These are hefty income returns, as driven by NVDA’s ~60% current 1-month implied volatility.
In dollar terms, an investor owning 1 lot (100 shares) of NVDA with a current value of ~$14,000 could opt to receive ~$970 in monthly income by foregoing their upside potential through writing an ATM call. Or, the investor could opt to receive ~$300 in monthly income by only forfeiting upside higher than 15% per month (15% is currently worth $2,100 on 100 shares). In this latter option, the investor could earn as much as a total monthly return of $2,400. These are the north and south frontiers of NVDY’s Standard Strategy for covered calls.
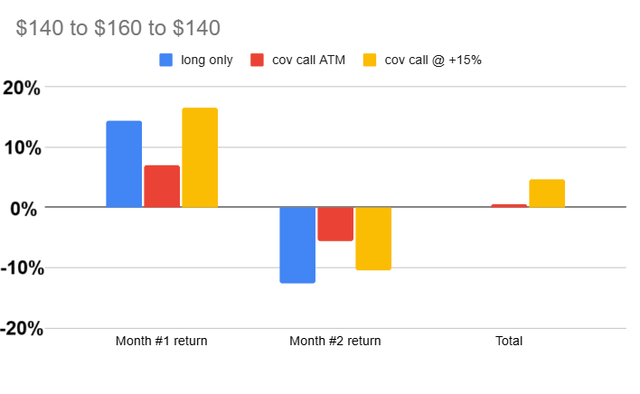
The wildcard, of course, is the downside risk, and it’s absolutely critical for investors to recognize that NVDY does NOT represent a cumulative risk setup, given that the NVDY ETF uses monthly (at max) options. Said another way, if shares of NVDA rise from $140 to $160 in the next month, but fall back to $140 the following month, here are what the i) a simple NVDA long position, ii) ATM covered calls, and iii) +15% covered calls, would be set to deliver.
The key takeaway from the above chart is that the strategy where covered calls are written 15% above market outperforms the ATM covered calls, in this oscillating scenario. That’s due to the capital gains (stock price gains) it earns in the up month that the ATM covered call strategy does not.
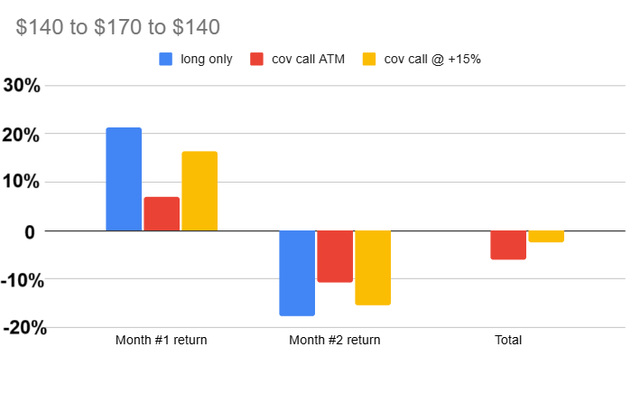
Constructing a scenario where NVDA stock rises from $140 to $170 in the first month, and then returns to $140, exemplifies this point.
In this scenario, even though NVDA stock is flat over a 2 month period, both covered call strategies take losses, but the ATM strategy suffers a bigger net loss of about 6%. Why? Because in the second month this strategy incurs a $3,000 capital loss ($170 to $140 with 100 shares), but never earned any capital gain in the first month. The ATM strategy has earned only $970 of option premium income in month #1 and $1,178 in month #2 (option premium income resets higher at the start of month #2 due to the higher beginning stock price of the underlying).
Oscillating monthly performance is exactly what NVDY owners would like to avoid, and they’ve generally been getting their wish.
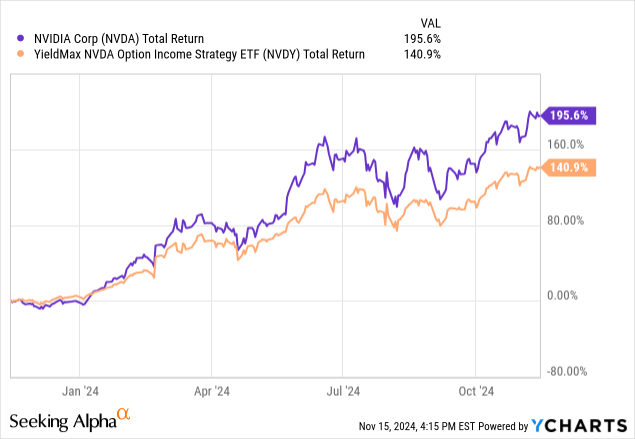
NVDY has delivered an impressive ~141% one-year total return, and a ~225% 18-month total return (NVDY launched in May 2023), and the 3rd chart below helps to explain why.
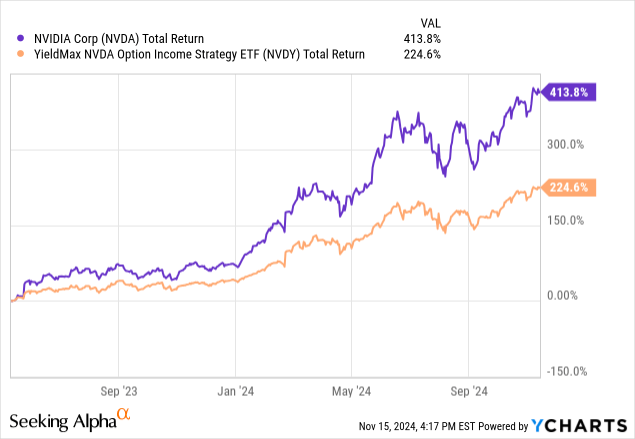
Here’s where the rubber meets the road:
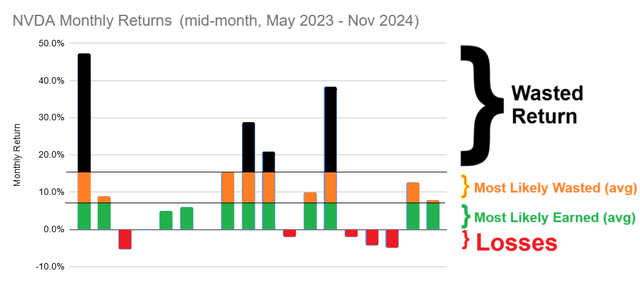
As illustrated above, based on mid-month pricing dates, NVDA shares have seen precious little in the way of monthly drawdowns. Only 5 of the past 18 months have seen NVDA declines, the biggest of which was about 5%. So while NVDA shares have carried (and still carry) high implied volatility, most of the realized volatility has been strictly to the upside when it comes to monthly blocks. This point is not only important for NVDY investors, but also for NVDA shareholders in establishing the possible makeup of NVDA investors. Nvidia has been the stock story of the past 2 years, yet weak hands have never been significantly tested. In my view that makes NVDA shares prone to panic selling at some point when weak hands are tested.
Returning to NVDY, it’s important for investors to realize that downside months are costly, not only due to the drawdowns, but the fact that subsequent covered calls will (likely) be written at a lower level for the thereafter month.
Some of NVDA’s upside volatility has represented waste to NVDY. That’s because, at best, monthly capital returns are no more than +15% (for Standard Strategy). So for the month from mid-May 2024 to mid-June 2024, where NVDA stock rose more than 38%, at best NVDY profited by +15% plus a small earned premium on substantially OTM (out-of-the-money) written call.
But while there’s been some excess return waste, for the most part NVDY’s portfolio has emerged from a 18-month walk through the forest holding flowers. Under an assumption (not at all intended to be accurate) that NVDY’s Standard Strategy of covered call writing has been done so at 7.5% above market (halfway between ATM and 15% OTM), then in 9 of the past 18 months NVDY’s portfolio has emerged with the maximum possible return. (Again, it’s important to remember that the above is based on my assumptive modeling. I haven’t looked at each month of covered call writing, nor the specific dates of the rollovers. The purpose of this exercise is not to achieve full attribution of past returns, but to develop an understanding of potential future return scenarios for NVDY.)
NVDY (Opportunistic Strategy)
The Yieldmax NVDA Option Income Strategy ETF also conducts an optional overlay Credit Call Spread strategy, atop the covered call writing.
NVDY Credit Call Spread writing involves a further sale of call options on NVDA (beyond what’s covered by the synthetic long position), accompanied by the purchase of an equivalent number of call options at a higher exercise price. The higher exercise price calls will carry a lower premium than the lower-exercise calls that are sold/written, resulting in a net credit to the ETF. The fund purchases those higher price calls to prevent blowout losses should NVDA shares suddenly go parabolic.
I’m not going to spend much focus on NVDY’s Opportunistic Credit Call efforts for 2 reasons:
- I have little confidence that any investor, including NVDY management, can consistently predict NVDA performance on a month to month basis. Yes, there are short-term technicals worth watching, but I’m skeptical about consistent gains on this basis for a stock whose fundamental story remains very fluid and dynamic.
- More importantly, my modeling struggles to find a scenario where the Standard Strategy (covered calls between ATM or OTM-by-15%) wouldn’t have accounted for essentially all of NVDY’s 225% 18-month return. It seems quite likely that NVDY’s Opportunistic Strategy has eroded the value of the Standard Strategy, though I am not guaranteeing that this has been the case. At a minimum, those Opportunistic Strategy returns look to be small.
Forward Outlook And Recommendation
There are a few key findings here for NVDA shareholders, with additional considerations for those playing the high yield game with NVDY.
For both, it’s important to recognize that although NVDA options have been subject to a very high implied volatility, most of the realized volatility has occurred just on the upside. NVDA stock drawdowns have been short-lived and generally modest.
MarketChameleon.com reports that NVDA’s current implied volatility of ~59.5% matches what I concluded above from looking at the stock’s option quotes. Meanwhile, IV has averaged nearly 50 for the past year!
MarketChameleon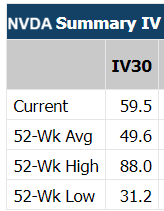
I believe that a period for greater oscillation of NVDA’s share price is upcoming, and yes, that means two-way swings.
I expect a great deal of upcoming NVDA investor trepidation regarding additional international trade tensions under the incoming Trump administration. Export restrictions are already an ongoing issue, especially to China, and in fact NVIDIA’s most recent 10-K mentioned the term “export control” 33 times. China, India and Vietnam are among NVIDIA’s biggest export markets.
Then there’s the import side, and concerns about tariffs. NVIDIA employs Taiwan Semiconductor’s (TSM) foundries for manufacturing. I’m reasonably confident that the Trump administration will find a workable solution for America’s biggest company, but it’s unlikely to come without a great deal of posturing and headfakes. That seems certain to drive a lot of stock price swings. Those swings could challenge weak NVDA shareholders who haven’t really had to face adversity. I only count 2 sessions in the past year where NVDA stock declined more than 7%.
In the longer-term, despite overwhelmingly being a contrarian and value investor, I wouldn’t bet against further gains for NVDA stock even at ~50x forward earnings and ~30x sales. I’m famously short shares of Apple (AAPL), mostly using low-vol put options (Apple stock’s implied volatility is essentially the same as the diversified Nasdaq-100 as a whole). Apple’s future growth story is challenging to construct, which is not at all true of NVIDIA. The market’s impatience with the Blackwell GPU delays will soon be forgotten. Late adopters of AI technology will expand the end-market base. There will be spurts of tremendous investor excitement ahead as reports about Blackwell adoption lead to shifts in analyst estimates.
However, those spurts of excitement will add to drawdown risk, especially as Blackwell headlines appear across from trade policy headlines. I’m reasonably confident that the days of straight and steady ascension are mostly in NVDA’s past. If I’m correct, that will pose a challenge long-time weak holders of NVDA shares, and be especially harmful to NVDY, whose units have limited benefit to sharp upside movements in the underlying stock, but full exposure to downside.
Pockets of NVDY investors who view the ETF as underperforming due to its lower returns than NVDA may benefit from a reality check. They may not recognize how vital the pattern of returns is when dealing with derivatives that need to be rolled over, and the more frequent the rollover, the greater importance the pattern is.
NVDY has been operating in, not a flawless, but a very amenable NVDA return environment. While there’s been some waste at the top (when NVDA monthly returns surpass the covered call exercise prices), there’s been precious little drawdown, and many months (potentially 50% of them) where NVDY’s positions have delivered a maximum possible return. That’s a high efficiency given an underlying security with such high implied volatility.
If one measures NVDY efficiency based on it’s ratio of returns relative to NVDA, then it’s delivered efficiency of 72% over the past year and 54% over a 18-month period. Without suggesting parity (in terms of the security itself, or how the fund is managed), the Yieldmax COIN Option Income Strategy ETF (CONY) has had a equivalent efficiency of just 46% relative to Coinbase stock (COIN) over the past year. Coinbase looks like the best high-flying comparison underlying security that has a corresponding Yieldmax ETF.
The possibility that NVDA continues to post significant gains over the next 12-18 months, alongside mediocre (or worse) returns for NVDY is very real. That’s doubly the case if you believe that most of the so-called easy money has already been made on Nvidia, and that we’ll see move up-and-down volatility.
For these reasons, I believe that owners of NVDA stock should be prepared for psychological tests from sharp pullbacks, even if said pullbacks come after NVDA rises further than it stands today. Confident investors should be prepared from some weak shareholders to fold.
For owners of NVDY, my recommendation is to look past the hefty historical returns you’ve been achieving, and closely assess what your true exposure is. There’s nothing wrong with sustaining a covered call strategy on NVDA, but I’d recommend the 3-month of 6-month option terms, reducing your susceptibility to short-term price swings. That would mean doing it yourself as opposed to depending on NVDY, and also lower expected annualized yields (currently 46% for 3-month and 31% for 6-month). That may seem like a hefty downgrade in yield, but would protect you from cementing losses due to short-term sentiment shifts.
Overall, I hold a Neutral rating for NVDA shares, and a Sell rating for the NVDY ETF. Owners of the Direxion Daily NVDA Bull 2x ETF (NVDU) should also be on alert, given that oscillating prices lead to beta slippage on leveraged funds.
Editor’s Note: This article discusses one or more securities that do not trade on a major U.S. exchange. Please be aware of the risks associated with these stocks.
Analyst’s Disclosure: I/we have no stock, option or similar derivative position in any of the companies mentioned, and no plans to initiate any such positions within the next 72 hours. I wrote this article myself, and it expresses my own opinions. I am not receiving compensation for it (other than from Seeking Alpha). I have no business relationship with any company whose stock is mentioned in this article.
Seeking Alpha’s Disclosure: Past performance is no guarantee of future results. No recommendation or advice is being given as to whether any investment is suitable for a particular investor. Any views or opinions expressed above may not reflect those of Seeking Alpha as a whole. Seeking Alpha is not a licensed securities dealer, broker or US investment adviser or investment bank. Our analysts are third party authors that include both professional investors and individual investors who may not be licensed or certified by any institute or regulatory body.


