Summary:
- NVDA is up 25% after surprisingly optimistic guidance.
- There’s a lot to be excited about, but the price is getting overstretched.
- Using TA, I determine the best place to take profit/short and where I’d consider going long again.
Sundry Photography
Thesis Summary
NVIDIA Corporation (NASDAQ:NVDA) just popped over 25% pre-market after announcing Q1 earnings. Though YoY growth was negative, the company guided revenues to be much higher than analyst estimates.
In this article, I will assess the technical outlook for NVDA. While it is highly risky to short a company rallying on the AI hype like NVDA, I will point out my more immediate sell/short target, which should set us up for a 50% correction.
I highlight a reasonable area to re-enter longs, as the long-term chart suggests NVDA could break over $700 eventually. Following this, an even bigger pull-back could take place.
Earnings Overview
Looking at the NVDA earnings on a YoY basis, one might have expected the stock to drop by 25%.
NVDA Q1 overview (Investor Relations)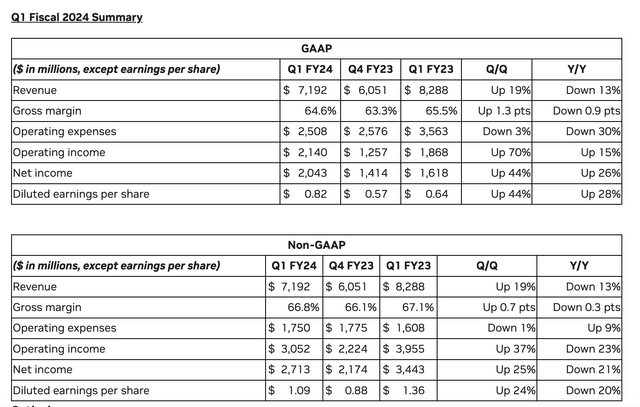
Revenue in Q1 was down 13% YoY. Oa non-GAAP bases, OI was down 23%, and EPS was down 20%. However, it is true that the QoQ numbers paint a different story. A story of a company that is once again growing at a click of almost 20%, with GAAP operating income up 70% and non-GAAP up 37%.
It is clear that demand for chips is on the rise, and NVDA is perhaps the best in the business. Most importantly, though, this bullish outlook is reflected in the outlook for the next quarter:
NVDA Outlook (Investor Relations)
The company expects revenues of $11 billion in the next quarter, which would be a +50% increase QoQ. This, while operating expenses would be $2.7 billion, roughly an increase of 7%.
A big part of the increase in sales and hype for NVDA comes from the advent of generative AI. In the earning call, the NVDA CEO explained why NVDA is uniquely positioned to profit from this.
So, nearly everybody who thinks about AI, they think about that chip, the accelerator chip and in fact, it misses the whole point nearly completely. And I’ve mentioned before that accelerated computing is about the stack, about the software and networking, remember, we announced very early-on this networking stack called DOCA and we have the acceleration library called Magnum IO. These two pieces of software are some of the crown jewels of our company. Nobody ever talks about it, because it’s hard to understand, but it makes it possible for us to connect 10s of 1,000s of GPUs.
Source: Earnings call
Jensen Huang also mentioned that the future of computing will be in GPUs not CPUs, which is perhaps why a company like NVDA is better positioned than other CPU-focused chip companies like Advanced Micro Devices (AMD) and Intel (INTC).
Long-Term Chart
Fundamentally, there’s a lot to like here, and the long-term chart also paints a very bullish picture, projecting the stock much higher.
NVDA Long-term chart (Author’s work)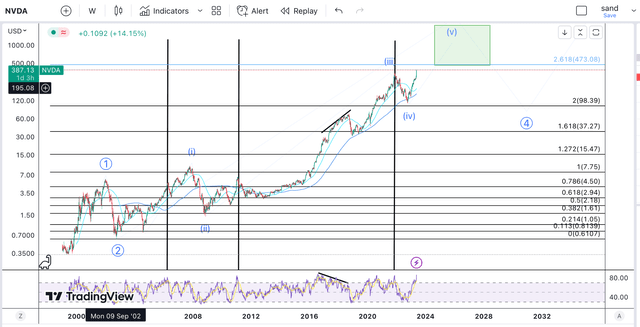
Above, you can see my best effort at establishing a long-term target for NVDA. This is done using Elliott Wave Theory.
What we can observe here is that NVDA has been developing a five wave impulse since it bottomed in a larger circle wave 2. The peak in Nov 2021 was the top of the wave (iii) and the sell-off we have now seen was a wave (iv) correction.
This means we are now completing a final rally in wave (v) inside the larger 3. Where would this wave 3 top?
Based on the larger degree structure, we could top out at the 2.618 ext at $473, but we could go even higher than this.
Before we look at this thought, it’s worth mentioning that, on the weekly chart seen above, most times, the RSI gets to the overbought levels at which we are today, and the stock tends to sell off.
An exception of this would be the 2016-18 rally, where we built a big divergence. The RSI slowly grinded lower as the price went higher.
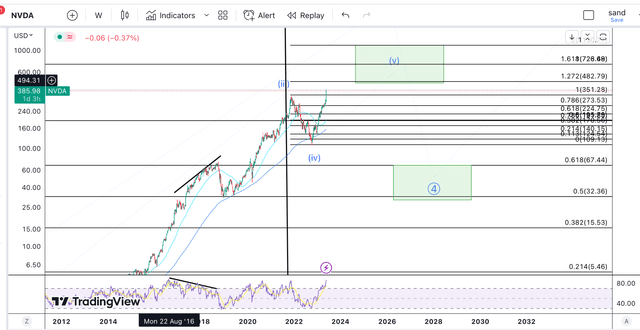
Looking at the more immediate action, if we measure the length of the wave (iv), the 1.618 ext projects us towards $726, which might be a more accurate target. However, the 1.272 ext at $482 is also possible.
Following this top, we’d expect a large degree retracement in wave 4. The 50% retracement of the circle wave 3 projects us down towards $32, which seems hard to believe at this point.
Short-Term Chart
So, how do we play this dynamic in NVDA?
NVDA short-term TA (Author’s work)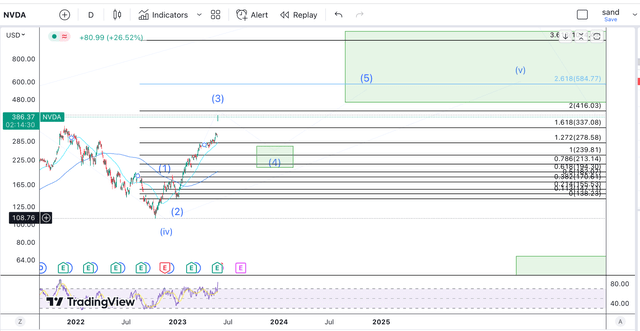
Zooming into the shorter-term structure, I think we could be topping in wave 3 pretty soon. The next key fib level here is the 2 ext of the wave 1 measured from the bottom of wave 2, and this sits at $416.
Once we reach this point, and given that this is already close to my long-term target, I might consider taking profits and or shorting the stock.
We could then see a correction that takes us at least into the $270 region, which would be the 32.8% retracement of this recent rally in wave 3.
At this point, I’d begin to layer in, setting buy orders above the 50% and 61.8% retracement shown below.
NVDA short-term TA (Author’s work)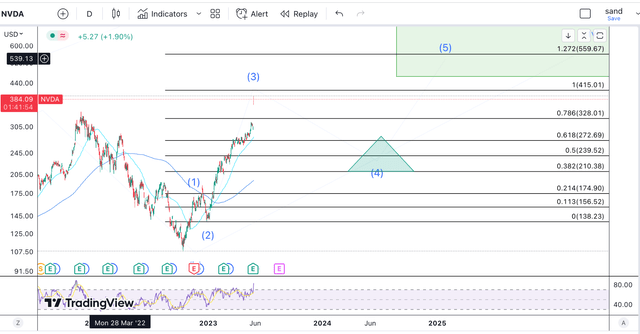
In order to manage risk better, I’d consider using this “triangle” strategy, meaning increasing the size of buy orders as we head lower into support.
The 200-day MA should offer us support below at around $200, and this would be the last line of defence before we consider something more bearish.
Primarily, though, I expect NVDA could head back up from this point to the 1.618 ext of wave (iv) highlighted above, which is around $726.
Final Thoughts
The latest rally in NVDA will have a lot of people looking to short, but it will also have a lot of late buyers trying to get a piece of the action. My expectation is that both groups will face a challenging environment.
Those shorting now could find themselves underwater as the stock continues to climb 10% or even 20% from here. Following this, though, I’d expect a significant drawdown into my target triangle area. This would be the safe area to go long, using that 200-day MA as a tight resistance and possible stop-loss.
Analyst’s Disclosure: I/we have no stock, option or similar derivative position in any of the companies mentioned, and no plans to initiate any such positions within the next 72 hours. I wrote this article myself, and it expresses my own opinions. I am not receiving compensation for it (other than from Seeking Alpha). I have no business relationship with any company whose stock is mentioned in this article.
Seeking Alpha’s Disclosure: Past performance is no guarantee of future results. No recommendation or advice is being given as to whether any investment is suitable for a particular investor. Any views or opinions expressed above may not reflect those of Seeking Alpha as a whole. Seeking Alpha is not a licensed securities dealer, broker or US investment adviser or investment bank. Our analysts are third party authors that include both professional investors and individual investors who may not be licensed or certified by any institute or regulatory body.
If you like this style of technical analysis, join today and gain instant access to:
– My stock and crypto Portfolio
– Weekly trade ideas using TA and fundamental analysis.
– Weekly macro newsletter
Strat your 2-week free trial!

