
Summary:
- Nvidia Corporation’s competitive advantages in performance, product breadth, and cost, along with a growing brand presence, contribute to its strong position in the market.
- The company’s comprehensive approach to AI spans multiple industries and applications, with a full stack of AI products and strategic partnerships.
- In a bull case valuation, Nvidia’s shares are undervalued by 45%, driven by higher forward revenue growth due to AI developments.
- We project that AI could double Nvidia’s revenue growth over the next few years in the bull case scenario.
Justin Sullivan
In our previous analysis of Nvidia Corporation (NASDAQ:NVDA), we saw its data center segment exceeded our expectations, driven by its competitive advantage with a wide product breadth and expanding market share. We anticipated a strong 41% growth rate for this segment in 2023, as Nvidia continues to strengthen its position. Furthermore, we also expected a positive recovery for the Gaming and Professional Visualization segments in FY2024 despite the challenging PC GPU market. Also, we projected improvements in its free cash flow (“FCF”) margin, driven by growing gross margins and reduced operating expenses.
Although we just covered Nvidia a month ago, we covered the company again after it released its Q1 FY2024 results and its stock price has risen by 40% since its earnings release. This is following the company’s briefing where it guided revenues for the next quarter to be $11 bln which is much higher than analysts’ consensus of $7.2 bln before its earnings release. Based on its guidance, the annualized Q1 actual and Q2 revenue guidance indicate a YoY growth of 49% which is higher compared to our previous forecast of 28.7% this year. Management expects its growth “to largely be driven by data center, reflecting a steep increase in demand related to generative AI and large language models.” Thus, our research focuses on the growth outlook of Nvidia, and we determine how to factor in additional AI growth in our projections.
Firstly, we compiled our previously identified competitive factors for the company. Moreover, we then analyze the latest developments surrounding AI in Nvidia for all of its segments and how it could impact Nvidia’s competitiveness based on these factors. Finally, we derived an AI factor score increase for each segment and factored it into our revenue projections in a bull case.
Factors Affecting Nvidia’s Competitive Advantage
From our previous analyses, we highlighted several advantages that Nvidia has, including a performance and product breadth advantage as well as superior product value against competitors highlighting a cost advantage.
Data Center Segment
Company Data, Khaveen Investments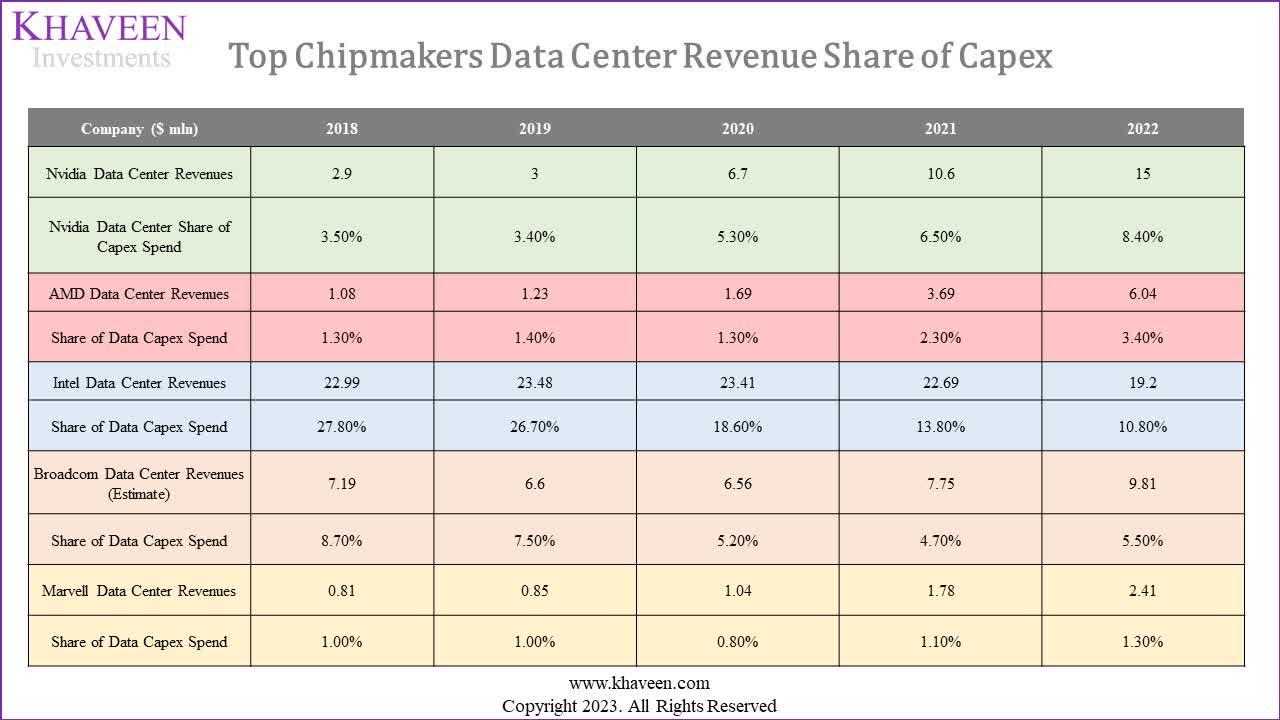
In our last analysis, we highlighted Nvidia’s increasing share of the cloud providers’ capex spending from 2018 to 2022. Nvidia’s share increased the most by nearly 2% in 2022 and has had consistent growth over the past five years. Furthermore, we projected the company’s Data Center segment assuming a share gain assumption of 1.7% per year based on its 3-year average. We believed the company’s strength in market share growth was attributable to the rapidly expanding data center GPU market as GPUs are better suited for AI and machine learning calculations, benefitting Nvidia with its dominant position with an 88% market share in data center GPUs.
Company Data, Khaveen Investments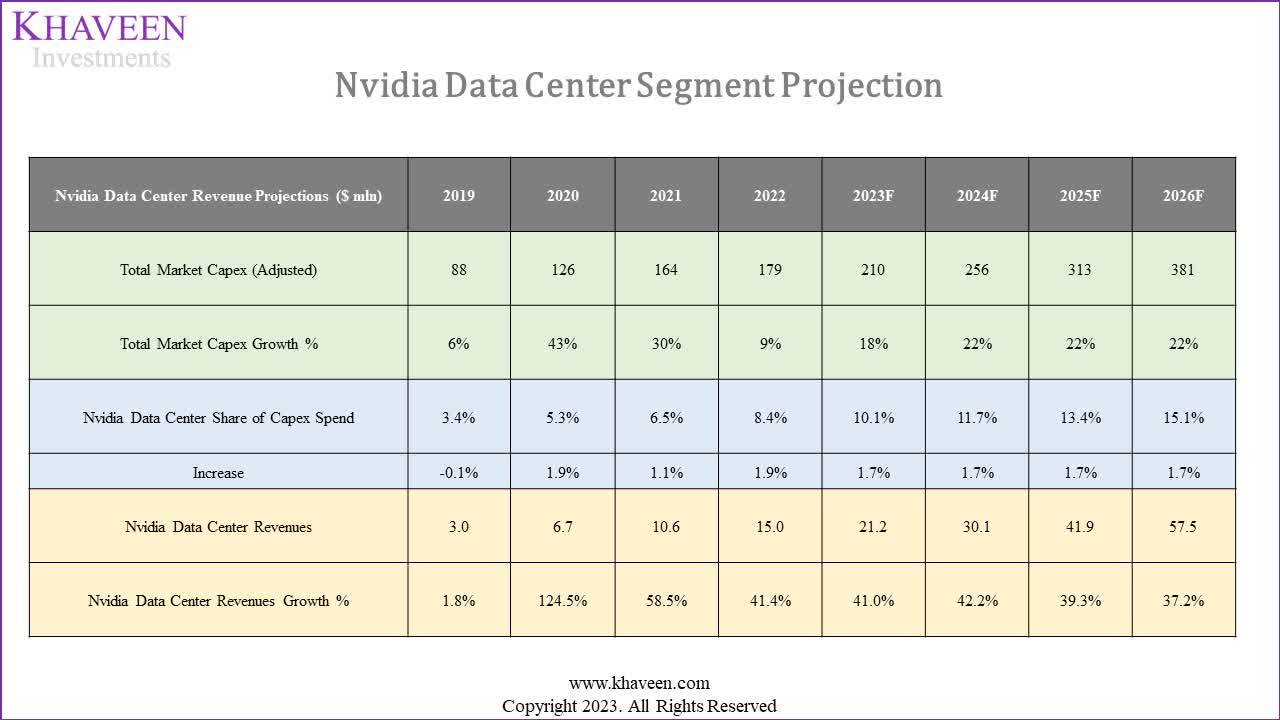
We saw Nvidia be in a prime position to capture the on-premises server and cloud market and forecasted its data center segment growth based on our projected cloud providers’ capex (Amazon (AMZN), Google (GOOG), Microsoft (MSFT), and Alibaba (BABA)) as “its AI-powered GPU accelerators are deployed in more than 97% of all AI-accelerator hardware used by the top 4 cloud providers.”
Company Data, Khaveen Investments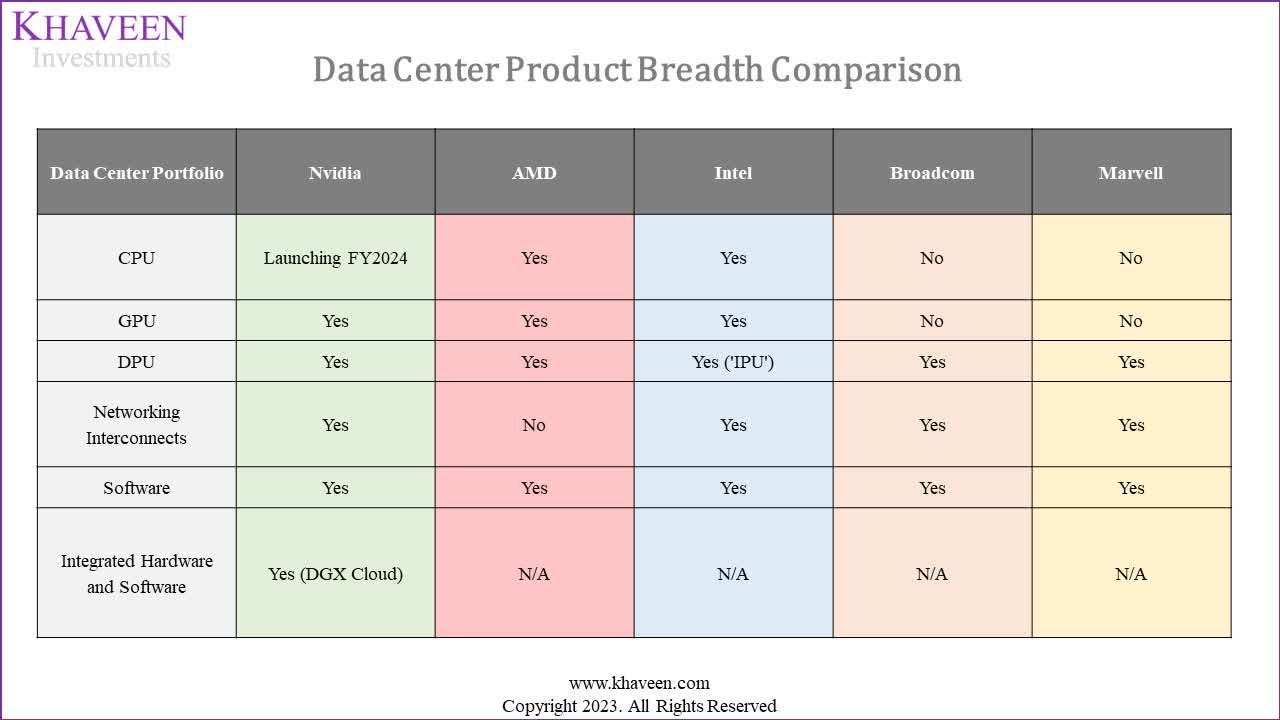
We highlighted our assumption for its share increase due to its competitiveness in the data center market with its product breadth and performance advantages.
Gaming and Professional Visualization Segments (PC GPUs)
Moreover, for its Gaming segment, we also forecasted its market share in PC GPUs to increase with its superior performance and cost advantages delivering superior value compared to Intel (INTC) and AMD (AMD).
Company Data, Khaveen Investments PassMark, Company Data, Khaveen Investments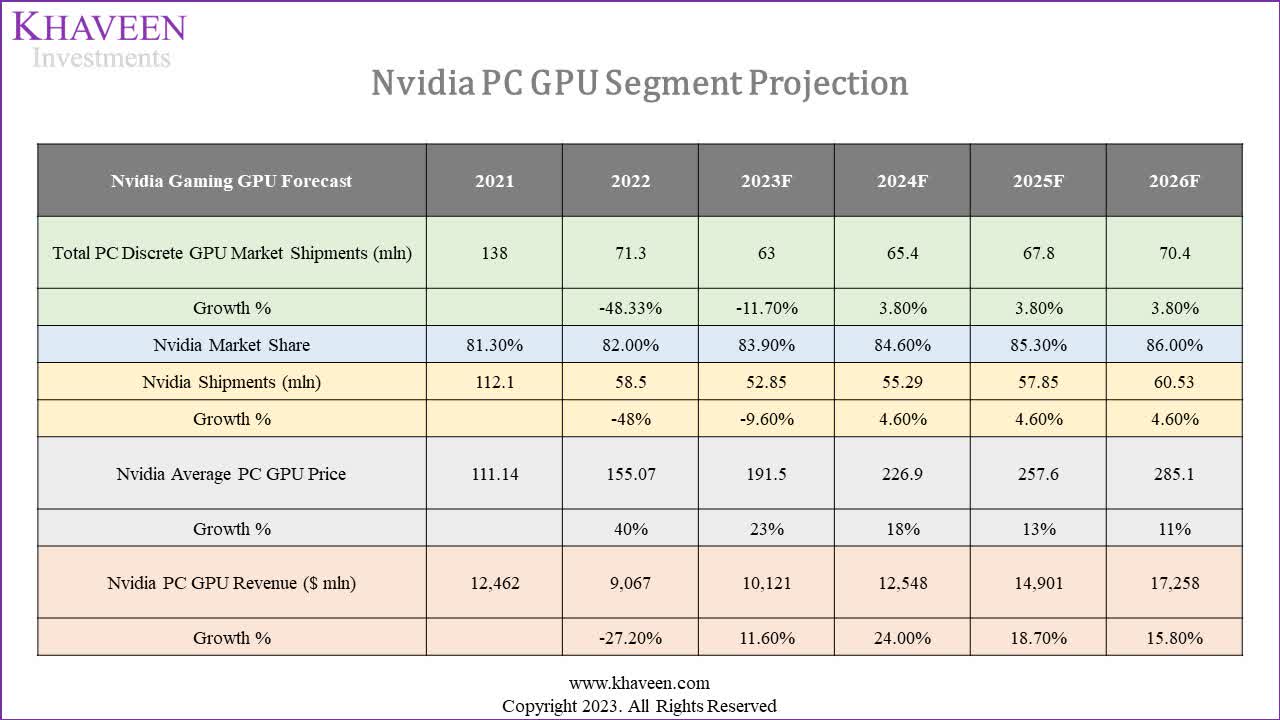
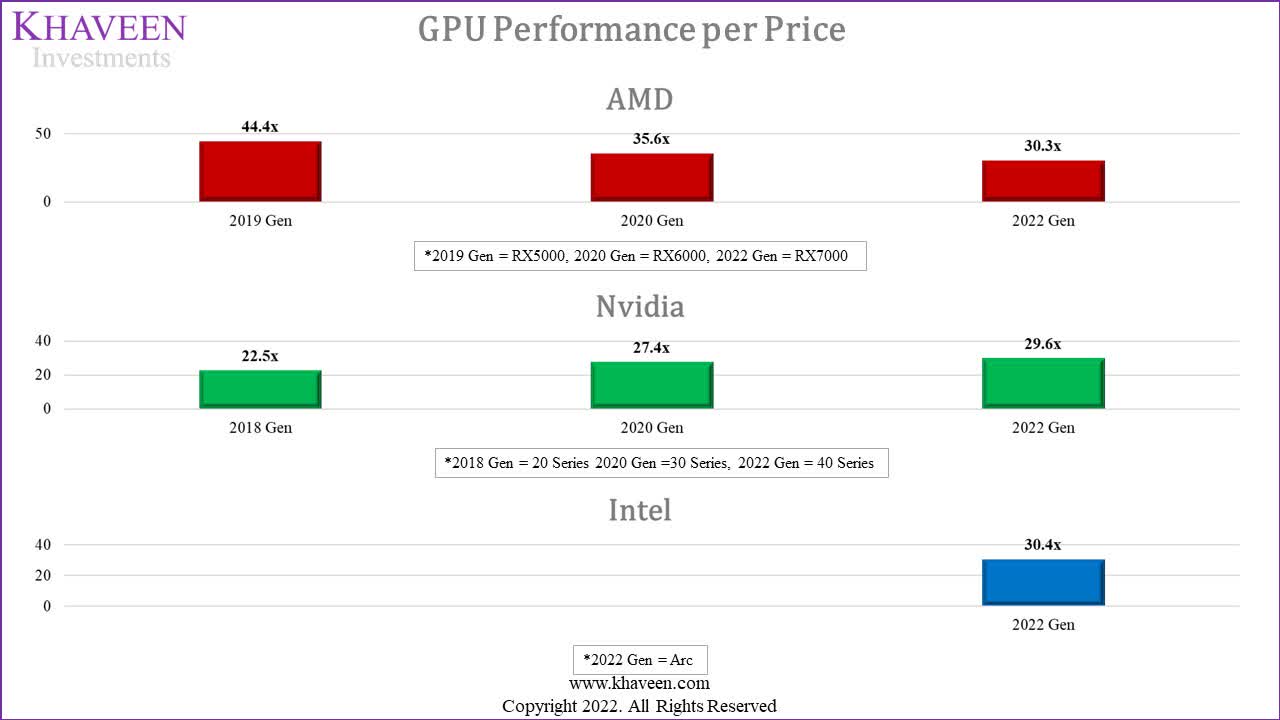
For its Gaming segment, we previously highlighted that “its value as measured by performance per pricing increased as a result of lower pricing growth to performance growth at 8%.” We forecasted its Gaming segment to grow with an assumption of its share in the PC GPU market to continue to rise steadily. This is as we previously forecasted its share growth “with its increasing value advantage over competitors based on an average factor of 1.22x.”
Branding Advantage
Google Trends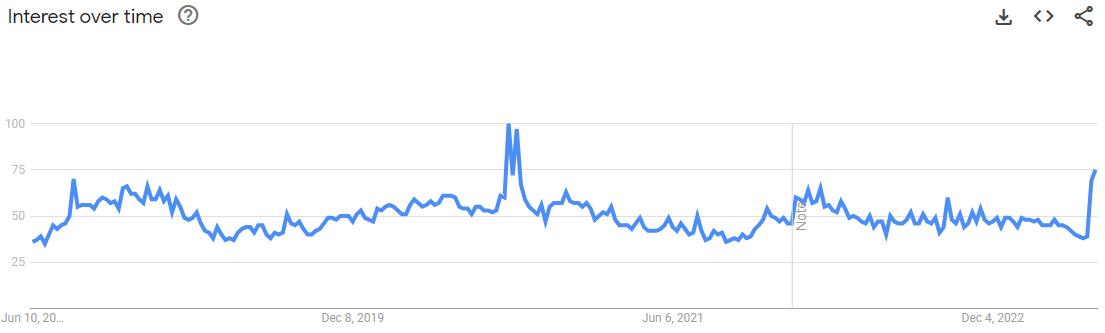
|
Nvidia Google Trends Score |
2019 |
2020 |
2021 |
2022 |
Average |
|
Nvidia Average Google Trends Score |
46.4 |
57.6 |
45.0 |
50.1 |
|
|
Growth % |
24.2% |
-21.9% |
11.5% |
4.6% |
Source: Google Trends, Khaveen Investments.
To analyze whether the company has any branding advantage, we examined its Google Trends score in the past 4 years. Based on the table, we calculated its average Google Trends score in the past 4 years and its growth rate. The company’s average score has been between 45 to 57.6 in the past 4 years, with an average of 4.6%. As the company has a positive average growth for its score, we believe this indicates an advantage of its branding growth in the past years.
Overall, we had previously identified and highlighted that we believed Nvidia has an advantage in terms of performance, product breadth as well as cost with the superior value of its PC GPUs. Moreover, we believe the company also has a benefit in terms of its growing branding as analyzed based on its Google Trends score with a positive average growth in the past 3 years.
Nvidia’s AI Strengths
In our previous analyses, we highlighted several strengths that Nvidia has in AI. We compiled the company’s AI strengths below. We previously highlighted 3 advantages for Nvidia which include performance, cost and product breadth advantages. Additionally, we also consider branding to be a factor in the company’s competitiveness.
Developing AI Across the Board – Product Breadth
In our previous research on Nvidia, we highlighted that semiconductor companies driving innovations in AI such as Nvidia, Intel and AMD with AI capabilities in their chips. We viewed Nvidia “as not just an AI leader of the semiconductor industry, but as the AI leader of the world” as its goal is to develop AI solutions across the board for various industries from automotive to data centers. For example, we highlighted the company’s developments for AI with applications in autonomous driving in the automotive industry as well as in aerospace, banking and telecommunications. We believe the company’s development across the board supports its product breadth competitive factor with a broad product portfolio.
Full Stack of AI Products – Performance
|
Data Center Portfolio |
Nvidia |
AMD |
Intel |
Broadcom |
Marvell |
|
CPU |
Launching FY2024 |
Yes |
Yes |
No |
No |
|
GPU |
Yes |
Yes |
Yes |
No |
No |
|
DPU |
Yes |
Yes |
Yes (‘IPU’) |
Yes |
Yes |
|
Networking Interconnects |
Yes |
No |
Yes |
Yes |
Yes |
|
Software |
Yes |
Yes |
Yes |
Yes |
Yes |
|
Integrated Hardware and Software |
Yes (DGX Cloud) |
N/A |
N/A |
N/A |
N/A |
Source: Company Data, Khaveen Investments.
Furthermore, we believe another strength of the company in AI is its AI product development. As summarized above for its data center products from our previous analysis with the addition of Broadcom and Marvell, the company has the broadest product breadth among competitors. We highlighted these products and their relation to AI. For example, GPUs known for their superior compute capabilities with thousands of threads, are preferred over CPUs for AI and machine learning tasks in enterprise data centers. GPUs are projected to dominate data center processing, reducing CPUs’ budget share from 83% in 2020 to 40% by 2030 as covered previously. Nvidia in its annual report emphasized its CUDA programming model and parallel processing capabilities of GPUs for intensive workloads like deep learning. Additionally, the recent launch of Nvidia’s H100 data center GPU surpassed the A100 and outperformed competitors like AMD. Furthermore, Nvidia has introduced the Grace CPU Superchip specifically designed for AI infrastructure which we believe supports its performance competitive factor.
Integrated Solutions – Product Breadth
Nvidia’s DGX server is a high-end solution for AI workloads. Unlike consumer-grade GPU chipsets, DGX servers are expensive, with a single server costing $4.3 mln annually. The DGX server has been recognized for its impressive AI workload speeds by NERSC. Nvidia has also introduced its DGX Cloud, attracting major cloud providers such as Microsoft, Google, and Oracle (ORCL). Each DGX Cloud instance includes powerful GPUs, advanced networking, and integrated storage for high-performance AI computing. We believe its integrated solutions benefit its product breadth advantage.
AI Software Integrations – Product Breadth
Nvidia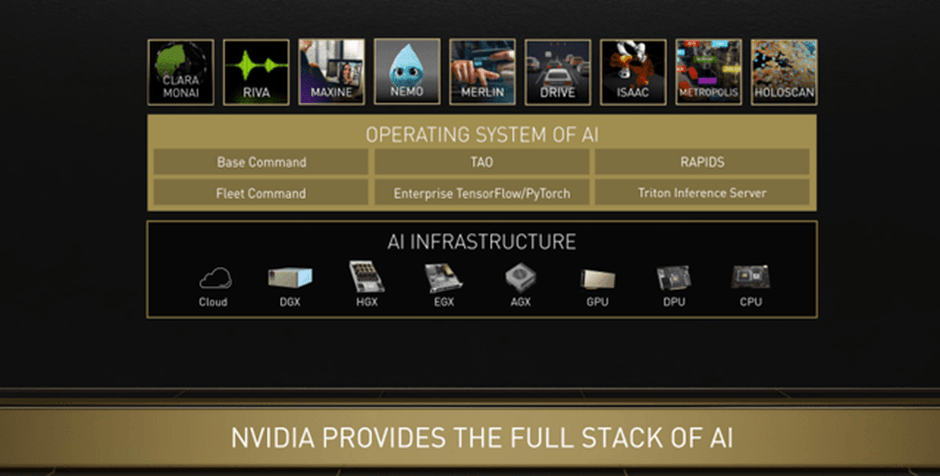
In our previous analysis, we highlighted that Nvidia offers a comprehensive range of AI solutions, including hardware, software, and development kits. It has a vast collection of over 450 AI libraries and software development kits, catering to various industries. Nvidia has been steadily increasing its patent portfolio, with 1,174 patents in 2021. In comparison, AMD has more patents (1,795), while Intel has the highest number of patents (11,677) but with a declining trend. Nvidia introduced its standalone enterprise software, NVIDIA AI Enterprise used by 25,000 enterprises. We believe this enhances the company’s product breadth advantage with its AI software integrations.
Partnerships in AI – Branding
Furthermore, another strength of the company is its partnerships with AI. We highlight several of Nvidia’s partnerships including Google Cloud becoming the first provider to offer the new NVIDIA L4 Tensor Core GPU for accelerating generative AI applications. Additionally, partnerships with various companies such as ServiceNow (NOW), Medtronic (MDT), Dell Technologies (DELL), and Microsoft have been formed to develop generative AI solutions for enterprise IT, medical devices, and secure on-premises AI. We believe these partnerships enhance the company’s reputation and branding, as the company partnered with some of the largest companies in the cloud and the PC markets.
All in all, we believe the company has several strengths in terms of AI due to its development of AI across the board for various industries and applications, a full stack of AI products from GPUs to CPUs to DPUs, integrated solutions by combining and leveraging its products to create powerful systems for AI as well as partnerships in AI. We believe these strengths enhance the company’s performance, product breadth and branding competitive factors.
How AI is Beneficial to Nvidia’s Growth
Finally, in this section, we updated our projections taking account of the latest developments of Nvidia in AI on our AI factor scores for Nvidia’s segments.
Data Center
|
Nvidia Data Center |
Without AI |
With AI |
|
Performance |
1 |
1.21 |
|
Cost |
1 |
1.00 |
|
Product Breadth |
1 |
1.51 |
|
Branding |
1 |
1.06 |
|
Average |
1.19 |
Source: Company Data, Khaveen Investments.
For the company’s data center segment, we calculated an AI increase factor for each of the 4 competitive factors of the company that we highlighted above. For the performance AI increase factor, we calculated this based on the growth of the difference between our estimated performance score for its latest GeForce 40 series based on the historical growth rate of 27% (29,224) and the actual benchmark score of 35,434.
|
Performance |
2018 Gen |
2020 Gen |
2022 Gen |
|
Nvidia |
18,128 |
23,017 |
35,434 |
|
Growth % |
27.0% |
53.9% |
|
|
Calculated Performance Based on Historical Growth |
29,224 |
||
|
Performance Increase Attributed to AI |
6,209 |
Source: Company Data, Khaveen Investments.
Moreover, for the product breadth AI factor score, we compared the company the number of product developments of Nvidia in 2023 (annualized) related to its data center segment and compared it with our calculated number of product developments based on its historical growth rate in 2022 for 2023.
|
Product Breadth |
2022 |
2023 (Annualized) |
2023 (Based on Historical Growth) |
|
Data Center |
13 |
15 |
10 |
Source: Company Data, Khaveen Investments.
For the cost advantages, we assumed a constant score increase factor as we could not effectively estimate the difference between the prices that its latest generation should be accounting for the value added from AI compared with its actual pricing.
Finally, for its branding, we calculated the company’s Google Trends score in 2023 based on its historical 3-year average (52.4) and compared it with the company’s current score of 55.5.
|
Nvidia Google Trends Score |
2019 |
2020 |
2021 |
2022 |
Average |
Current |
Branding Based on Historical Growth |
|
Nvidia Average Google Trends Score |
46.4 |
57.6 |
45.0 |
50.1 |
55.5 |
52.4 |
|
|
Growth % |
24.2% |
-21.9% |
11.5% |
4.6% |
10.7% |
Source: Company Data, Khaveen Investments.
Overall, we obtained an average AI score increase factor of 1.19x for Nvidia’s data center segment.
Gaming and Professional Visualization (PC GPUs)
|
Nvidia PC GPU |
Without AI |
With AI |
|
Performance |
1 |
1.21 |
|
Cost |
1 |
1.00 |
|
Product Breadth |
1 |
1.88 |
|
Branding |
1 |
1.06 |
|
Average |
1.29 |
Source: Company Data, Khaveen Investments.
For its Gaming and Professional Visualization segments, we calculated its AI increase factor for both segments with the performance factor based on the same factor used above of 1.21x. Additionally, we also assumed a constant score increase factor as we could not effectively estimate the difference between the prices that its latest generation should be accounting for the value added from AI compared with its actual pricing. For branding, we used the same factor as calculated above to be applied for the whole company rather than a single segment.
|
Product Breadth |
2022 |
2023 (Annualized) |
2023 (Based on Historical Growth) |
|
Gaming and Professional Visualization |
4 |
10 |
5 |
Source: Company Data, Khaveen Investments.
For the Gaming and Professional Visualization segments’ product breadth score increase factor with AI, we compared the company the number of product developments of Nvidia in 2023 (annualized) for both Gaming and Professional Visualization segments combined at 10 and compared it with our calculated number of product developments based on its historical growth rate in 2022 for 2023 (5).
Overall, we computed a factor of 1.29x for the company’s Gaming and Professional Visualization segments.
Automotive
|
Nvidia Automotive |
Without AI |
With AI |
|
Performance |
1 |
1.21 |
|
Cost |
1 |
1 |
|
Product Breadth |
1 |
1 |
|
Branding |
1 |
1.06 |
|
Average |
1.07 |
Source: Company Data, Khaveen Investments.
Finally, for the automotive segment, we based its performance on our calculated AI increase factor for the company’s PC GPU as the company’s latest automotive SoC, the Nvidia DRIVE Thor, incorporates its Ada Lovelace architecture for its GPUs.
Furthermore, we assumed a constant score increase factor for cost as we could not effectively estimate the difference between the prices that its latest generation should be accounting for the value added from AI compared with its actual pricing. Additionally, for its product breadth score, we assumed a factor of 1 as the company has not announced any new developments for its automotive segment in 2023. As for branding, we used the same factor as calculated above to be applied for the whole company rather than a single segment.
|
Segment |
Average Score Increase Factor |
|
Data Center |
1.19 |
|
Gaming |
1.29 |
|
Professional Visualization |
1.29 |
|
Automotive |
1.07 |
Source: Company Data, Khaveen Investments.
All in all, we see the company’s Gaming and Professional Visualization segments having the highest score increase factor due to AI at 1.29x as they have the highest product breadth increase factor of 1.88x. This is followed by our Data Center segment score increase factor of 1.19x. Finally, we see the Automotive segment with a score increase factor of 1.07x.
Valuation
Revenue Projection
For the revenue projection, we updated our growth forecasts from our previous analysis in a base and bull case. For the base case, we assumed the same growth rates used previously. For the bull case, we assumed the growth rate forecasts from our previous analysis were adjusted by our calculated AI increase factor.
|
Nvidia Revenue Projection Base Case ($ mln) |
2021 |
2022 |
2023F |
2024F |
2025F |
|
Gaming |
12,462 |
9,067 |
10,121 |
12,548 |
14,901 |
|
Growth % |
60.6% |
-27.2% |
11.6% |
24.0% |
18.7% |
|
Professional Visualization |
2,111 |
1,544 |
1,724 |
2,137 |
2,537 |
|
Growth % |
100.5% |
-26.9% |
11.6% |
24.0% |
18.7% |
|
Data Center |
10,613 |
15,005 |
21,161 |
30,096 |
41,938 |
|
Growth % |
58.5% |
41.4% |
41.0% |
42.2% |
39.3% |
|
Automotive |
566 |
903 |
1,247 |
1,722 |
2,378 |
|
Growth % |
5.6% |
59.5% |
38.1% |
38.1% |
38.1% |
|
OEM and Other |
1,162 |
455 |
455 |
455 |
455 |
|
Growth % |
84.2% |
-60.8% |
0.0% |
0.0% |
0.0% |
|
Total |
26,914 |
26,974 |
34,708 |
46,958 |
62,209 |
|
Growth % |
61.4% |
0.2% |
28.7% |
35.3% |
32.5% |
Source: Company Data, Khaveen Investments.
|
Nvidia Revenue Projection Bull Case ($ mln) |
2021 |
2022 |
2023F |
2024F |
2025F |
|
Gaming |
12,462 |
9,067 |
13,021 |
20,767 |
31,725 |
|
Growth % |
60.6% |
-27.2% |
43.6% |
59.5% |
52.8% |
|
Professional Visualization |
2,111 |
1,544 |
2,217 |
3,536 |
5,402 |
|
Growth % |
100.5% |
-26.9% |
43.6% |
59.5% |
52.8% |
|
Data Center |
10,613 |
15,005 |
25,286 |
42,974 |
71,556 |
|
Growth % |
58.5% |
41.4% |
68.5% |
70.0% |
66.5% |
|
Automotive |
566 |
903 |
1,331 |
1,963 |
2,895 |
|
Growth % |
5.6% |
59.5% |
47.5% |
47.5% |
47.5% |
|
OEM and Other |
1,162 |
455 |
455 |
455 |
455 |
|
Growth % |
84.2% |
-60.8% |
0.0% |
0.0% |
0.0% |
|
Total |
26,914 |
26,974 |
42,310 |
69,696 |
112,033 |
|
Growth % |
61.4% |
0.2% |
56.9% |
64.7% |
60.7% |
Source: Company Data, Khaveen Investments.
The difference between our base and bull case at a 3-year forward average is 28.6% higher for the bull case (60.8%) compared to the base case (32.1%) with automotive growth % increasing the highest. However, the data center segment, although with the lowest score increase factor, contributes the highest growth for its total revenue as it is its largest segment. Our updated revenue projections are also now more aligned with analysts’ revenue consensus (58.8% in FY2023), thus we believe it is more appropriate.
DCF
Khaveen Investments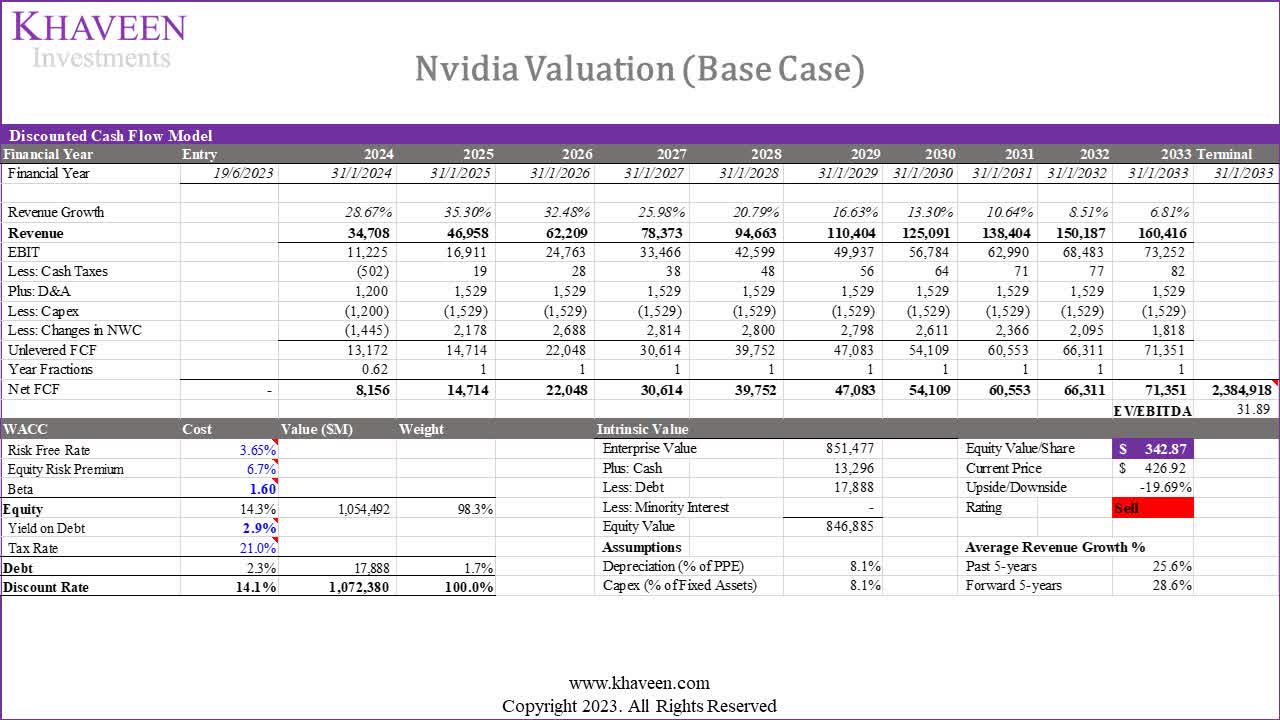
For the base case, our discounted cash flow (“DCF”) model shows that the company has a downside of 19.7% despite a higher EV/EBITDA average of 31.89x compared to 23.68x previously.
Khaveen Investments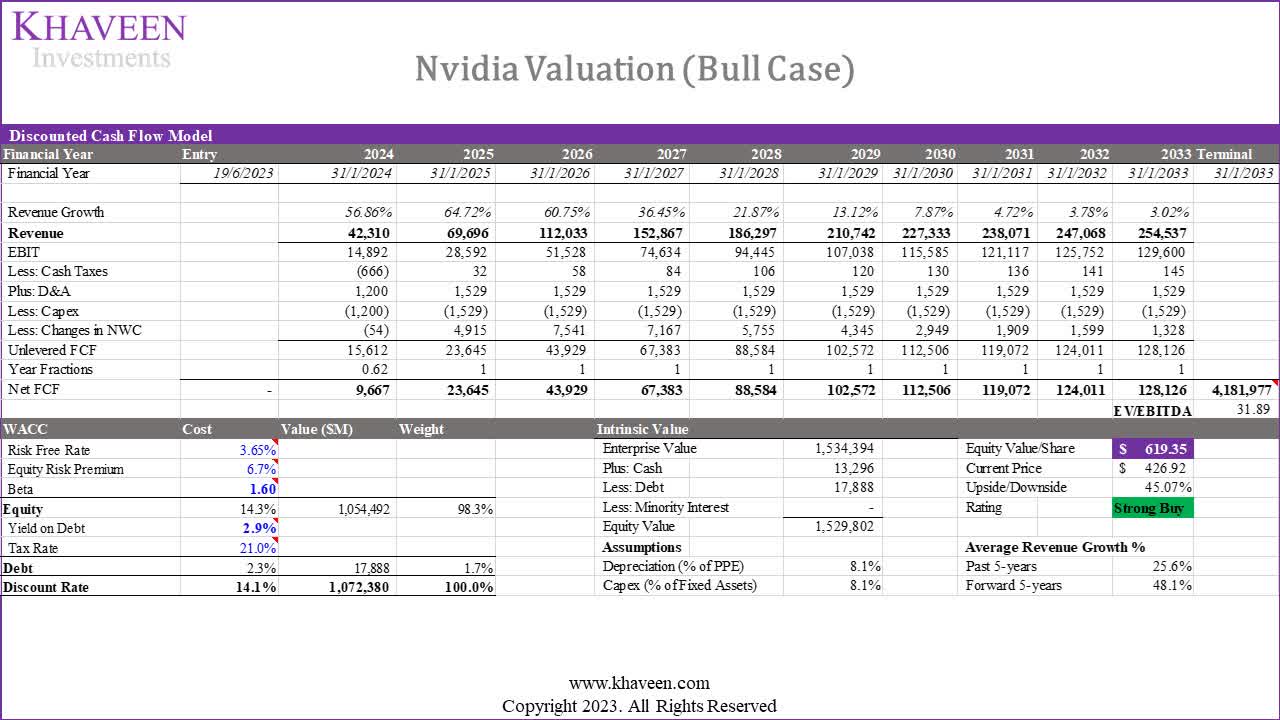
For the bull case, our DCF model shows that the company’s shares are undervalued by 45%.
P/S Valuation
Seeking Alpha, Yahoo Finance, Khaveen Investments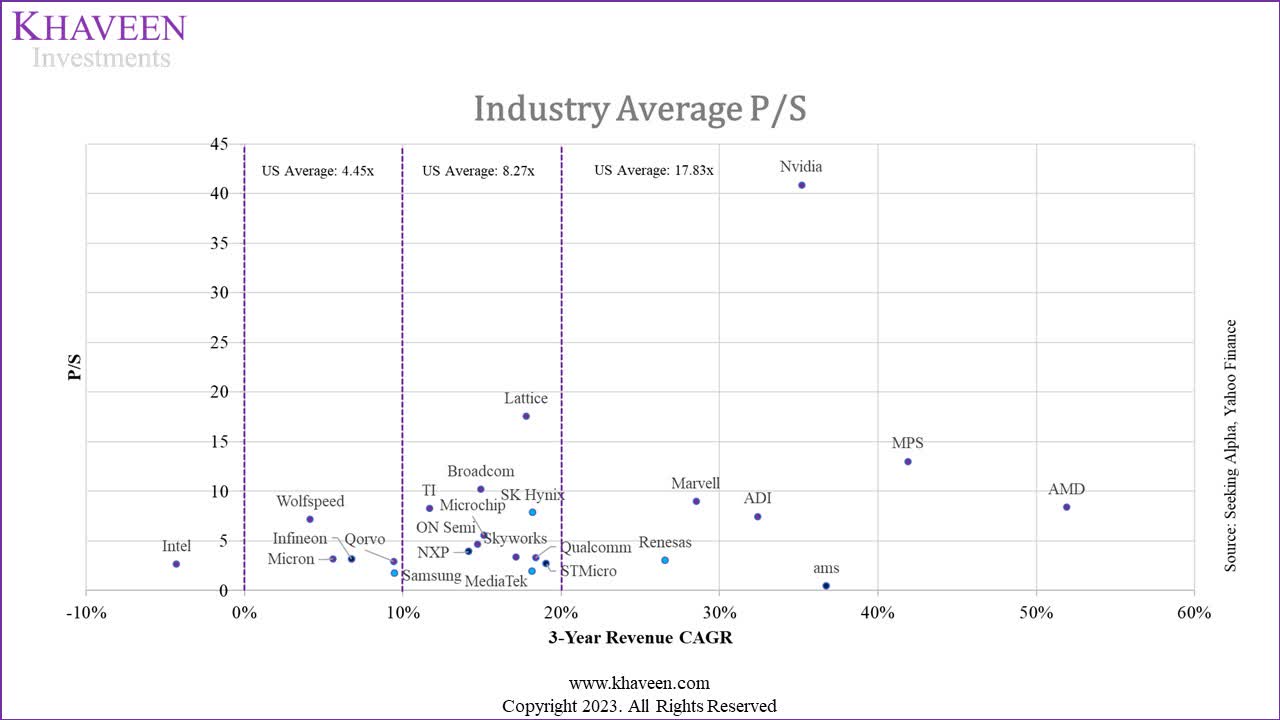
In addition to our DCF valuation, we derived a valuation for the company based on P/S as we see the company’s revenue growing strongly again above 20%.
|
Valuation (Base Case) |
2023F |
2024F |
2025F |
|
Revenue ($ mln) |
34,708 |
46,958 |
62,209 |
|
Growth Rate % |
28.7% |
35.3% |
32.5% |
|
P/S |
30.84 |
23.20 |
17.83 |
|
Valuation ($ mln) |
1,070,258 |
1,089,397 |
1,108,879 |
|
Shares Outstanding |
2,463 |
2,463 |
2,463 |
|
Price Target |
$434.55 |
$442.33 |
$450.24 |
|
Current Price |
$426.92 |
$426.92 |
$426.92 |
|
Upside |
1.8% |
3.6% |
5.5% |
Source: Khaveen Investments.
For the base case, our model shows its shares have a limited upside of 1.8% based on the average P/S of 17.83x in 2025 for the U.S. only chipmakers with above 20% CAGR (excluding ADI due to its Maxim acquisition).
|
Valuation (Bull Case) |
2023F |
2024F |
2025F |
|
Revenue ($ mln) |
42,310 |
69,696 |
112,033 |
|
Growth Rate % |
56.9% |
64.7% |
60.7% |
|
P/S |
30.78 |
23.14 |
17.83 |
|
Valuation ($ mln) |
1,302,125 |
1,612,556 |
1,996,994 |
|
Shares Outstanding |
2,463 |
2,463 |
2,463 |
|
Price Target |
$528.70 |
$654.74 |
$810.84 |
|
Current Price |
$426.92 |
$426.92 |
$426.92 |
|
Upside |
23.8% |
53.4% |
89.9% |
Source: Khaveen Investments.
For the bull case, our model shows its shares have an upside of 23.8% based on the average P/S of 17.83x in 2025 for U.S. only chipmakers with above 20% CAGR.
|
Nvidia Valuation |
Base Case |
Bull Case |
|
DCF |
$342.87 |
$619.35 |
|
Upside |
-19.7% |
45.1% |
|
P/S |
$434.55 |
$528.70 |
|
Upside |
1.79% |
23.8% |
|
Average |
$388.71 |
$574.03 |
|
Upside |
-8.9% |
34.5% |
Source: Khaveen Investments.
Verdict
In our assessment, we believe Nvidia Corporation possesses several key advantages that contribute to its strong competitive position. The company excels in terms of performance, product breadth, and cost, offering superior value with its PC GPUs. Additionally, our analysis of Google Trends score indicates a growing brand presence for Nvidia. Another notable strength lies in Nvidia’s comprehensive approach to artificial intelligence (AI), spanning multiple industries and applications. With a full stack of AI products encompassing GPUs, CPUs, and DPUs, we believe Nvidia delivers integrated solutions that empower powerful AI systems. Furthermore, Nvidia has formed strategic partnerships in the AI domain, further bolstering its competitive edge. Overall, for the company’s Gaming and Professional Visualization segments, we derived an AI factor score of 1.29x driven by its product breadth and performance. The Datacenter segment follows with a score increase factor of 1.19x.
Overall, in our base case valuation based on DCF, our increase in price target to $342.87 from $271.60 is driven by the increase in the chipmakers’ average EV/EBITDA of 31.89x from 23.7x previously. Notwithstanding, we derived a bull case price target of $619.35 which is an upside of 45% with higher forward revenue growth at a 3-year average of 60.8% compared to 32.1% in our base case after factoring in our calculated AI increase factors on our previously projected revenues. In our P/S valuation, we obtained a base case valuation of $434.55 based on U.S.-only chipmaker average P/S with above 20% 3-year CAGR (17.83x) whereas our bull case P/S valuation is higher at $528.70.
We will continue to monitor Nvidia and its developments surrounding AI to see whether Nvidia justifies our bull case valuation which depends on the company’s execution in AI development, but for now, we rely on our base case assumptions. Overall, we rate the company as a Hold based on our average base case price target of our DCF and P/S valuations, which is conservative at $388.71, as we believe the company could have a sustainable growth outlook above 20% due to its AI developments.
Analyst’s Disclosure: I/we have a beneficial long position in the shares of NVDA either through stock ownership, options, or other derivatives. I wrote this article myself, and it expresses my own opinions. I am not receiving compensation for it (other than from Seeking Alpha). I have no business relationship with any company whose stock is mentioned in this article.
No information in this publication is intended as investment, tax, accounting, or legal advice, or as an offer/solicitation to sell or buy. Material provided in this publication is for educational purposes only and was prepared from sources and data believed to be reliable, but we do not guarantee its accuracy or completeness.
Seeking Alpha’s Disclosure: Past performance is no guarantee of future results. No recommendation or advice is being given as to whether any investment is suitable for a particular investor. Any views or opinions expressed above may not reflect those of Seeking Alpha as a whole. Seeking Alpha is not a licensed securities dealer, broker or US investment adviser or investment bank. Our analysts are third party authors that include both professional investors and individual investors who may not be licensed or certified by any institute or regulatory body.