Summary:
- Nvidia’s stock has consistently climbed through my outlined targets and is now primed for its largest wave yet.
- The company maintains a dominant market share in the GPU sector and has contributed as a frontrunner to advancements in AI technology while consistently providing the market with earnings beats over the last twelve months.
- With latest earnings just over a week away, will this be the catalyst that launches Wall Street’s darling towards the $1600 region.

Vertigo3d
My history charting Wall Street’s latest darling stock is pretty straightforward. There have been financial markets I have charted in, particularly during bear markets that, have come within dollars of their targets. Not Nvidia (NASDAQ:NVDA), it has shown its wave pattern hand and landed or in the latest bullish cases, exploded to target each time.
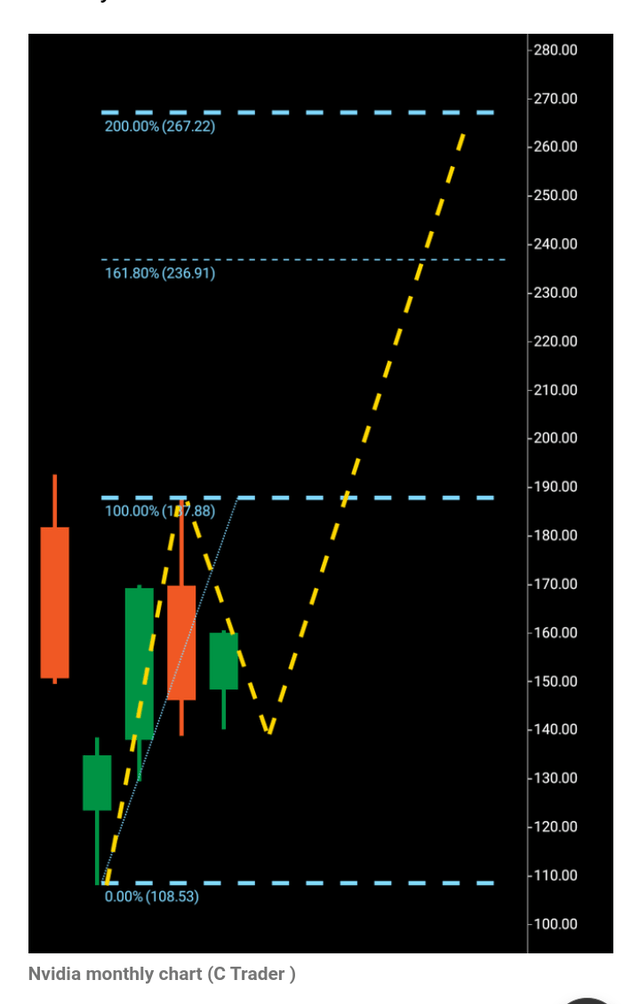
In September of 2022 I outlined a scenario for Nvidia dropping from $143-$121 with $108 the actual bottom in that bear market, but as the saying goes “People generally make money when things go up” so with that, seeing a potential macro bullish turnaround on the monthly in January of 2023, I published an article exclusively with Seeking Alpha outlining that, if this equity broke $187 it would go looking for $267 as a next stop.

Nvidia Breakout Chart (C trader )
You can see the original chart above and find a link to the chart here.
But $267 is very far from where this tech giant sits today, for those who follow me on LinkedIn will know that the additional recommended targets were $445 then $700/$800, but it is actually this potential upcoming wave to the $1600 region that is by far the largest since the $108 bottom came in.
I have encountered many analysts over this period that explained Nvidia wouldn’t move higher at various stages, with some returning to Seeking Alpha to outline why they were wrong.
The reality is, for one, none of us have a crystal ball to read into where any financial market is going in the future, what we perhaps find difficult to understand, as time has seen with the invention of boats, trains, planes, automobiles, telephones, the internet and now AI, is…
How these inventions that are designed to transport us, products or information at a speedier pace, take the human universe to the “next level” as they arrive through time.
This “Next level” for example in this case AI, has largely been responsible for propelling the S&P500 into a new stratosphere also with Nvidia along with a handful of others turning our everyday lives more robotic.
Let’s now look at Nvidia more specifically from a business point of view before moving to the charts to analyze a technical set up that can move this equity far northwards.
The world’s leading GPU maker is said to hold an 80% market share in the sector and has contributed heavily in the advancement of AI technology, leading the way above main competitors AMD and Intel.
The company’s last twelve months earnings alone have seen a 19.5% average beat and with AI effectively still in its infancy, we can assume that further earnings beats going forward are probable. The market awaits this upcoming set of numbers with bulls waiting to see if the recent high of $965 can be taken out with a huge third wave potentially awaiting should that happen.
It was put to me recently, that yes this stock has seen a 435% rise in the last 15 months, and it is well documented that AI is still in its infancy, so is this projected rise maybe priced in? The answer: It could well be, the issue is that you must have a rejection candle or candles at the top end of any bullish run, particularly on what are described as tangible timeframes like the monthly candles for gauging probability of a future price.
In this case, Nvidia has initiated a bullish/bearish picture, as we will examine in the chart below. Many months of bullish demand meeting slender selling, where price breaks above what appears like a picture of an “auction” and moves onwards to the next level.
Let’s move to the charts now and examine the technical path that Nvidia may be looking to take upwards.

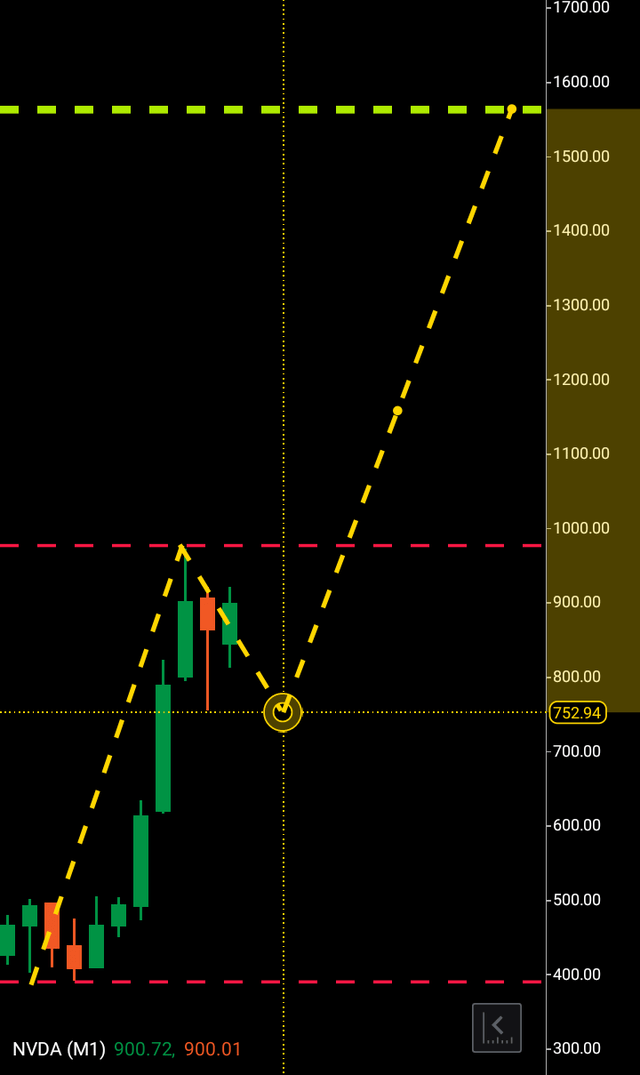
Nvidia Current Monthly Chart (C trader )
The low start point of this wave one can be seen at the $400 region, with the high sitting at $965. The wave two stretches from the latter to the $750 region, and we can clearly see the bullish vs bearish appetite on display. The wick heavy bearish rejection candle signifies decision rather than indecision, generally when a rejection candle particularly has more wick than body it suggests that there are a slim amount of sellers to be found during this time period and the demand and supply picture in this case is clear.
According to the Three Wave Theory, the third wave will look to numerically replicate the overall parameters of the wave one/two. If the price of a financial market moves in this case from $400 to $965 looking at the highest printable timeframe the monthly candle, before finding a price point where it is rejected, we can gauge that once the price gets driven above that rejected level it will look to again replicate that exact number in all probability before it is again rejected thus giving us an exact price target for the third wave breakout.
This potential third wave is primed to continue the bullish traction and break $965 launching the tech frontrunner to not far from double where it sits today.
So what can go wrong, is there a bearish case?
Geopolitical uncertainty, a competitor or competitors developing a product that may threaten Nvidia’s dominance or earnings that the market doesn’t like. There is a bearish case in play technically that could take Nvidia to $660 should $760 get broken, but this equity isn’t setting up for this scenario as we speak.
To finalize, I expect Nvidia to take out $965 and go looking for the $1600 region within the next 240-300 days. As usual, there are scenarios that $965 may be broken above and not go directly towards $1600, for example the stock may break higher only to retreat back into its wave structure before reattempting the assent to target as has been seen in many cases. As long as Nvidia stays above $400 and breaks resistance of $965, I believe a large wave of buying is set to take place.
Analyst’s Disclosure: I/we have no stock, option or similar derivative position in any of the companies mentioned, and no plans to initiate any such positions within the next 72 hours. I wrote this article myself, and it expresses my own opinions. I am not receiving compensation for it (other than from Seeking Alpha). I have no business relationship with any company whose stock is mentioned in this article.
Seeking Alpha’s Disclosure: Past performance is no guarantee of future results. No recommendation or advice is being given as to whether any investment is suitable for a particular investor. Any views or opinions expressed above may not reflect those of Seeking Alpha as a whole. Seeking Alpha is not a licensed securities dealer, broker or US investment adviser or investment bank. Our analysts are third party authors that include both professional investors and individual investors who may not be licensed or certified by any institute or regulatory body.
