Summary:
- NVIDIA Corporation’s stock price continues to rise, reaching a market cap of $3.1 trillion by June 21, 2024.
- A cautionary tale from Intel’s stagnant stock price post-2000 despite market dominance in microprocessors.
- Intel’s revenue and profitability were compressed by credible alternatives, even though it had a market share of 60-80% over the past two decades.
- A story similar to Intel’s could play out for Nvidia as AI chips’ revenue growth, profitability, and valuation multiples falter after the initial buzz and excitement wears off.
Tomasz Śmigla
NVIDIA Corporation (NASDAQ:NVDA) stock price continues to power ahead recently, with a market cap on June 21, 2024, of $3.1 trillion. I previously covered NVDA on April 22, 2024, and argued it was different from the other Magnificent Seven companies as it sold to corporates rather than individual customers and has much less customer captivity, which would diminish its long-term prospects. Since then, NVDA stock has gained 53% as its Q1 earnings release exceeded estimates in late May 2024. However, my outlook for NVDA remains unchanged, and today I discuss NVDA using the historical case of CPUs (which was not too long ago).
NVDA stock price (StockCharts.com)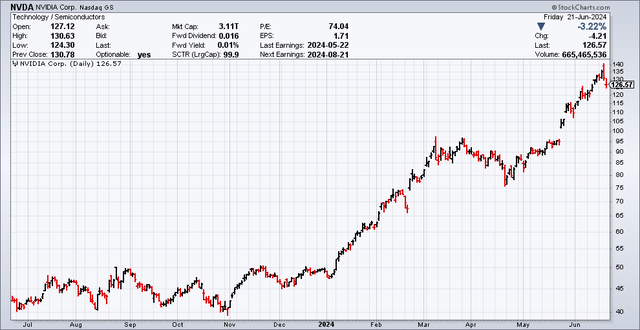
One reason NVDA bulls often state to support their bull case is NVDA’s domination in AI chips, which the bulls expect to continue for at least the next 3-5 years. The article discusses why this is an insufficient bull case at $3 trillion given the history of CPUs.
CPU Case Study: Intel Corporation’s (INTC) Chips to Riches to… Nowhere
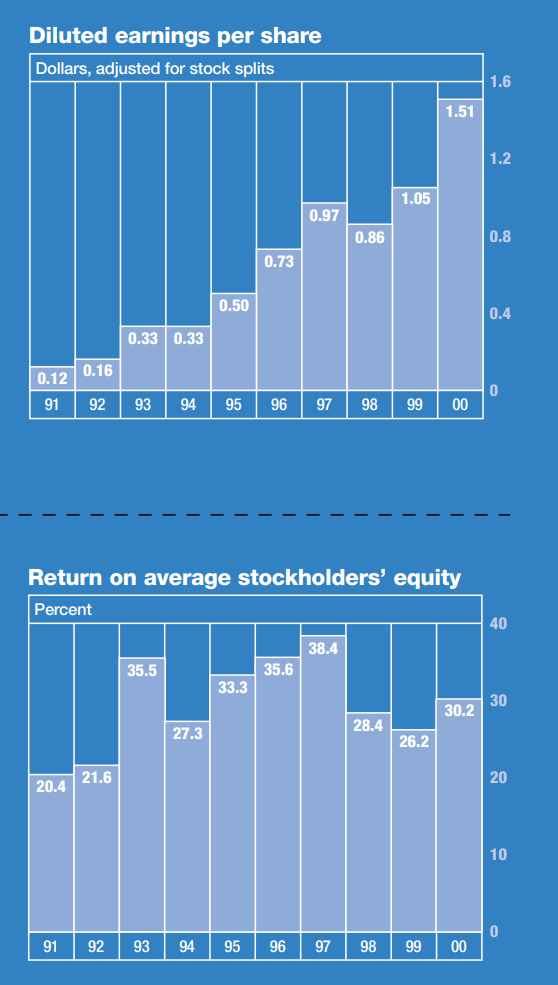
It was the year 2000, and Intel realized $33.7 billion in revenue, compared to $4.8 billion in 1991. Diluted EPS had grown to $1.51/share in 2000 from $0.12/share (an increase of 1,158%) and ROE was 30+% for most of the decade. Despite the Nasdaq dipping since March 2000, it can’t be that bad, can it? I can still remember the excitement of assembling my first PC in the 1990s (as well as the subsequent PCs). Connectivity, the Internet, and PCs, these were going to be the future, and in 2000 these were still in their nascence.
INTC 1991-2000 revenues (INTC annual report) INTC 1991-2000 EPS (INTC 2000 annual report)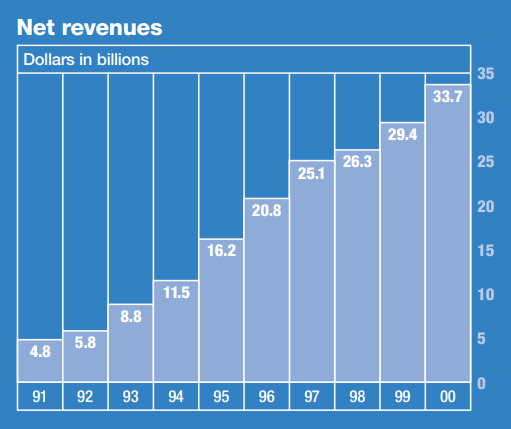
Yet, Intel’s stock price (split adjusted) never recovered (except for a brief period during the COVID-19 Everything Bubble where the price came close to 2000 peaks). Intel’s stock returns since 2000 were lackluster:
INTC stock price 1984 to present (Google Finance)
- At $31/share as of June 21, 2024, even if we set the extremely low bar of comparing against US CPI (which has roughly doubled since 1996), anyone who bought Intel stock above $15.5/share (which corresponds to anyone that invested after November 1996), would not even have beaten inflation, much less achieved returns anywhere close to broad market indices.
- If we set the bar at S&P returns (assuming dividends reinvested excluding inflation) of 7.22% per year since 1993, then you would’ve needed to buy Intel (also assuming dividends reinvested and excluding inflation) in 1993 at $3/share to achieve the same return of roughly 7.29% per year.
- This is quite remarkable: even if an investor was visionary enough to buy and hold Intel in 1993, he would’ve earned the same average market returns 30 years later. Buying anytime after 1993 would have led to below-market returns after 30 years. This is a testament to how competitive the market system is and how manias could price in future growth for decades to come.
- Intel has generated lackluster results for investors despite more or less maintaining over three decades a dominant position in microprocessors, which are arguably one of the key building blocks of the globalized economy. In fact, the only winners in this situation were those who bought early in the 1990s and sold for a profit before or after the dotcom bubble burst. Buying and holding Intel after the 2000s would have been a disappointment as the profits of the digital revolution shifted to other players such as Google, Apple and Microsoft and Intel could not extract more profits from its market dominance in microprocessors.
How did this happen? Let’s do a deeper dive into reasons why Intel’s stock went nowhere after 2000, as shown below:
- Intel’s net profits peaked in 2000: Net profits hit a high of $10.5 billion in 2000 and saw a stunning collapse to $1.3 billion in 2001. Though net profits subsequently recovered through the decade, they did not surpass the 2000 high until 2010 ($11.5 billion) and even 20 years later, Intel struggles to consistently deliver profits at or above 2000 levels.
- Intel’s profit margins peaked in the 1990s as well, achieving an average of 23.5% from 1991 to 2000, which fell to an average of 16.5% from 2000 to 2010 and only recovered to 21.7% from 2011 to 2022.
Intel net revenue, profits and margins 1991-2023 (annual reports, seeking alpha)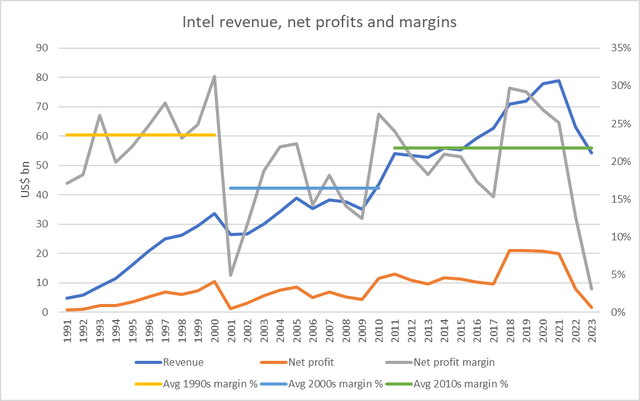
Why did profits level off and profitability decline?
- Revenue growth tapered off. By 2010, global PC shipments grew to 350 million, an increase of 150% versus 140 million in 2000, yet Intel revenues were only $43.6bn (29% increase versus 2000, a 10-year CAGR of 2.6%). If we look back at the annual reports from the early 2000s, lower average selling prices are often mentioned. It would appear that competition reduced average selling prices, and volume growth was only partially translated into revenue growth.
- More importantly, profit margins collapsed as a result of the stagnant revenue growth and increased competition (including price and otherwise). Despite retaining its overall market dominance in the microprocessor market with a market share of 60-80% over the past two decades as shown below, competition from Advanced Micro Devices, Inc. (AMD), etc. was effective enough to cap its margins.
Intel and AMD market share (Yahoo Finance)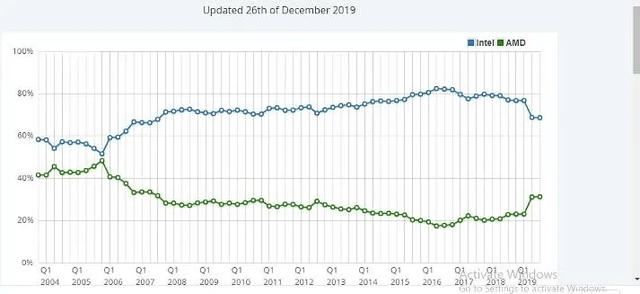
This case study is very instructive for NVDA: even if NVDA retains an 80% market share like Intel did, it could still face revenue growth and profit margin pressures if credible competitors provide alternatives that decrease revenue growth (through lower unit prices offsetting volume growth) and decreased margins.
Now, some readers may say that Intel historically operated using a different model (IDM) than NVDA (fabless). This is true. However, I think the differences are not as great as it appears on the surface and the similarities make the comparison worthwhile:
- Intel and Nvidia both primarily sell to corporate customers rather than to individual customers. As I analyzed in my previous article, this means they benefit much less from customer captivity as they are not selling to individual customers that are habitual and do not fuss over pennies and dimes but rather to corporate customers that are interested in cutting/controlling costs from vendors through developing alternatives etc.
- Intel ultimately benefited very little incrementally from the internet boom in the 2000s and 2010s, as the profits accrued to the companies which provided the mass market with applications. Compared with the hundreds of billions of dollars earned each year by the Magnificent Seven, Intel on average earned $13.6bn each year in the past decade from 2014 to 2023, corresponding to a market cap that is roughly 10x ten-year average earnings.
- Though the “Wintel” alliance initially helped PC market growth, Microsoft sped on to become a giant behemoth, leaving Intel languishing behind. This could be a similar case for AI: AI applications that provide solutions to large corporations and the public eventually earn big money, while AI chips become just another commodity. Intel was exciting in 1999 when I unwrapped a new computer, by now we take Intel products for granted. While NVDA’s product announcements are met with much attention and fanfare, are the same people paying attention to NVDA’s product rollouts even aware of what Intel’s latest products are? I would guess, barring a few semiconductor sector analysts, the public and investors are not too aware of (or care too much) what’s going on at Intel. Intel microprocessors probably improved tremendously since 1999 but Intel’s P/S is a measly 2-3x after the initial buzz and novelty wore off, this could be NVDA’s fate as well.
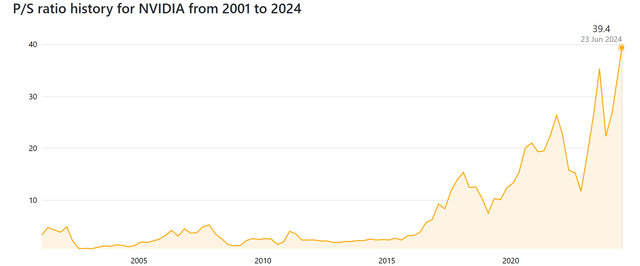
Once revenue growth flattens out and margins revert to a lower level of what they used to be, the stock price reacts. In most of the 2000s, Intel traded at mid-single digit P/S and trended lower. In the past decade, Intel’s P/S has mostly revolved around 2-3. Overlay this to NVDA, even if it achieves the $200bn revenue forecast by analysts, and P/S falls to 4-5 after the aura falls off, the market cap could fall to $1 trillion. If the P/S falls to 2-3 (which is where Nvidia historically traded before zooming up to current levels) NVDA might just be worth several hundred billion dollars.
P/S ratio history for INTC from 2001 to 2024 (CompaniesMarketCap) P/S ratio history for NVDA from 2001 to 2024 (CompaniesMarketCap)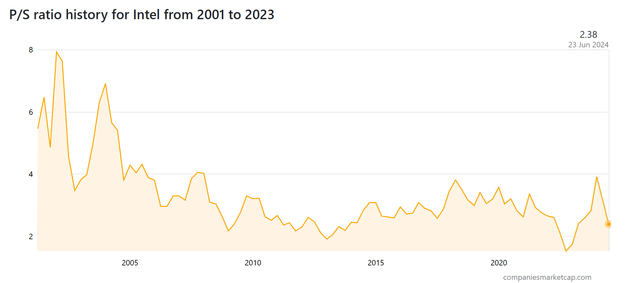
Risks to bear case:
It could be possible that NVDA’s technology lead is sustained and maintains its elevated margins and revenue growth that meets and even surpasses analysts’ expectations for years to come and drives its market cap/stock price even higher.
NVDA stock price has increased substantially (+53%) since my previous bearish article on it. It’s definitely possible it could continue powering ahead, and I still would not advocate shorting this stock (one never knows how long or high these prices can go), which is consistent with my previous view not to short this stock but also not to put substantial funds that one cannot afford to lose in a long position as well.
Conclusion:
I believe Intel is a cautionary and relevant case study for investors in NVDA. Investors that bought Intel in the early to mid-1990s would have walked away with a profit, anyone who bought after the mid-1990s and held until the present day would have achieved returns below market as (1)revenue growth and profit margins were compressed by competition, despite Intel maintaining a 60-80% market share in microprocessors and (2) the stock price had already priced in huge subsequent growth in microprocessors from PCs etc. and valuation multiples continuously declined as the buzz around microprocessors faded.
Therefore, I still see a long-term market cap for NVDA of several hundred billion dollars (but definitely not $3 trillion) and am bearish on the current valuation ($3.1 trillion as of June 21, 2024). Investors that are investing money they cannot afford to lose (e.g., retirement savings) should be careful with NVDA, or at least consider keeping risk exposure to a manageable level.
Analyst’s Disclosure: I/we have no stock, option or similar derivative position in any of the companies mentioned, and no plans to initiate any such positions within the next 72 hours. I wrote this article myself, and it expresses my own opinions. I am not receiving compensation for it (other than from Seeking Alpha). I have no business relationship with any company whose stock is mentioned in this article.
Seeking Alpha’s Disclosure: Past performance is no guarantee of future results. No recommendation or advice is being given as to whether any investment is suitable for a particular investor. Any views or opinions expressed above may not reflect those of Seeking Alpha as a whole. Seeking Alpha is not a licensed securities dealer, broker or US investment adviser or investment bank. Our analysts are third party authors that include both professional investors and individual investors who may not be licensed or certified by any institute or regulatory body.
