Summary:
- Nvidia Corporation remains a buy due to its strong uptrend across all time frames, supported by robust technical indicators and moving averages showing bullish momentum.
- Despite some caution from MACD and RSI divergence, Nvidia’s fundamentals are strong, with record revenues, EPS growth, and significant share buybacks.
- Valuation multiples are historically low, making Nvidia undervalued given its extraordinary growth from AI tailwinds and the potential boost from Blackwell.
- Nvidia’s technical and fundamental analyses converge to a positive outlook, suggesting NVDA stock has a long runway ahead and is set to reach new highs.
Antonio Bordunovi
Thesis
Nvidia Corporation (NASDAQ:NVDA) has been in the spotlight for the past few years, and rightly so. The company has become the face of the AI boom, as its GPUs have become one of the hottest tech commodities of all time. Along with the business boom, the stock has surged and has recently hit a new intraday high.
From my technical analysis below, I determine that Nvidia’s stock still has room to run, as the uptrend in all time frames remains highly intact. In addition, a look at its fundamentals shows that the stock is in fact very cheaply valued, as valuation multiples are at relatively low levels while growth remains strong. During recent times, many investors and analysts have been looking for Phase II AI plays, stocks that will benefit as the AI boom matures. In my view, Nvidia remains the gold standard and will continue to dominate even as we enter the so-called Phase II of AI. Therefore, I initiate Nvidia at a buy rating.
Daily Analysis
Chart Analysis
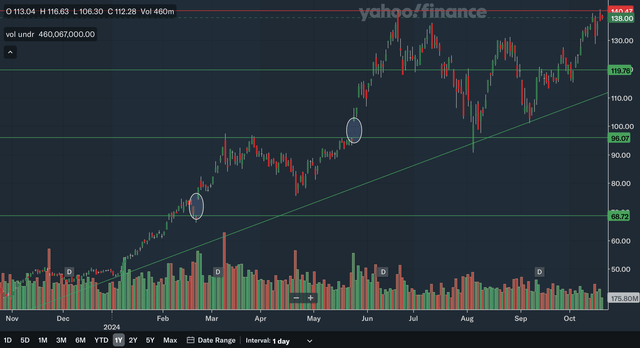
The daily chart shows that Nvidia is in a strong near term technical position. However, it hit a new intraday high very recently but was unable to close at a record high as there is a bit of resistance at around 140, the high set in June. Other than that, there is no other resistance to speak of. For support, the nearest level would be at around 120 since that area was both support or resistance multiple times since June of this year. The next level down would be the uptrend line currently at around 110 that stretches back to the start of the year and is quickly sloping upward. There should also be support at the two gaps that I have circled, in the mid-90s and in the high 60s. Overall, I believe it is clear that Nvidia remains in a strong short-term uptrend, with much more support below than resistance above.
Moving Average Analysis
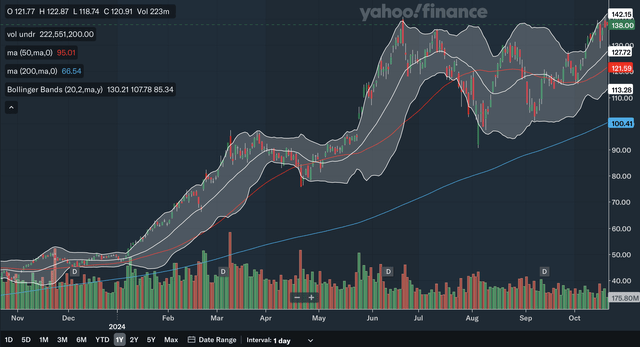
There have been no crossovers of the 50-day SMA and the 200-day SMA in the past year. The 50-day SMA has remained above the 200-day SMA for the entire time. After the gap between the two MAs narrowed from August to the end of September, it is starting to widen again, showing the resurgence of bullish momentum lately. The stock currently trades at a moderate level above the MAs as it is more than 10% above the 50-day SMA. For the Bollinger Bands, the stock is quite near the upper band, showing that it may be potentially overbought in the near term. However, as you can see, during the bull run early this year, the stock can remain at the upper band for extended periods despite it being a bit overbought. After breaking above the Bollinger Bands’ 20 day midline in early September, the stock has since remained above the midline and the line acted as support earlier this month. Since the midline is supposed to act as support in an uptrend, it is important to see that the stock is bouncing off this support level. From my analysis, I believe the MAs show that Nvidia is in a strong near term technical position.
Indicator Analysis
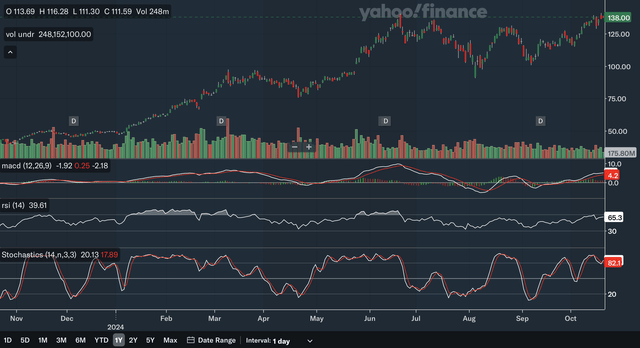
For the MACD, currently the line is above the signal line, which is a bullish signal. The gap has narrowed as of late, showing perhaps a bit of decreased bullish momentum currently. There is a slightly worrying negative divergence signal with the MACD since the stock is at all-time highs, but the MACD is significantly lower than it was during the June peak. The RSI also shows this negative divergence, as it is also below the June peak. Currently, the RSI is in the mid-60s, showing that it is not overbought despite the recent run-up. Lastly, for the stochastics, the %K line just crossed above the %D line, which is a bullish signal despite the crossover taking place in the overbought 80 zones. In my view, investors should show some caution as there is some potential concern with the negative divergence in the MACD and RSI indicators but in the nearer time frame, the indicators remain bullish.
Takeaway
The overall short-term technical picture for Nvidia is a bright one. Despite some potential red flags in the MACD and RSI, Nvidia remains in a strong uptrend, as demonstrated by both the chart and the MAs. In fact, as shown by the MAs, there is a near term resurgence in bullish momentum as the 50-day SMA pulls away from the 200-day SMA.
Weekly Analysis
Chart Analysis
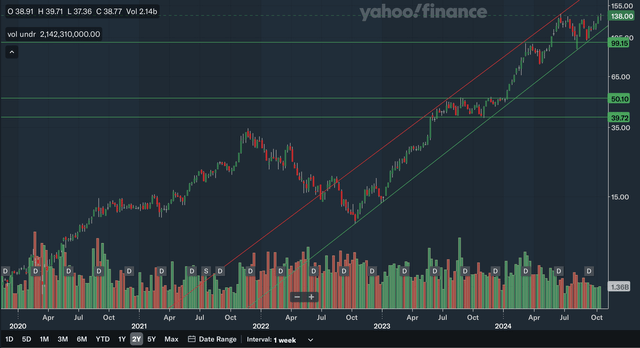
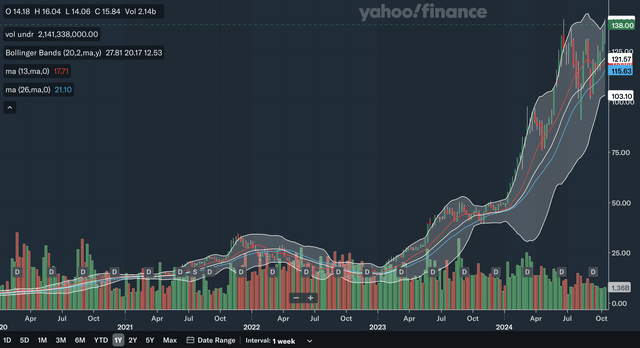
Note that this chart is on a logarithmic scale to better reflect Nvidia’s intermediate term trend. As you can see above, there is minimal resistance for Nvidia in the intermediate term. The only potential resistance would the upper channel line, but it is quickly sloping upward, and the stock can experience healthy gains even if it were to remain below that line. The nearest level of support would be the lower channel line. This line dates all the way back to 2022 and has been solid support on multiple occasions. Moving down, we have support at around the psychologically important 100 zone. That level was resistance in early 2024 and support in the middle of the year. Although they are miles down due to the log scale, we also have support at around 40 and 50 as that area was a significant trading range in 2023. From my analysis, it is clear that Nvidia is in a strong intermediate uptrend with minimal resistance above.
Moving Average Analysis
Since the bullish crossover of the 13-week SMA and the 26-week SMA back in late 2022, there has been no further crossovers. The stock has exploded since that signal. While the two MAs are currently relatively close together, the 13-week SMA looks like it is regaining momentum, showing the bull trend is continuing. The stock is currently quite far above both of the MAs. As for the Bollinger Bands, the stock is at the upper band, showing it could be overbought in the intermediate term. As stated in the daily analysis, the stock has had a history of remaining at the upper band for extended periods during its strongest runs, so don’t be surprised if it did the same here. The 20-week midline is above both of the SMAs and would be the nearest MA support for Nvidia at around 120. Overall, I believe the MAs show that the uptrend for Nvidia is still a healthy one as the 13-week SMA’s trajectory reaccelerates.
Indicator Analysis
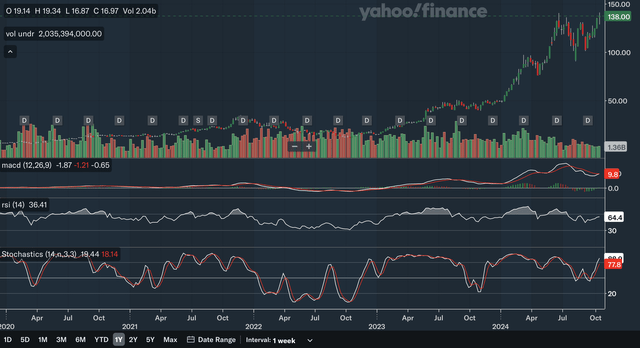
The MACD just crossed above the signal line, flashing a bullish signal. This is the first crossover since the bearish crossover back in the middle of the year. Similar to the daily analysis, the MACD here also shows the negative divergence as the current MACD reading is well below the levels in the middle of the year while the stock is back to its all-time highs. For the RSI, it is a similar story, as the current reading is also well below levels seen earlier this year. The RSI is in the mid-60s like in the daily analysis, indicating it is not overbought despite the recent surge. Lastly, for the stochastics, the %K line is currently a large margin above the %D which is bullish, and it looks like the gap is still expanding reflecting strong bullish momentum. From my analysis, the intermediate term indicators show a similar story to the near term indicators as once again there are nearer term bullish signals but also some longer term potentially concerning negative divergence.
Takeaway
The intermediate term technical outlook is also a bright one for Nvidia. The analysis has been very similar to the daily analysis in that the charts show that the uptrend remains intact, the MAs show the resurgence in bullish momentum, and the indicators show a more mixed outlook. Despite some caution deserved from the MACD and RSI’s divergence signals, Nvidia’s overall intermediate technical position is strong.
Monthly Analysis
Chart Analysis
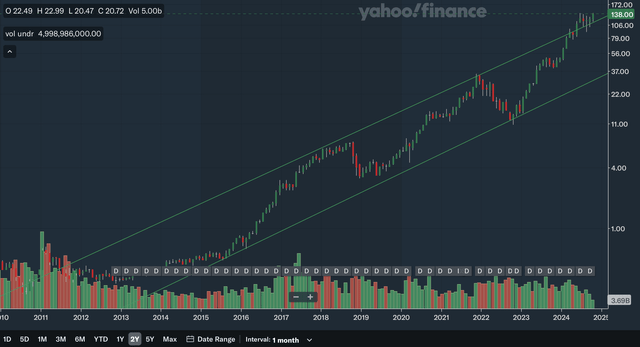
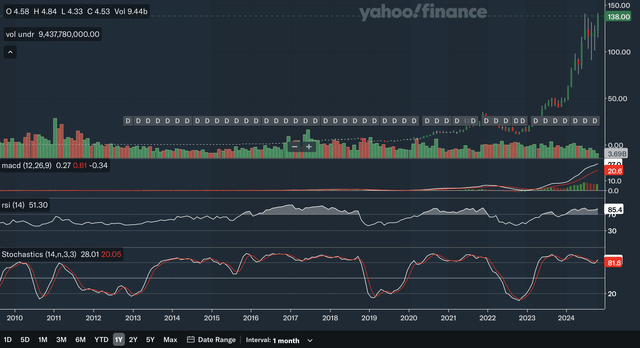
Note that the above chart is in also on a logarithmic scale to better show the long-term trend for the stock. As you can see above, Nvidia is not just in a long-term uptrend, it is accelerating its long-term uptrend. The two channel lines drawn above date back to 2015 and the stock has remained bound in this channel for the past decade. The stock has recently broken out of the upper channel line, signalling that the long-term uptrend is accelerating. However, as you can see, the breakout did not occur on overwhelming volume and so there is still some potential that this was a false breakout.
But nonetheless, the long-term bull run for Nvidia has no signs of ending any time soon. The two channel lines should act as support, with the upper channel line’s support very close to current levels.
Moving Average Analysis
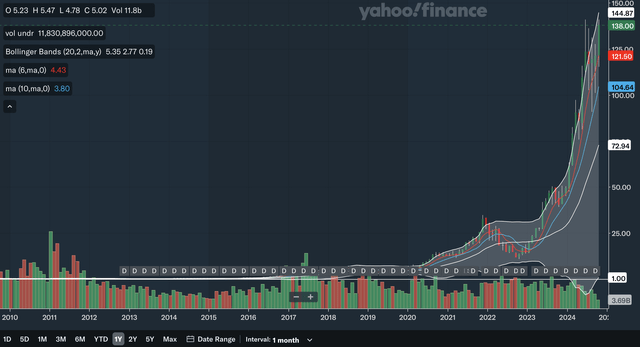
The 6-month SMA and the 10-month SMA have not had a crossover since the bullish crossover back in early 2023. The stock has surged to say the least since that signal. The 6-month SMA is currently a healthy margin above the 10-month SMA and has no signs of slowing down. The stock is currently trading above the MAs with the 6-month SMA’s support relatively near as it is at the current month candle’s base.
For the Bollinger Bands, the stock is nearing the upper band. This shows it could be close to being overbought, but as you can see, Nvidia, throughout the years, has had many occasions where its momentum brought the stock even above the upper band. Being in the upper band is nothing new for Nvidia stock. Overall, once again, I believe this analysis demonstrates that Nvidia’s relentless long-term uptrend has no signs of ending.
Indicator Analysis
Since a bullish crossover in early 2023, the MACD has remained above the signal line and currently, the MACD is reaccelerating away from the signal line reflecting the latest surge in bullish momentum. Unlike the daily and weekly analysis, here we have no negative divergence with the MACD as it has kept making new highs during this year. For the RSI, the current reading is in the mid-80s, an overbought signal. However, as you can see, Nvidia remained overbought from 2016 all the way to 2019. Nvidia is no stranger to overbought levels, and I believe it could remain this way for years to come. There is some minor divergence with the RSI, as it is currently below higher levels set earlier in the year.
Lastly, for the stochastics, the %K just crossed above the %D very recently, another bullish signal. In addition, the stochastics has generally remained above the 80 overbought level since early 2023, showing that Nvidia has sustained upward momentum. Overall, from my analysis, the indicators reflect a net positive long-term outlook for Nvidia as the MACD confirms the uptrend.
Takeaway
All three of the long-term analyses show a positive technical outlook for Nvidia. The chart shows that the uptrend for the stock is not just continuing, it is accelerating. In addition, the moving averages show the uptrend remains healthy. Lastly, the long-term indicators are even better than weekly and daily indicators, as the key MACD indicator confirms the recent surge to be valid.
Fundamentals & Valuation
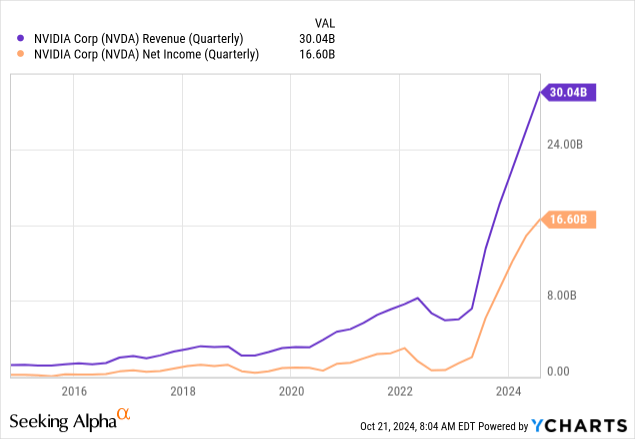
Nvidia’s next earnings report is estimated to be released on November 19th. On August 28th, Nvidia reported their FY2025 Q2 earnings. They reported record revenue of $30.0 billion, up 122% YoY. Specifically for their Data Center division, the posted record revenues of $26.3 billion, a 154% increase from the year ago period. As for EPS, they released an adjusted figure of $0.68, an increase of 152% YoY. Both revenue and EPS beat expectations, with revenue beating by $1.29 billion and EPS beating by $0.04. Other highlights in their earnings report include the fact that Nvidia had $15.4 billion in buybacks/dividends in the FY2025 H1 and the approval of an additional $50.0 billion in share repurchases on August 26th. In my view, there is no doubt that Nvidia’s earnings remain strong, with robust growth rates and healthy beats.
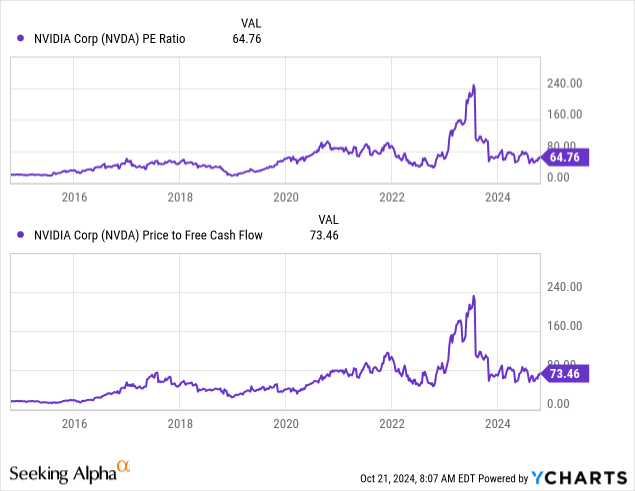
The P/E and P/FCF ratios show that Nvidia is actually fairly cheaply valued, despite the stock being at all-time highs. Both of the multiples have dropped significantly from the peaks in 2023. The P/E ratio is currently in the mid-60s, after being over 240 in 2023. As for the P/FCF ratio, it is currently at 73 after nearing 240 in 2023 as well. Both of multiples are relatively low historically. For example, the P/E is currently below levels seen during 2021 in the pandemic era. While there was a boost in Nvidia’s gaming business during the pandemic, tailwinds were nowhere near as strong as they are right now with AI.
As you can see in the revenue and EPS chart above, the growth for Nvidia has been extraordinary since the AI boom started. Although growth has slowed a bit, it remains at healthy figures. Blackwell could also help Nvidia to accelerate growth. Therefore, I believe Nvidia is undervalued at current levels. Combining a historically cheap valuation with once-in-a-lifetime AI tailwinds and strong financials should be a great combo for Nvidia stock. While some investors may be concerned that the stock may be stretched as it hits all-time highs, the charts above say otherwise.
Conclusion
The technical analyses and fundamentals converge to the conclusion that Nvidia stock likely has a long runway ahead and is set to surge to new highs. Despite talks of potential Phase II AI stocks taking the spotlight from Nvidia, from the technical analysis above, I have determined that Nvidia is in a strong uptrend in all time frames. The moving averages show a recent resurgence of bullish momentum. Although there should be some caution as the MACD and RSI show divergence in the short and intermediate terms, the indicators are net positive with an abundance of nearer term bullish signals.
As for the fundamentals, as discussed above, the valuation is very cheap considering the strong AI tailwinds, robust financial growth, and Blackwell’s early successes. Therefore, after an evaluation of both the technicals and fundamentals, I believe Nvidia’s stock is a buy.
Analyst’s Disclosure: I/we have no stock, option or similar derivative position in any of the companies mentioned, and no plans to initiate any such positions within the next 72 hours. I wrote this article myself, and it expresses my own opinions. I am not receiving compensation for it (other than from Seeking Alpha). I have no business relationship with any company whose stock is mentioned in this article.
Seeking Alpha’s Disclosure: Past performance is no guarantee of future results. No recommendation or advice is being given as to whether any investment is suitable for a particular investor. Any views or opinions expressed above may not reflect those of Seeking Alpha as a whole. Seeking Alpha is not a licensed securities dealer, broker or US investment adviser or investment bank. Our analysts are third party authors that include both professional investors and individual investors who may not be licensed or certified by any institute or regulatory body.

