Summary:
- It is almost common knowledge for cyclical stocks, P/E ratios always lead business fundamentals.
- And, historically, the lead has been about 3-6 months for Nvidia Corporation until now.
- What is happening now with Nvidia is alarming, in my view.
- Its business fundamentals are currently going through the worst of the contraction phase and inventories are off the chart.
- Yet, the P/E ratio is at a record peak, indicating that sentiment is too ahead of the fundamentals at this point.
E_Y_E
Thesis
Investors are always trying to outsmart the market (or each other). And this is best illustrated by the forward-looking nature of the P/E ratio, especially for a highly cyclical stock like Nvidia Corporation (NASDAQ:NVDA). As you can see from the following chart, the P/E valuation (bottom panel) had always led the business fundamentals (the top panel measured by revenue growth) by about 3~6 months in the past cycles. Take its most expansion cycle between 2019 and 2021 as an example. As seen, NVDA’s P/E ratio peaked (around 100x!) in late 2020, while its growth did not peak in early 2021 (a spectacular 80% QoQ growth).
If all of the above is common knowledge for experienced investors, then what is happening now is a bit puzzling – and alarming in my view. As seen, NVDA’s stock is currently experiencing the worst contraction in the downward phase of its business cycle. Yet the P/E ratio is at a record peak. Admittedly, whether its P/E is indeed 162x as E quoted in the chart is debatable (and I will revisit this point later). Nonetheless, such a wide gap between its business fundamentals and P/E multiple is alarming.
In the remainder of this article, I will dive into a more detailed analysis to assess the state of the chip cycle for NVDA. And my overall conclusion is to recommend existing investors consider selling, and potential investors stay on the sideline.
Author based on Seeking Alpha data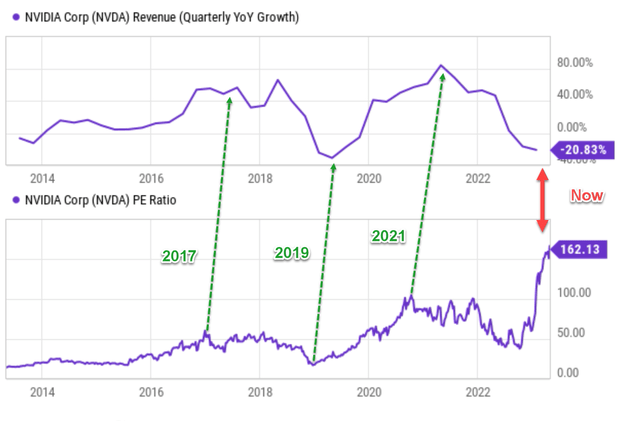
NVDA: The state of the cycle
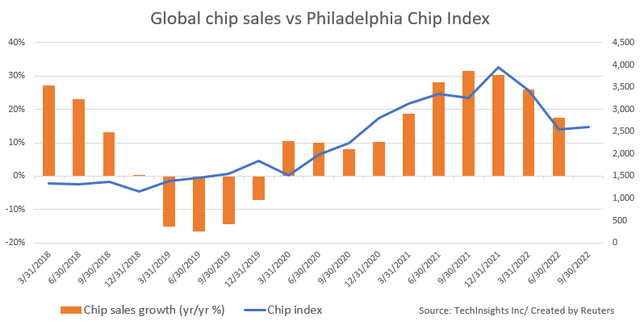
A few months ago (in July 2022), a Reuters report described a “toilet hoarding” problem for the chip industry. Quote:
Computer chips face toilet paper hoarding moment as shortage turns to glut. A supply chain crisis triggered by the global pandemic deprived makers of PCs and smartphones to cars of computer chips needed to make their products. All that suddenly changed over three weeks from late May to June, as high inflation, China’s latest COVID lockdown, and the war in Ukraine dampened consumer spending, especially on PCs and smartphones. Chip shortages turned into a glut in some sectors, taking Wall Street by surprise.
And the report in particular called out NVDA (and Micron (MU), too) as two good examples for such hoarding issues, just like the way Procter & Gamble (PG) and Kimberly-Clark (KMB) overstocked toilet papers during the peak of the COVID pandemic.
Based on what has developed in the past few months since this report, Reuters’ predictions are overall correct but a bit premature. Timing the market is simply impractical and fortunately unnecessary. As you can see from the following chart, chip sales growth remained positive for another 1 or 2 quarters for NVDA (and also other close peers like AMD). However, the report captured the spirit of the problem. Growth nosedived shortly afterward and currently, NVDA is suffering from a 20.8% QoQ sales contraction, the worst levels experienced in its past few cycles as seen.
Author based on Seeking Alpha data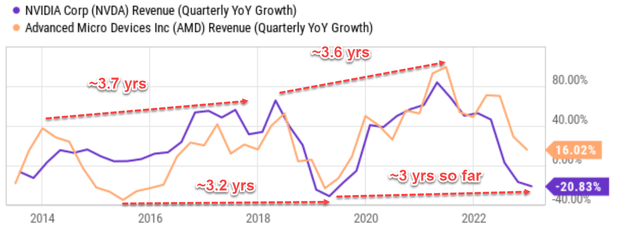
The worst is not over yet
Despite the contraction, investors are already bidding up the stock price to elevated valuations as aforementioned. In my opinion, such bullish sentiment can only come from two possible sources. First, investors are betting that the contraction has reached its bottom already and a recovery is imminent. Second, investors believe that the company has identified other high-growth fronts (such as AI) to break the current contraction phase.
My thoughts on the second possibility (the AI potential) have been detailed in another article (and my overall feeling is that the excitement is a bit premature at this stage). And in this article, I will focus on the first issue and explain why I don’t think the worst moment of the ongoing contraction is over yet.
The next chart examines the inventories, which, in my opinion, provide the clearest indication of the cycle’s status for several reasons. I’m including data for both NVDA and ADM to show both NVDA’s status and also the general status in the sector. The market must absorb the current inventory holdings, both at NVDA and with other competitors.
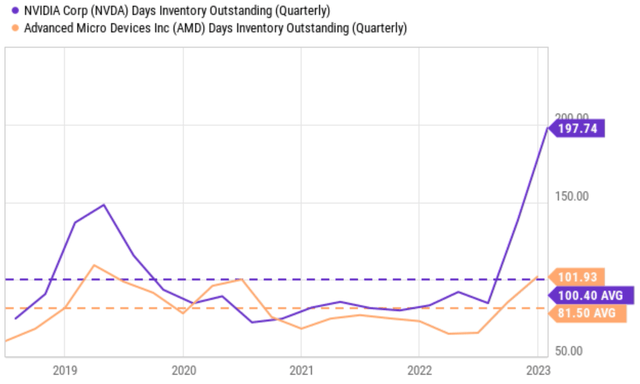
To wit, the chart below depicts NVDA and AMD’s inventory level in terms of days of inventory outstanding (“DOIO”). As observed from the top panel, NVDA’s DOIO has fluctuated between about 80 days to 100 days over the past years, with an average of 102 days. Its current DOIO is just completely off the chart at 198 days, almost double its average. And bear in mind that the 102 days of average itself is biased substantially by the recent inventory hoarding. The picture for AMD (and other chip players) is similar, although not as extreme as NVDA. As seen, AMD’s current DOIO hovers around 102 days, also substantially above its historical average and also near a peak leave since 2018.
Given the magnitude of the inventory build-up, as shown, both NVDA will need more time to clear its hoarding, and very possibly at a discounted price given the relatively high inventory in the sector. At the same time, the macroeconomic condition is so uncertain, and demand could remain soft. Softened demand and overstocking are always an unfortunate combination.
Other risks and final thoughts
There are both upside and downside risks to my above thesis. And as one of the most popular stocks on Seeking Alpha, both risks have been the topic of hot debate in many other articles. As such, here I will point out two risks that are specific to the analyses in this article.
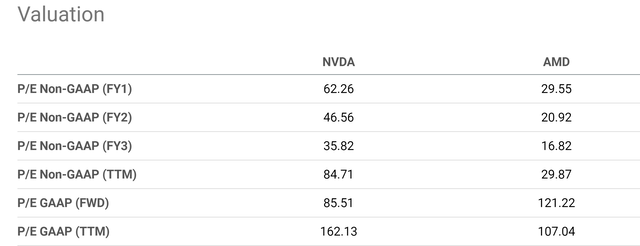
First, the uncertainty in the Nvidia Corporation P/E multiple. As aforementioned, whether its P/E is indeed 162x as quoted in the opening chart is debatable. As seen in the next chart, the P/E ratios quoted for NVDA vary in a wide range depending on the sources you use, the accounting methods you use, and also the EPS projection you use. Such uncertainty could imply there are upside risks that the market has not recognized yet in terms of its earning potential.
But in my view, its P/E multiple is undoubtedly elevated no matter how you slice and dice these numbers – both in absolute and relative terms. In absolute terms, its P/E should be close to a triple-digit multiple, if not at or above already. In relative terms, as you can see, its valuation premium is more than 100% by many of these metrics.
To conclude, historically, chip cycles lasted for about 3.5 years (either peak-to-peak or bottom-to-bottom). I do not see why the current downturn should be an exception with the peak inventory build-up both at NVDA and other chip players. The current contraction has only lasted for ~3 years, and it could easily take NVDA another 1 or 2 quarters to just clear its existing inventory, assuming the overall economy does not worsen. Hence, I view the wide gap between its current P/E and growth (i.e., contraction) as very alarming. My assessment is that the sentiment is too ahead of the fundamentals at this point.
Analyst’s Disclosure: I/we have no stock, option or similar derivative position in any of the companies mentioned, and no plans to initiate any such positions within the next 72 hours. I wrote this article myself, and it expresses my own opinions. I am not receiving compensation for it (other than from Seeking Alpha). I have no business relationship with any company whose stock is mentioned in this article.
Seeking Alpha’s Disclosure: Past performance is no guarantee of future results. No recommendation or advice is being given as to whether any investment is suitable for a particular investor. Any views or opinions expressed above may not reflect those of Seeking Alpha as a whole. Seeking Alpha is not a licensed securities dealer, broker or US investment adviser or investment bank. Our analysts are third party authors that include both professional investors and individual investors who may not be licensed or certified by any institute or regulatory body.
As you can tell, our core style is to provide actionable and unambiguous ideas from our independent research. If your share this investment style, check out Envision Early Retirement. It provides at least 1x in-depth articles per week on such ideas.
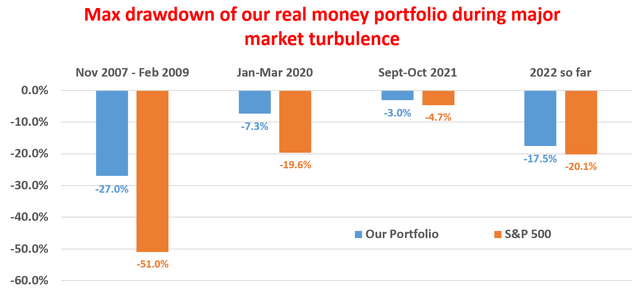
We have helped our members not only to beat S&P 500 but also avoid heavy drawdowns despite the extreme volatilities in BOTH the equity AND bond market.
Join for a 100% Risk-Free trial and see if our proven method can help you too.
