Summary:
- Despite current Red Zone caution, other technical tools indicate higher prices for Nvidia Corporation, with a price target of $192 by March.
- Because prices are against the upper, long-term Bollinger Band, investors should expect a gradual advance and not a sudden price surge.
- The long-term RSI shows bullish relative strength, with a current RSI at 47.5, indicating no intermediate-term correction for now.
- It’s an important principle that if a second price movement is larger than the first, it will last at least the same amount of time. That would be March.
Antonio Bordunovi
Technical analysis can’t tell you “what” to buy or sell, but it can help you determine “when” to buy or sell it.
The indicators we follow suggest higher prices for Nvidia Corporation (NASDAQ:NVDA) over the coming months, and we have a possible price target of $192 by January for those who already own it.
Investor Expectations For Nvidia Are “Extremely Bullish”
It’s a truism that you want to avoid a stock when “too many” investors believe it’s headed higher, and become interested when “too many” think it is headed lower. The chart below is a technical tool to help investors do this.
Red Zone readings occur when the vast number of investors are bullish, while Green Zone readings show when “too many” are bearish.
Measuring investor expectations is the missing ingredient in most technical analysis and is what sets us apart. When “too many” investors have the same expectation, the opposite usually happens. The term “indicators of investor expectations” was coined by Marty Zweig in the 1970s. To discover what investors expect he compared their buying of “put” and “call” option contracts. At the Sentiment King we compare how much “money” is going into ‘directed’ put options versus how much is going into ‘directed’ call options. We only use “directed options,” which are options purchased with a price direction in mind, versus hedging or income option purchases. This is not a short-term indicator. Ratios are calculated over 20 days to obtain long-term expectations. The Green Zone represents extreme bearish expectations while the Red Zone represents extreme bullish expectations. (The Sentiment King)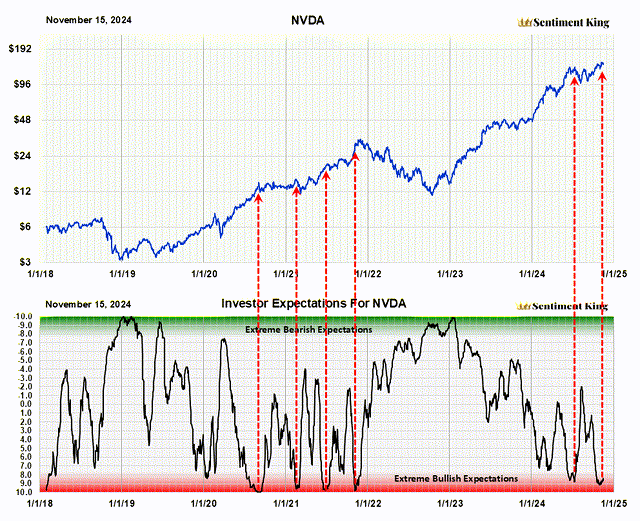
In the last 6 1/2 years, there have been four Green Zone readings and six Red Zone readings, including the current one. As you can see, all Green Zone readings were strong, long-term buying opportunities.
Red Zone readings usually imply caution. The six Red Zone readings occurred just before some type of time or price correction. Most corrections lasted a few months; one turned into the 2022 bear market.
If this were the only indicator we were using for Nvidia, we would be very cautious at this point. But it’s not. While we’re expecting a major decline in Nvidia in 2025, we believe the current two-year bull market in Nvidia will continue at least through February, possibly March. That forecast is based on two other indicators we’ll explain later in the article.
So for now, we’re setting aside this Red Zone reading in Nvidia. We think there will be another reading in a few months when other technical indicators aren’t so positive.
While we expect higher prices over the intermediate term, investors should not expect the advance to be as strong as the last year or two.
Bollinger Bands Show Stock Has Somewhat Restricted Upside Movement
Another way to look at price excesses in Nvidia stock is by using Bollinger bands. They show how far prices have advanced beyond the norm.
This next chart shows that the current price of Nvidia is sitting just below the top Bollinger band, which is 2.25 times standard deviation. The price can rise along with this line, but it seldom penetrates it, at least by much. Being at this extreme limits the potential gain.
It’s always best to start a major advance with the price touching the lower green line, which is 2.25 standard deviations below the average. This allows for maximum gain. Simply put, prices are already extended upward but isn’t a major impediment to moving higher. It just restricts expectations.
Bollinger Bands are a popular technical tool used by traders and investors to assess if a stock is overpriced or undervalued. They were created in the 1980s by financial expert John Bollinger. A simple moving average is calculated that represents the trend of interest; in our case we use a 100 day average. Then the standard deviation over the same period is calculated and upper and lower bands are placed above and below this moving average that represent a specific number of standard deviations. In our case we use two. Because the distance of the bands is based on standard deviation over 100 days, they expand and contract with price volatility. This means that, in volatile markets, support and resistance occurs at higher or lower levels than in less volatile markets. (The Sentiment King)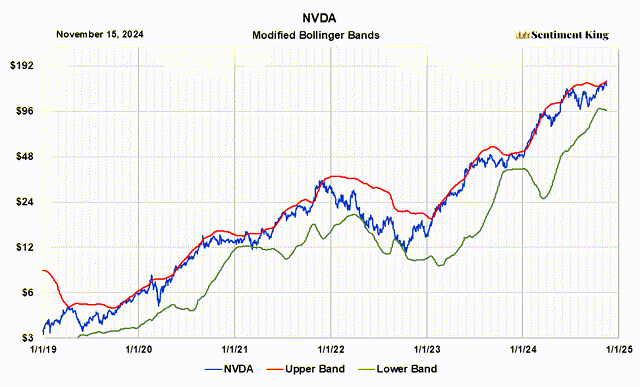
Nvidia’s Long-Term Relative Strength Is Bullish
This next chart shows the long-term RSI index for Nvidia. We calculate our RSI indicator to measure relative strength over the long term; this is not a short-term metric.
It shows that after a three-month advance, the relative strength of NVDA has gone below 50. If you carefully look at the chart, you’ll see the price advancing while the red line has been declining. This is highly unusual and a positive signal. A relative strength reading of 45 or lower has usually signaled a strong, intermediate term buy signal. It’s currently 47.5, which we circled in black.
We cannot imagine an intermediate term correction beginning from an RSI reading of 47.5. It’s going to take higher prices, and more time, to change this before we’re technically ready to start a major correction. We’ve indicated this with black arrows. It shows that intermediate-term price peaks typically occur at RSI readings of 58 or higher. It will take both time and higher prices to change our RSI indicator to a sell signal.
The relative strength index (RSI) was developed by J. Welles Wilder Jr. and introduced in his 1978 book, “New Concepts in Technical Trading Systems.” It is probably the most popular momentum indicator used in technical analysis. The RSI measures the speed and magnitude of recent price changes in a stock to evaluate if it’s been oversold or overbought. It has adjustable parameters that allow you to measure these conditions for either the short or long term. We’ve adjusted the RSI parameter in our graph to show the long-term picture. (The Sentiment King)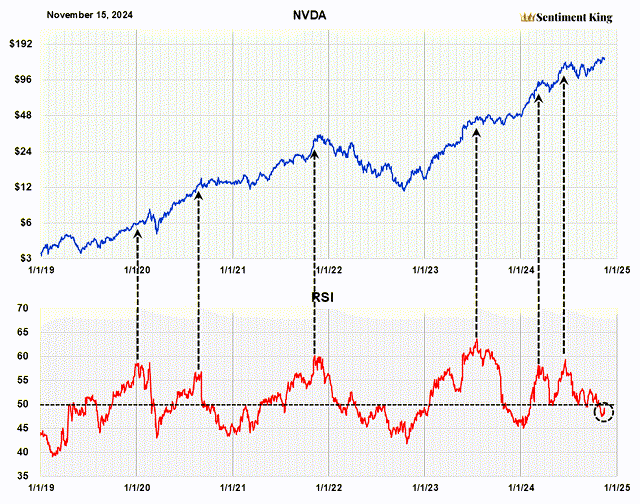
Trend Channels and Equal Time Movement Provide Nvidia With More Time and Upside
The chart below shows Nvidia stock since 2019, and we’ve drawn two trend channels. The lower channel represents support for Nvidia over the intermediate to long-term; the upper channel represents resistance.
We also drew two rectangles. They are of equal width, meaning they span the same amount of time. The second rectangle is higher than the first because the second price movement in Nvidia, percentage wise, is larger than the first.
It’s an important principle of ours that if a second movement is larger than the first, it will at least last the same amount of time as the first. Notice the right side of the second rectangle terminates in March of next year. This is why we have a March time forecast for this advance. This, coupled with the bullish RSI indicator, is strong technical evidence that this advancing wave of NVIDIA has further to go.
We think a price target of $192 is possible since it meets two conditions. It represents a gradual advance in the price of NVDA, and it ends in March. That would be a 32% gain from the current price. Thereafter, we’re expecting a major correction in Nvidia.
Fan Formation and Parallel Trend Channels As Explained In “Technical Analysis of Price Trends” by Edwards and McGee. The concept of similar time price movements is an old technical concept,. (The Sentiment King)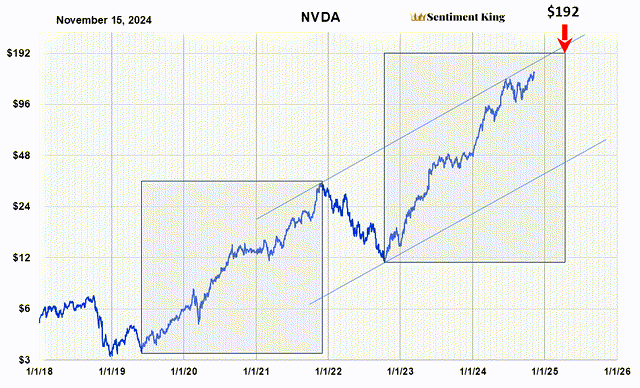
Conclusion
It’s our opinion investors should expect the two-year bull market in Nvidia to continue for another three and a half months, with a possible price target of $192.
Thereafter, they should expect a significant time and price correction, which should be assessed at that time.
Analyst’s Disclosure: I/we have no stock, option or similar derivative position in any of the companies mentioned, and no plans to initiate any such positions within the next 72 hours. I wrote this article myself, and it expresses my own opinions. I am not receiving compensation for it (other than from Seeking Alpha). I have no business relationship with any company whose stock is mentioned in this article.
Seeking Alpha’s Disclosure: Past performance is no guarantee of future results. No recommendation or advice is being given as to whether any investment is suitable for a particular investor. Any views or opinions expressed above may not reflect those of Seeking Alpha as a whole. Seeking Alpha is not a licensed securities dealer, broker or US investment adviser or investment bank. Our analysts are third party authors that include both professional investors and individual investors who may not be licensed or certified by any institute or regulatory body.
